






pH diagrams
A Python package to plot fractional composition diagrams and pH-log c diagrams
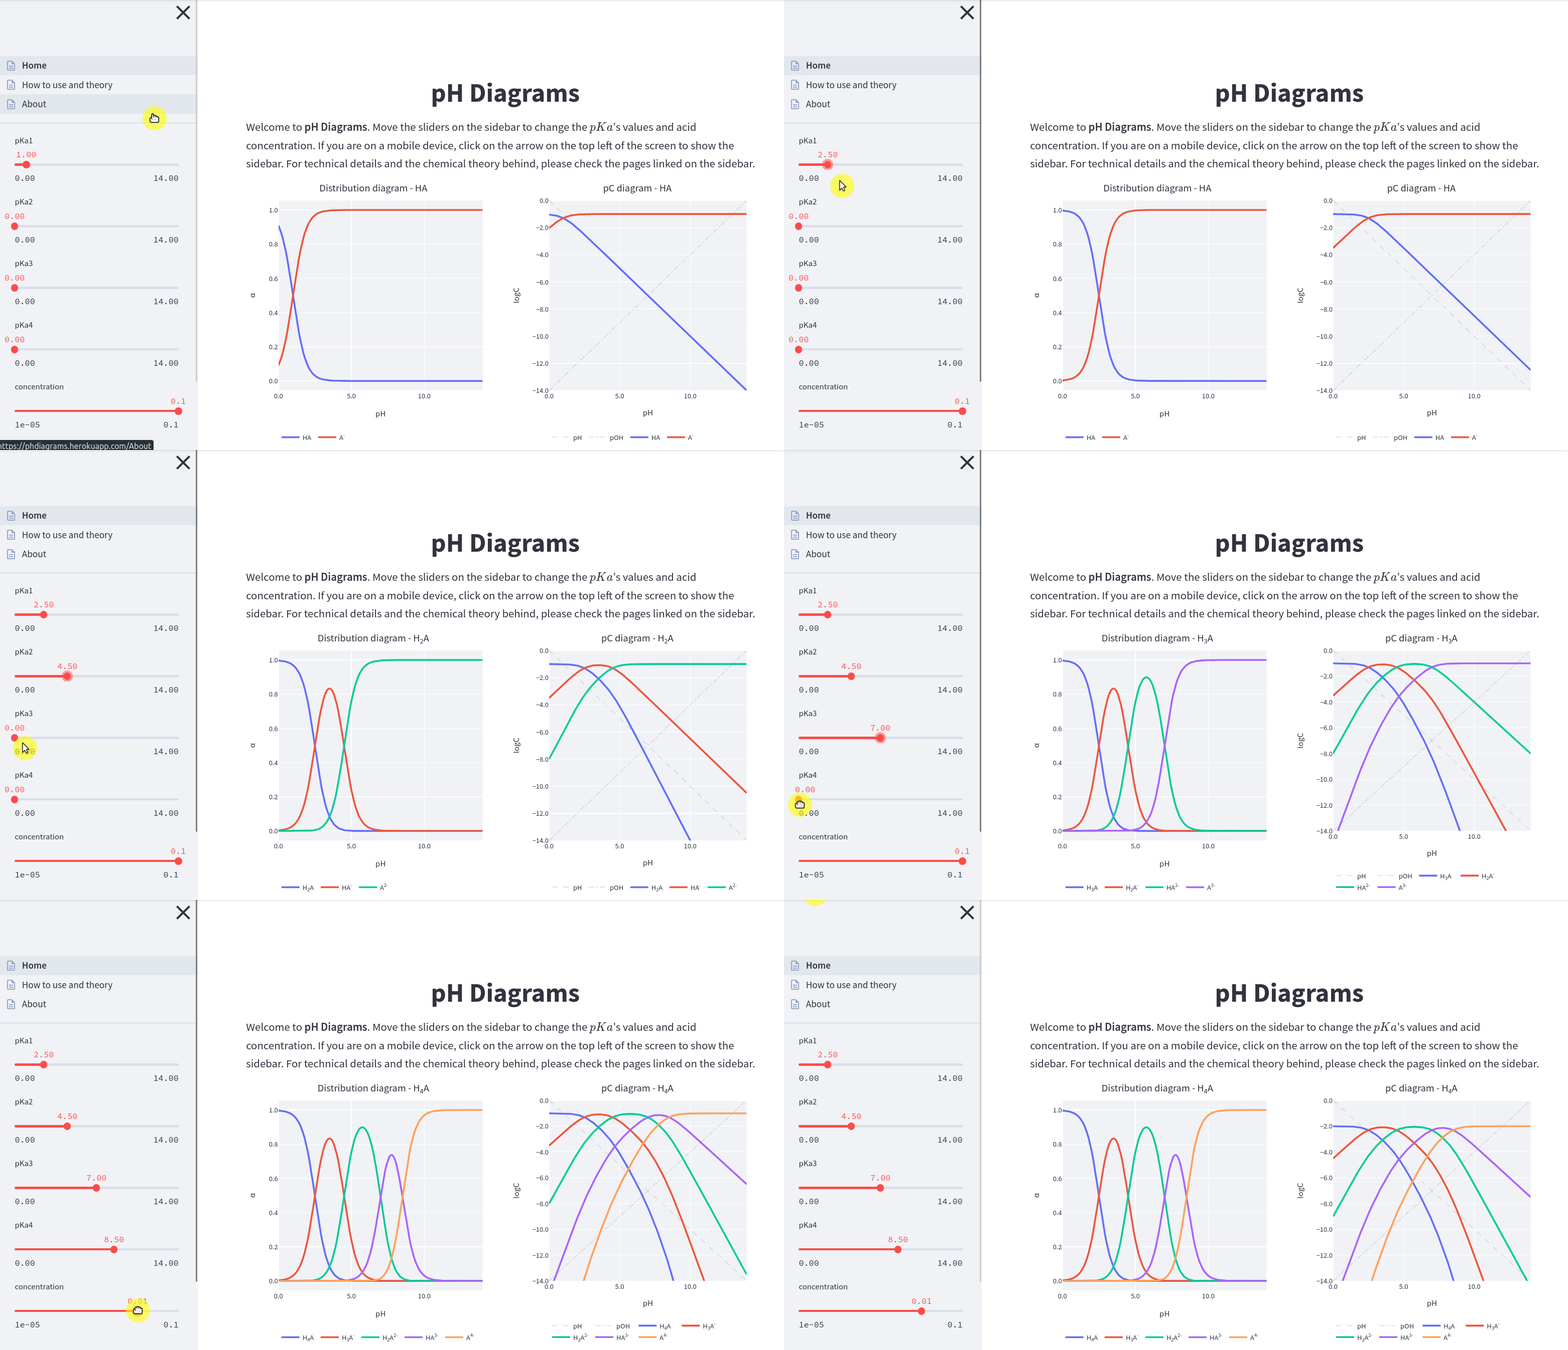
Interactive web app:

Installation
pip install pH-diagrams
Usage
The class Acid must be imported from ph_diagrams. To create diagrams for the acetic acid:
>>> from ph_diagrams import Acid
>>> import matplotlib.pyplot as plt
>>> fig, axs = plt.subplots(nrows=1, ncols=2)
>>> acetic_acid = Acid(pKa=(4.76,), acid_concentration=0.1)
>>> acetic_acid.plot(plot_type='distribution', backend='matplotlib',
                     title='Acetic acid - Distribution diagram',
                     ax=axs[0], legend=False)
>>> acetic_acid.plot(plot_type='pC', backend='matplotlib',
                     title='Acetic acid - pH-log c diagram', ax=axs[1])
>>> plt.show()
As can be seen, the parameter pKa must be a tuple even if there is only one value. The above example generates the following plot, with both diagrams side by side:
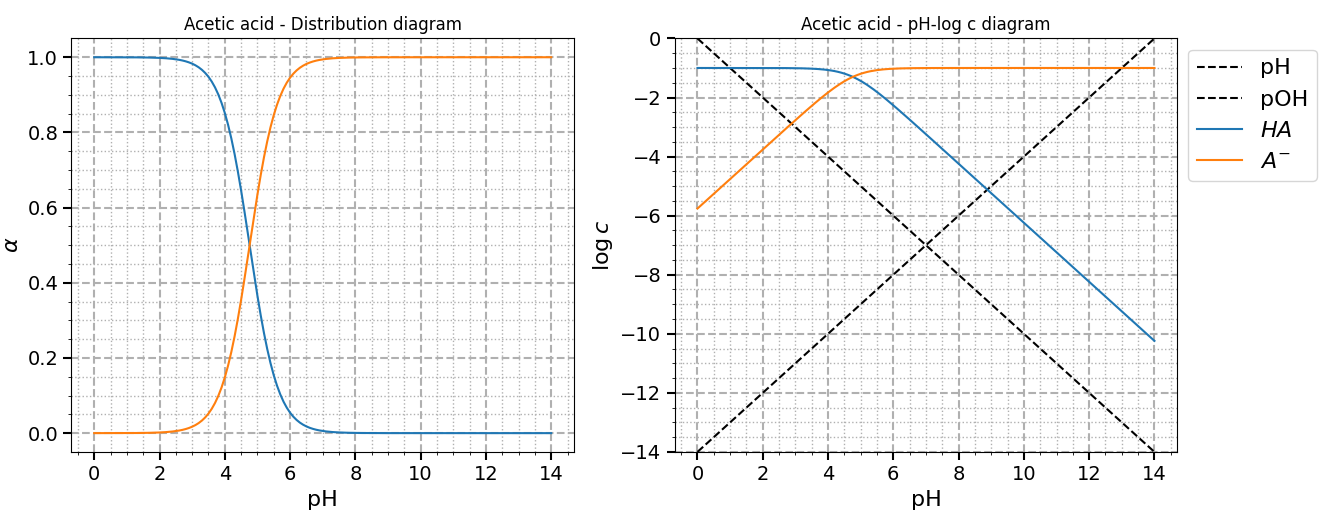
The plots above were made with Matplotlib, the default backend.
Changing the backend parameter to plotly, and removing the ax parameter (it works only with Matplotlib), will open a browser window for each plot. Since Plotly is interactive, the user can zoom, pan, and see values on hover.
Full documentation is hosted on Read the Docs.
A live interactive version of this project can be seen clicking in the following badge:
The web app was made with Streamlit and hosted on Heroku.
A brief explanation on the chemical theory behind each diagram can be seen here.
Local Streamlit app and Jupyter notebooks
This repo has Jupyter Notebooks and scripts for a fully functional Streamlit app. First, create a virtual environment, clone the repo and install dependencies:
python -m venv .venv
source .venv/bin/activate
git clone git@github.com:chicolucio/pH-diagrams.git
cd pH-diagrams
pip install -r requirements.txt
This considers that you have Jupyter Notebook installed. If not, install it with pip install notebook.
For more basic usage examples, see the tutorial.ipynb notebook on notebooks folder. In the same folder, the tutorial_interactive_ipywidgets.ipynb file shows how to use ipywidgets to create interactive diagrams. Just run jupyter notebook on a terminal from the repo root folder and select the files.
A local version of the Streamlit app can be used running, from the repo root folder, streamlit run Home.py on a terminal. A browser window will open (if not, follow the instructions shown on the terminal output).
Contributing
All contributions are welcome.
Issues
Feel free to submit issues regarding:
recommendations
more examples for the tutorial
enhancement requests and new useful features
code bugs
Pull requests
before starting to work on your pull request, please submit an issue first
fork the repo
clone the project to your own machine
commit changes to your own branch
push your work back up to your fork
submit a pull request so that your changes can be reviewed
For full contribution guidelines and details check out our contributing guide.
Citing
If you use this project in a scientific publication or in classes, please consider citing as
F. L. S. Bustamante & H. B. Soares & N. O. Souza, pH diagrams, 2021. Available at: https://github.com/chicolucio/pH-diagrams
1 maintainer

Release files for pH-diagrams 0.3.3
For a detailed explanation of source distributions (sdists) and built distributions (wheels), please see the package formats documentation.
Source distribution (sdist)
| File | Size | Uploaded | |
|---|---|---|---|
| pH-diagrams-0.3.3.tar.gz | 3.6 MB | Details |
Built distribution (wheel)
| File | Interpreter | ABI | Platform | Reset |
|---|---|---|---|---|
| pH_diagrams-0.3.3-py3-none-any.whl | Python 3 | none | any | Details |
Total release size: 3.6 MB
Release files / pH-diagrams-0.3.3.tar.gz
| Download URL | pH-diagrams-0.3.3.tar.gz |
|---|---|
| Size | 3.6 MB |
| Tags | Source |
|
SHA-256 checksum How to use checksums |
6446d402725fff02b6c4902a20811d9a32aaaa7f1a02135876e3e737b98bf35e
|
|
BLAKE2b-256 checksum How to use checksums |
80aa17bb7c6570d3064d8f3351ea7900a127569700653d99748581944aadab2e
|
| Upload date | |
|
Uploaded using Trusted Publishing? What is trusted publishing? |
No |
| Uploaded via |
twine/4.0.1 CPython/3.10.2
|
Release files / pH_diagrams-0.3.3-py3-none-any.whl
| Download URL | pH_diagrams-0.3.3-py3-none-any.whl |
|---|---|
| Size | 7.8 kB |
| Tags | Python 3 |
|
SHA-256 checksum How to use checksums |
65c6ddb8b3fddd2fd49cbd91db34db69fc925a6f57ad0babfb5622e1ec6b44b0
|
|
BLAKE2b-256 checksum How to use checksums |
ee568e2773bd95611525198378b23ad93b1b9a291d4c3b942ab58370f345f4c8
|
| Upload date | |
|
Uploaded using Trusted Publishing? What is trusted publishing? |
No |
| Uploaded via |
twine/4.0.1 CPython/3.10.2
|














