Python package to plot pH diagrams
Project description


pH diagrams
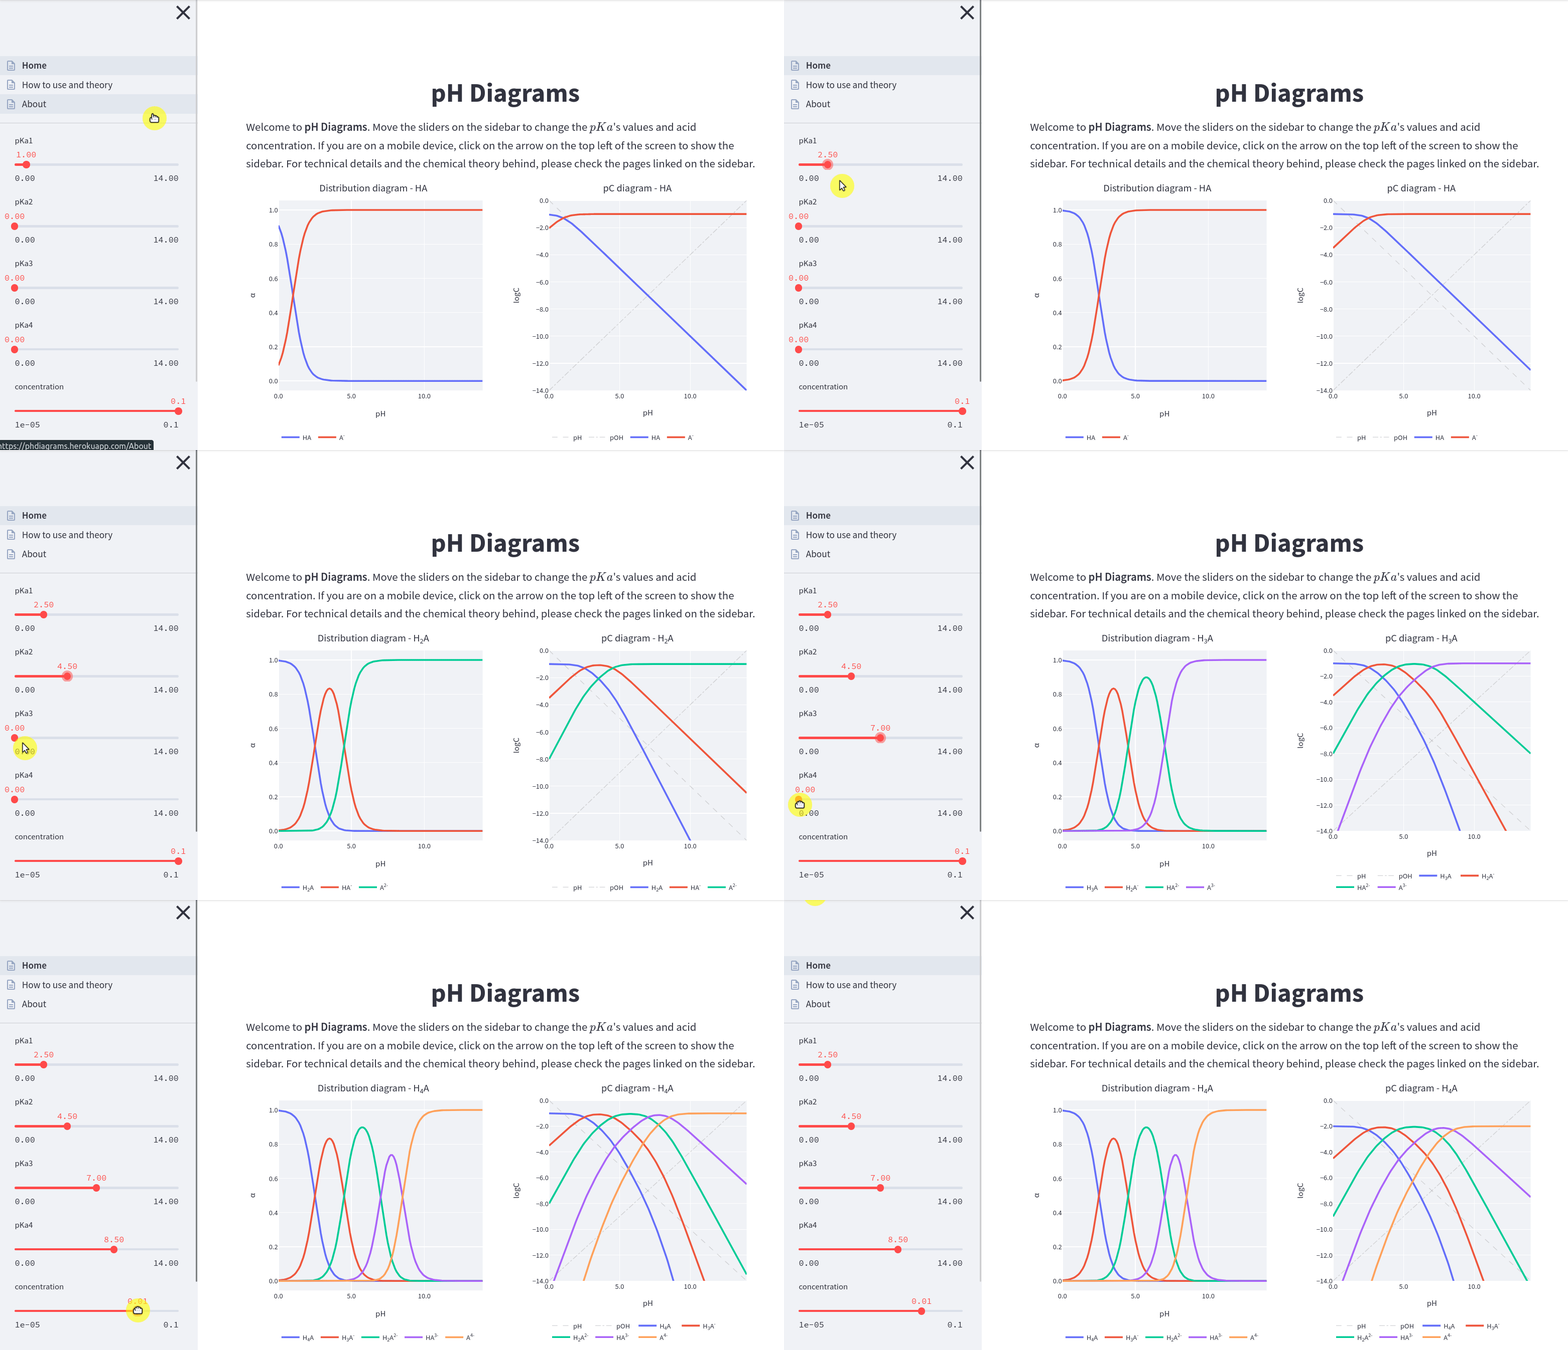
A Python package to plot fractional composition diagrams and pH-log c diagrams

Installation
pip install pH-diagrams
Usage
Full documentation is hosted on Read the Docs
For basic usage see the tutorial notebook on notebooks folder.
A live interactive version of this project can be seen clicking in the following badge:

Contributing
All contributions are welcome.
Issues
Feel free to submit issues regarding:
recommendations
more examples for the tutorial
enhancement requests and new useful features
code bugs
Pull requests
before starting to work on your pull request, please submit an issue first
fork the repo
clone the project to your own machine
commit changes to your own branch
push your work back up to your fork
submit a pull request so that your changes can be reviewed
For full contribution guidelines and details check out our contributing guide.
Citing
If you use this project in a scientific publication or in classes, please consider citing as
F. L. S. Bustamante & H. B. Soares & N. O. Souza, pH diagrams, 2021. Available at: https://github.com/chicolucio/pH-diagrams
Project details
Release history Release notifications | RSS feed
Download files
Download the file for your platform. If you're not sure which to choose, learn more about installing packages.
Source Distribution
Built Distribution
Hashes for pH_diagrams-0.3.1-py3-none-any.whl
| Algorithm | Hash digest | |
|---|---|---|
| SHA256 | bd57266d16caab88d31d97195b1bd4bbc64904c5cac13fe39b0d192b18b862ee |
|
| MD5 | a6a1698b0d57153c126156deb4882448 |
|
| BLAKE2b-256 | b73c0ff22d7c7e3ff0f093b4fdc820000fe138312ef6d6695d4d48e73d8ebc57 |


