pdbp (Pdb+): A drop-in replacement for pdb and pdbpp.

Project description


pdbp (Pdb+) 
pdbp (Pdb+) is an advanced console debugger for Python. It can be used as a drop-in replacement for pdb and pdbpp.
pdbp (Pdb+) makes Python debugging a lot easier (and more fun!)
Installation:
pip install pdbp
Then add import pdbp to an __init__.py of your project, which will automatically make Pdb+ the default debugger at breakpoints:
import pdbp
(If using flake8 for code-linting, you may want to add # noqa to that line):
import pdbp # noqa
You can also make pdbp the default debugger by setting an environmental variable:
PYTHONBREAKPOINT=pdbp.set_trace
Usage:
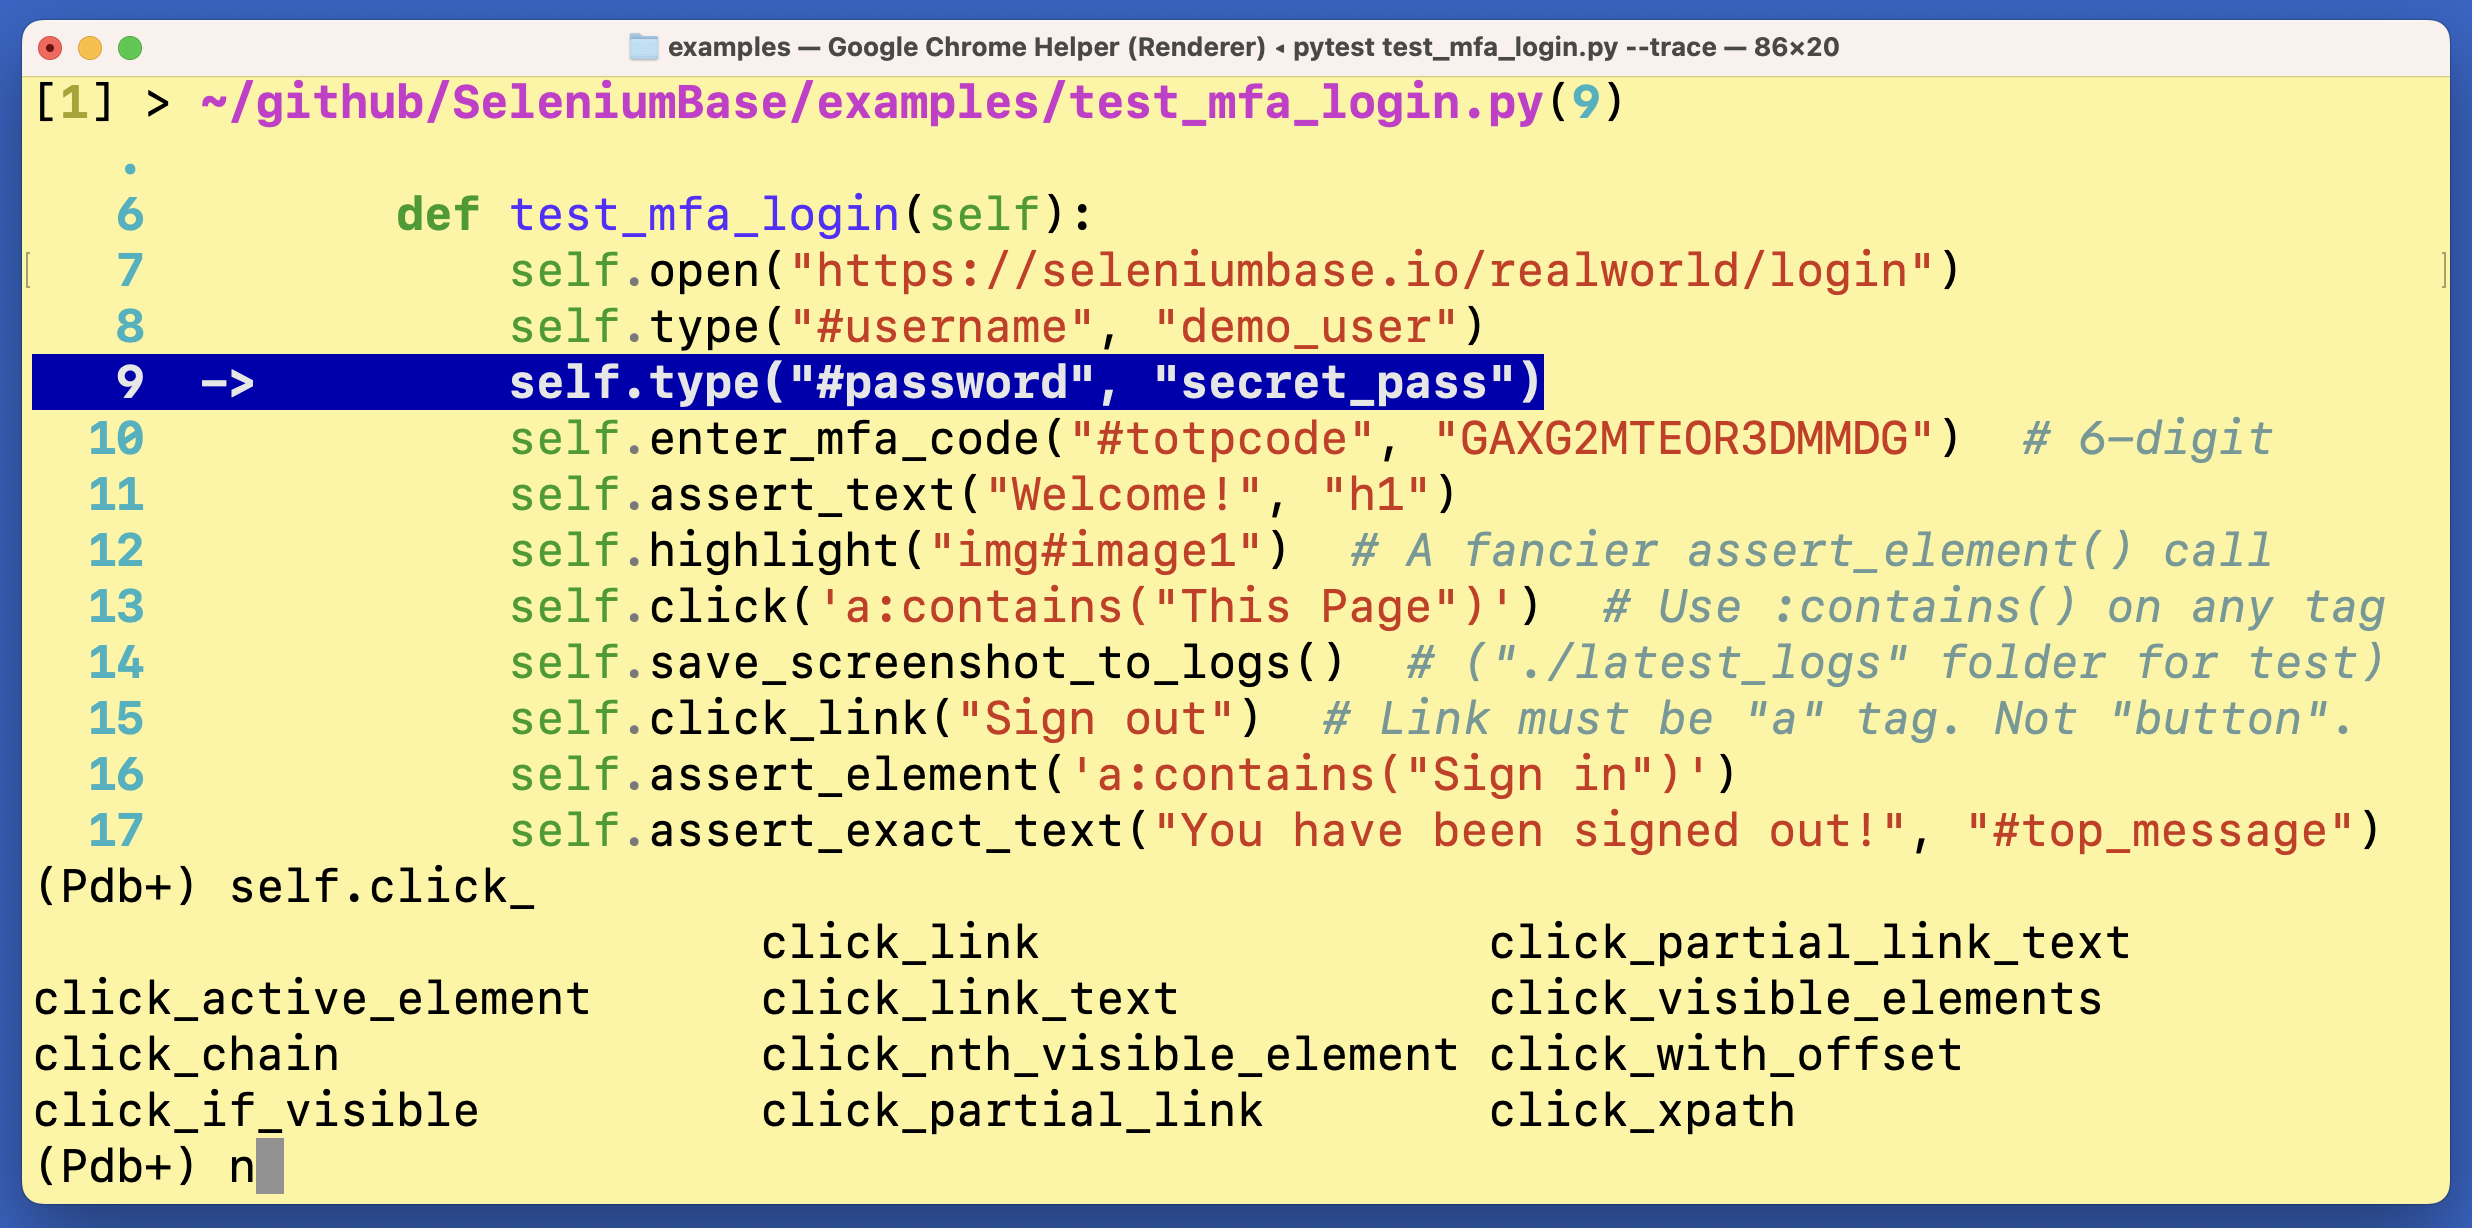
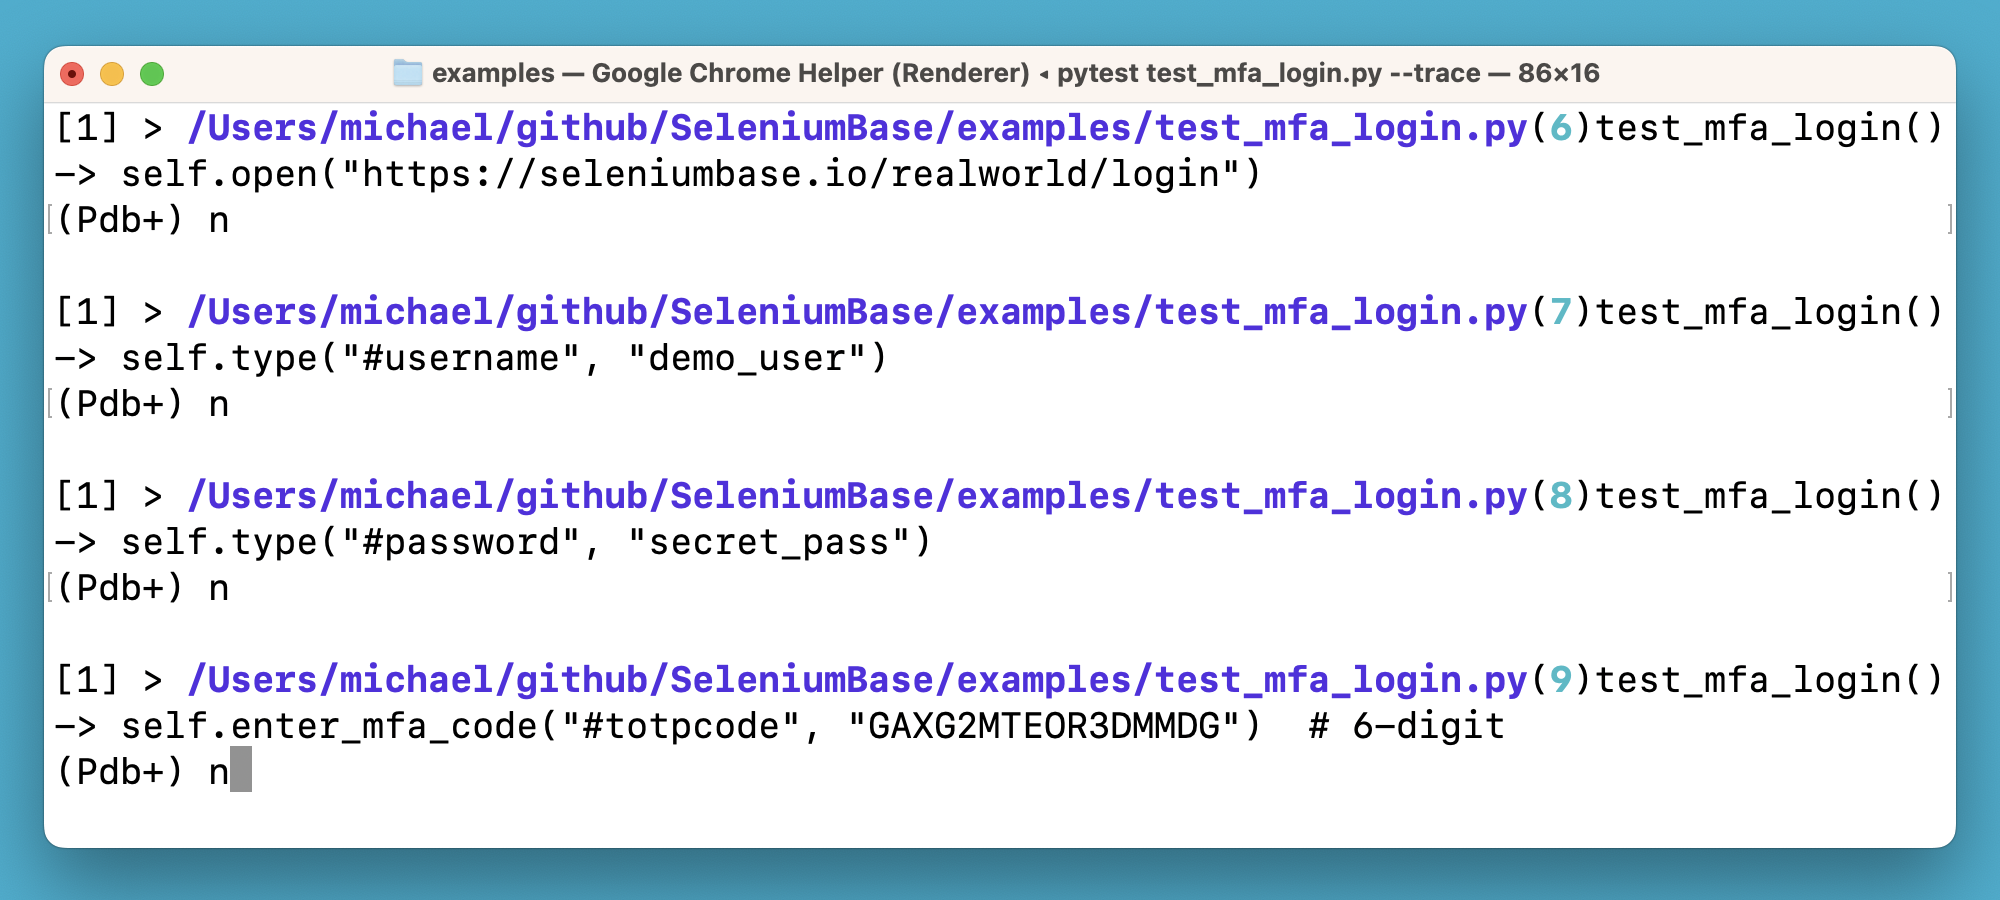
To trigger a breakpoint in your code with pytest, add --trace (to start tests with a breakpoint) or --pdb (to trigger a breakpoint if a test fails).
To trigger a breakpoint from a pure python run, use:
python -m pdbp <script.py>
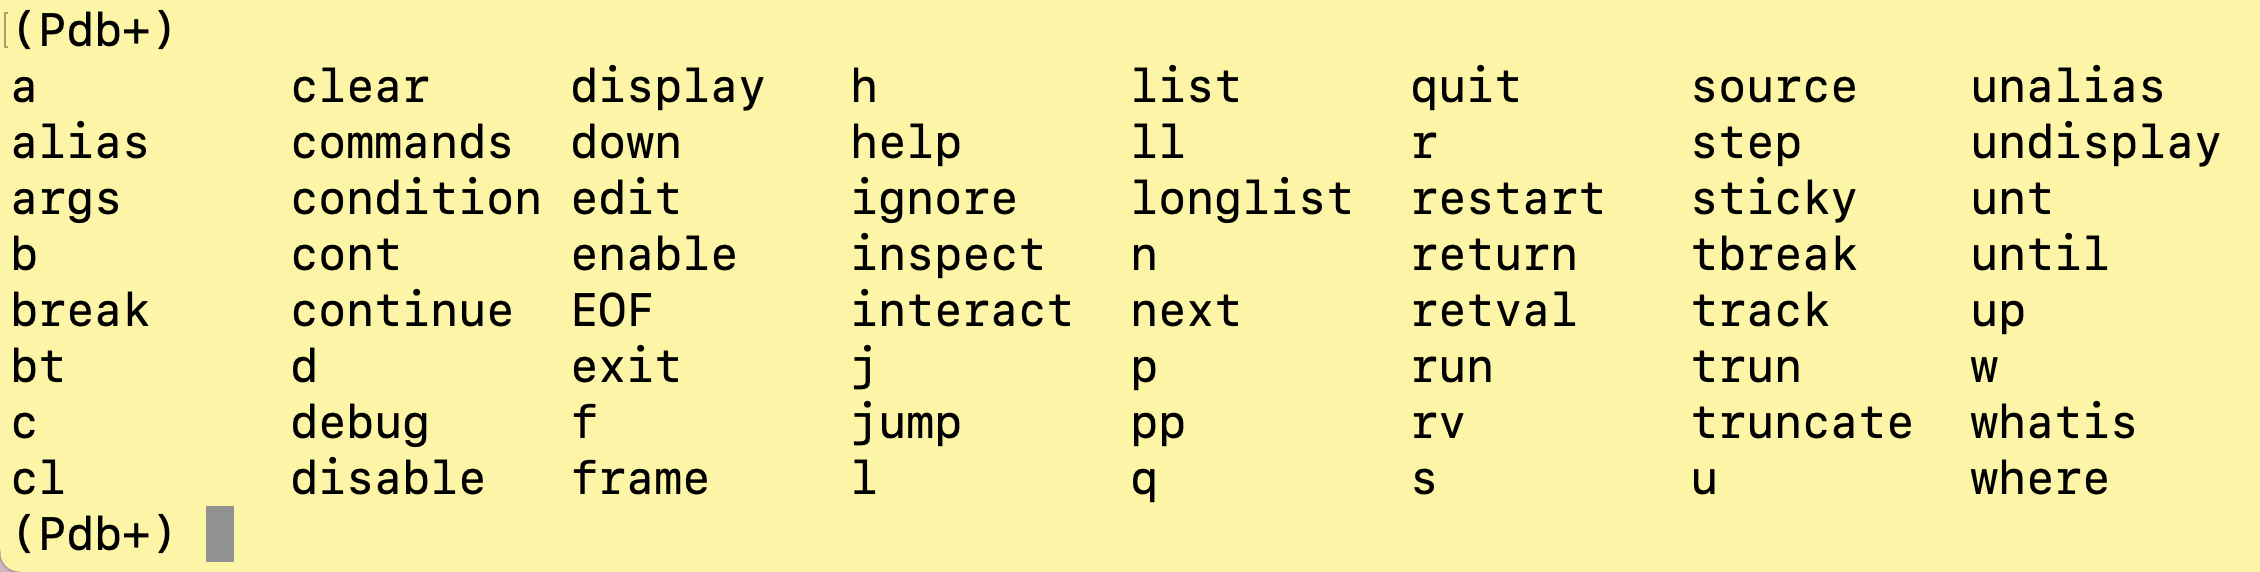
Basic Pdb+ console commands:
n, c, s, u, d => next, continue, step, up, down
(To learn more Pdb+ console commands, type help in the Pdb+ console and press Enter/Return.)
pdbp (Pdb+) makes improvements to pdbpp so that it works in all environments. It also includes other bug-fixes. "Sticky" mode is the default option, which shows multiple lines of code while letting you see where you're going (while typing n + Enter).
If you somehow reset pdb to Python's built-in version, you can always replace pdb with pdbp again as the default debugger by running this:
import pdb
import pdbp
for key in pdbp.__dict__.keys():
    pdb.__dict__[key] = pdbp.__dict__[key]
Here's how to customize pdbp/pdb options if you don't like the default settings: (Shown below are the default settings.)
import pdb
if hasattr(pdb, "DefaultConfig"):
    pdb.DefaultConfig.filename_color = pdb.Color.fuchsia
    pdb.DefaultConfig.line_number_color = pdb.Color.turquoise
    pdb.DefaultConfig.truncate_long_lines = False
    pdb.DefaultConfig.sticky_by_default = True
You can also trigger Pdb+ activation like this:
import pdbp
pdbp.set_trace()
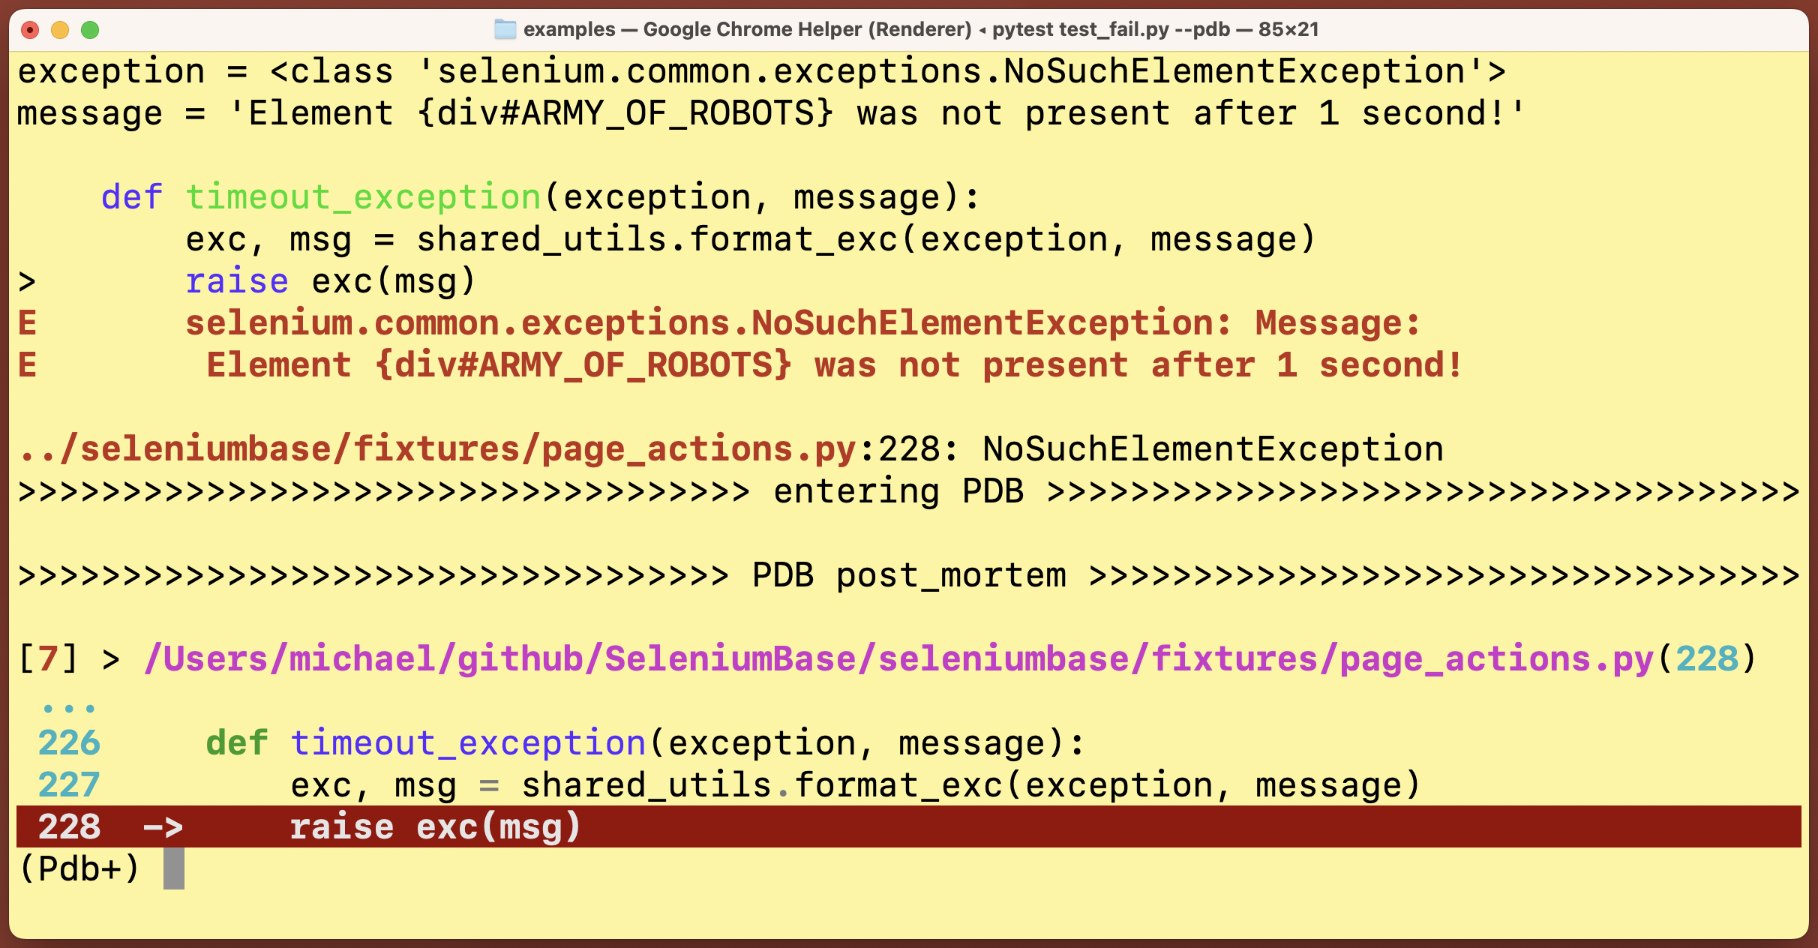
pdbp (Pdb+) commands:
Post Mortem Debug Mode:
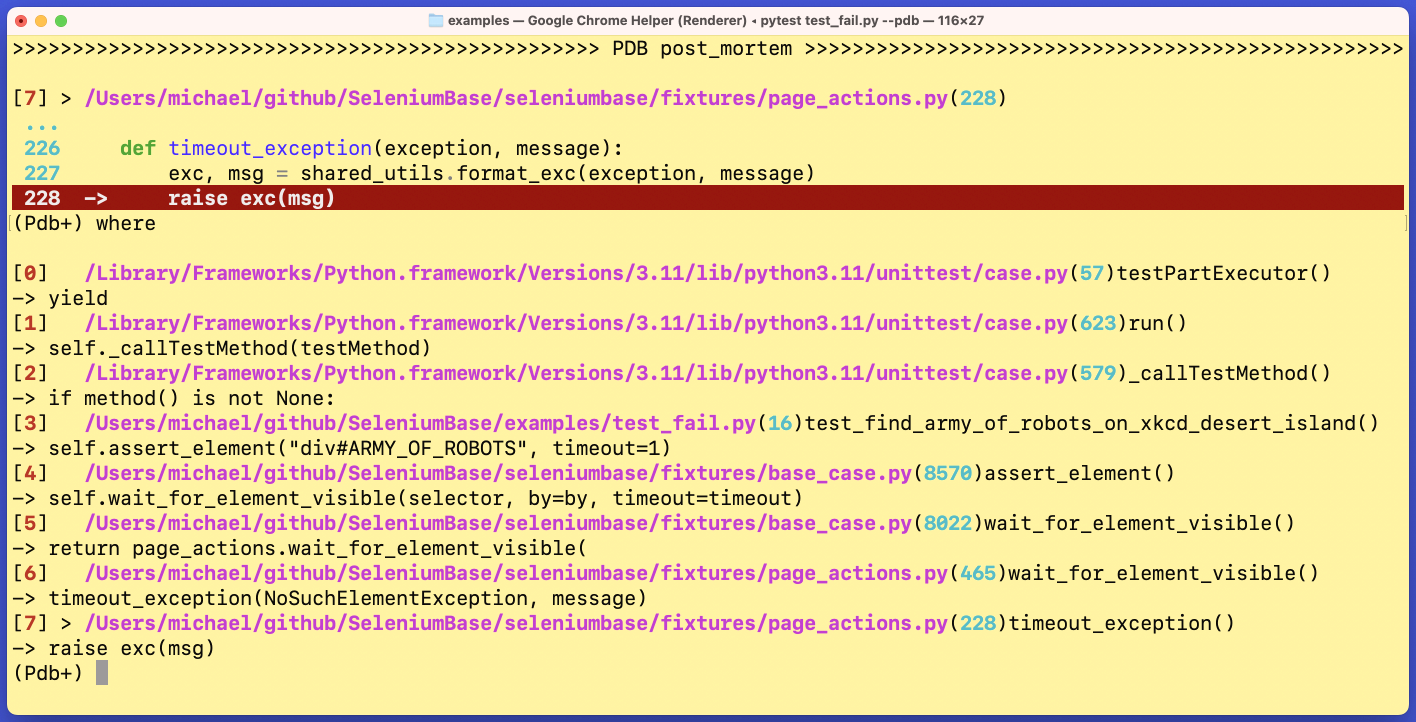
The where / w command, which displays the current stack:
Sticky Mode vs Non-Sticky Mode:
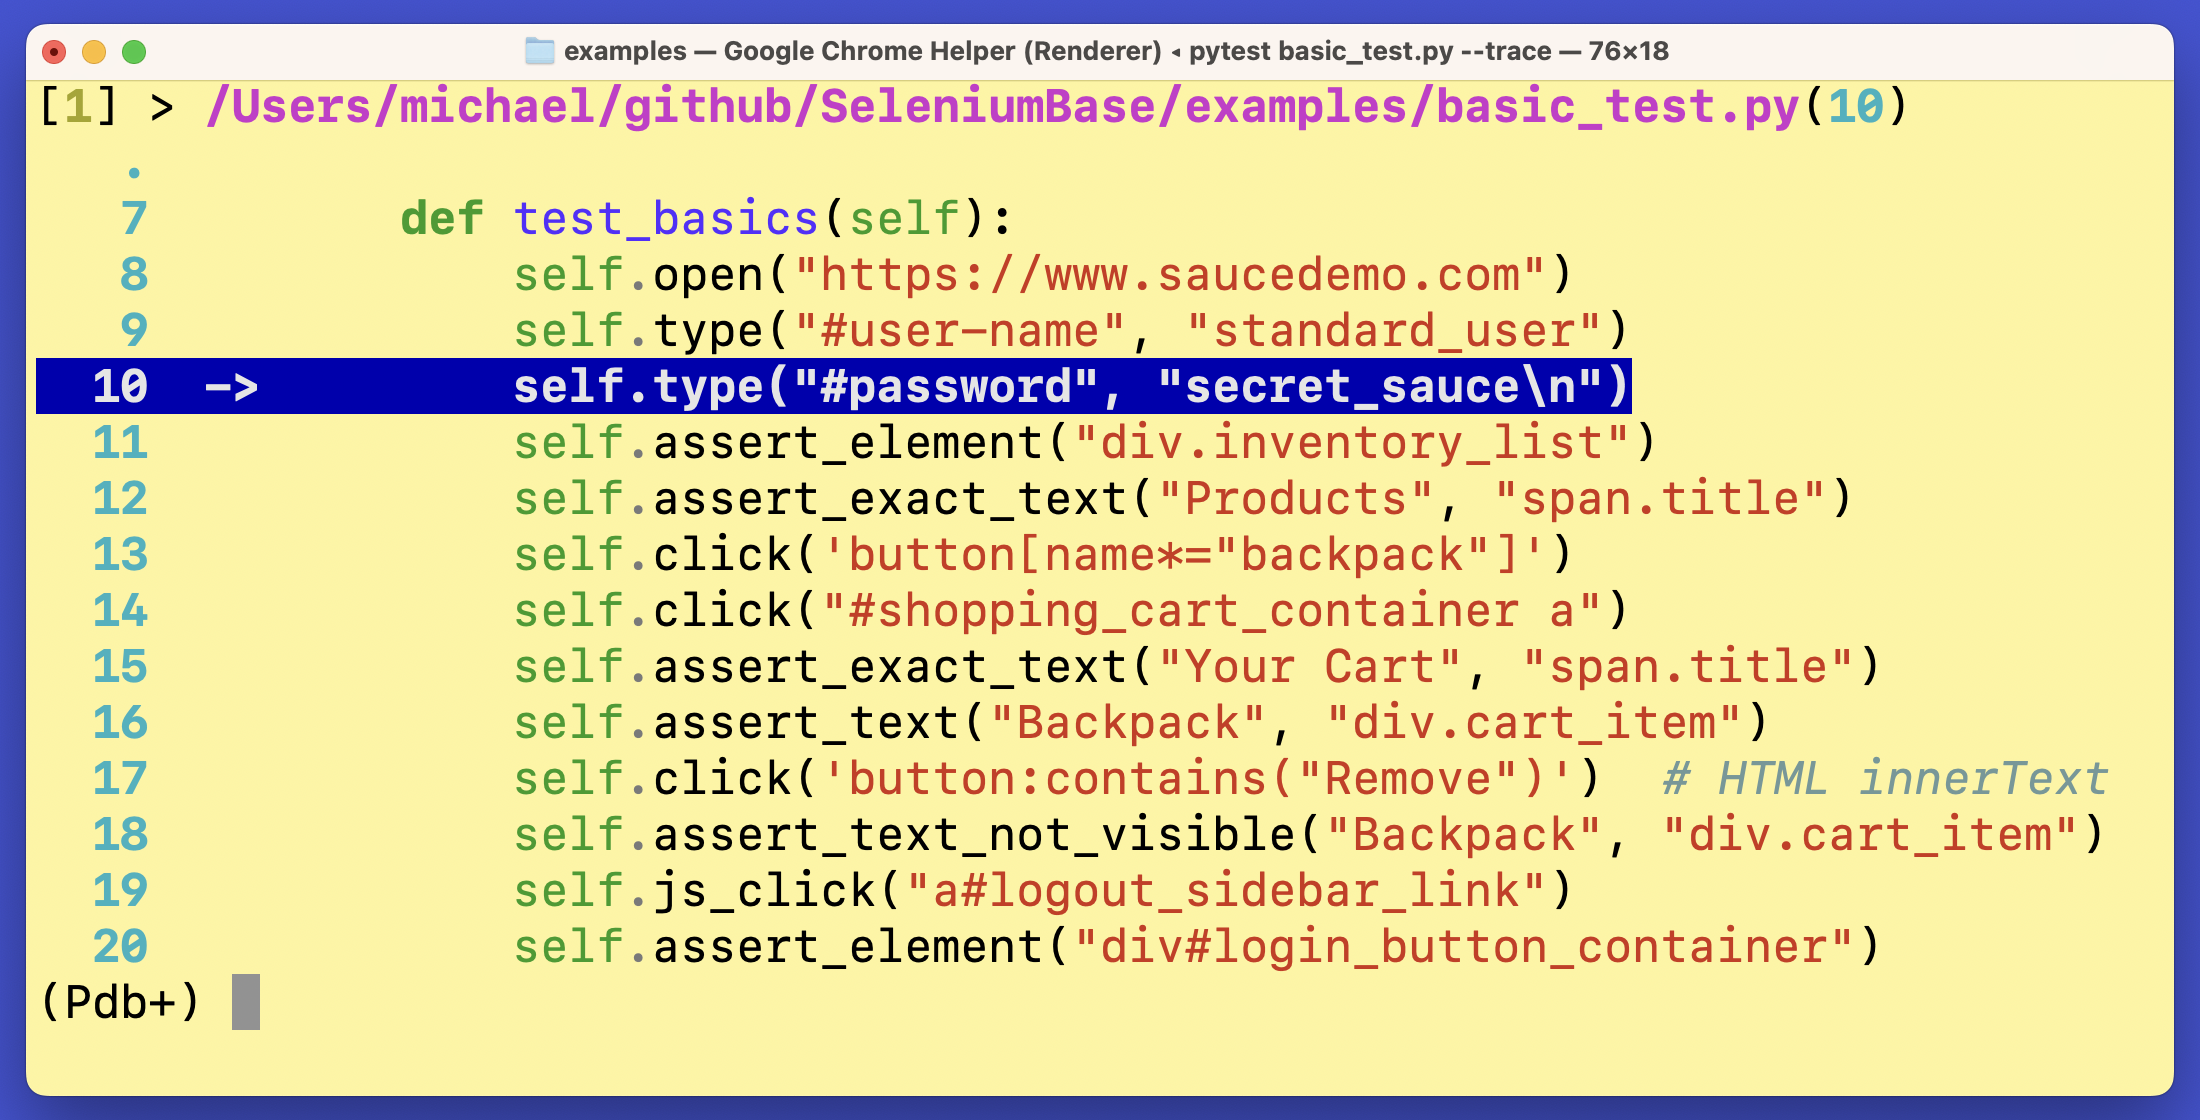
The default mode (sticky) lets you see a lot more lines of code from the debugger when active. In Non-Sticky mode, only one line of code is shown at a time. You can switch between the two modes by typing sticky in the Pdb+ console prompt and pressing Enter/Return.
Sticky Mode:

Non-Sticky Mode:
Tab completion:

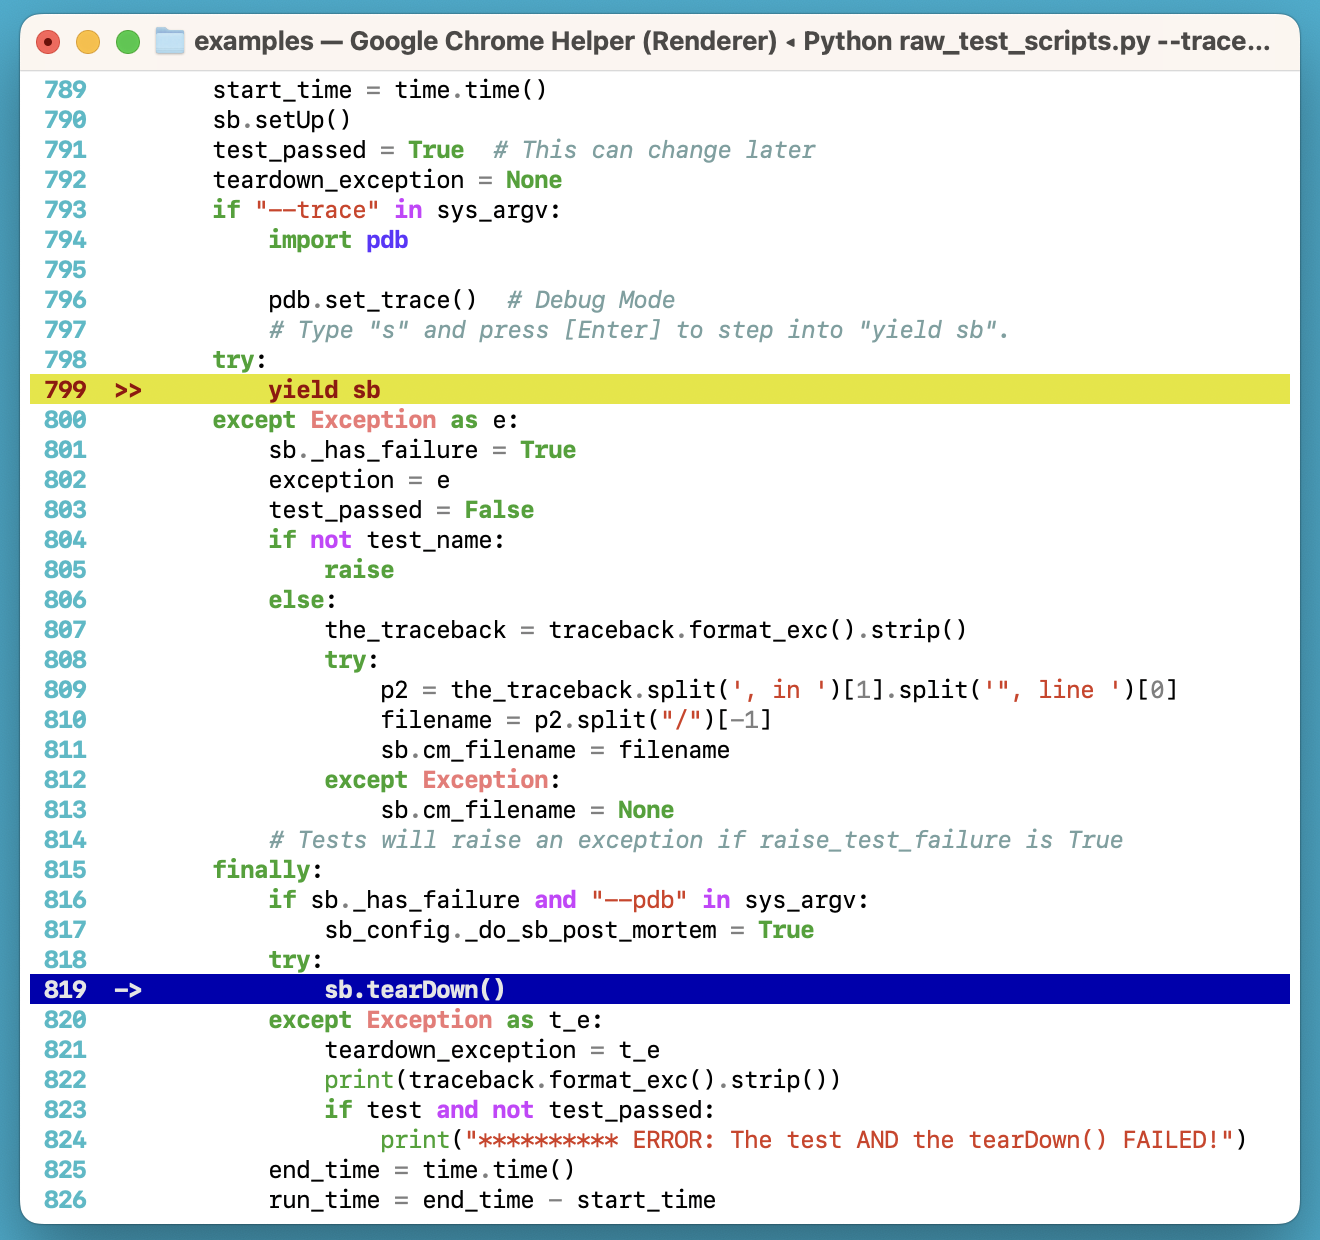
Multi-layer highlighting in the same stack:
More examples:
Pdb+ is used by packages such as seleniumbase:
(Pdb+ is maintained by the SeleniumBase Dev Team)
Release history Release notifications | RSS feed


Download files
Download the file for your platform. If you're not sure which to choose, learn more about installing packages.
Source Distribution
Built Distribution
Filter files by name, interpreter, ABI, and platform.
If you're not sure about the file name format, learn more about wheel file names.
Copy a direct link to the current filters
File details
Details for the file pdbplus-1.8.2.tar.gz.
File metadata
- Download URL: pdbplus-1.8.2.tar.gz
- Upload date:
- Size: 10.1 kB
- Tags: Source
- Uploaded using Trusted Publishing? No
- Uploaded via: twine/6.2.0 CPython/3.11.9
File hashes
| Algorithm | Hash digest | |
|---|---|---|
| SHA256 |
25a3babeaf05939fd876f8de83c978e0b73a59c422a375e9251fd115ab4da365
|
|
| MD5 |
7e418c2c1f556eed28ed92b9dfc947db
|
|
| BLAKE2b-256 |
0a8e7c7775af2c9508a25e2c4f0b40f211b566b790cbaae8880bd1cbfd93696f
|
File details
Details for the file pdbplus-1.8.2-py3-none-any.whl.
File metadata
- Download URL: pdbplus-1.8.2-py3-none-any.whl
- Upload date:
- Size: 8.3 kB
- Tags: Python 3
- Uploaded using Trusted Publishing? No
- Uploaded via: twine/6.2.0 CPython/3.11.9
File hashes
| Algorithm | Hash digest | |
|---|---|---|
| SHA256 |
3ab2b70a53441c9d2988c13f72c30f1506aaf390b8c16fbf9fe34b23ff63ebc1
|
|
| MD5 |
1d2dcf1731114dafd94b72191e1e8397
|
|
| BLAKE2b-256 |
22fd939ff43e0787decf17878533eb570fd8852e5aa8ece0b8c2c1869ff229b2
|


