A simple python package to print a keras NN training history.

Project description
Plot Keras History


A Python package to print a Keras model training history.
How do I install this package?
As usual, just download it using pip:
pip install plot_keras_history
Usage
Let's say you have a model generated by the function my_keras_model.
Plotting a training history
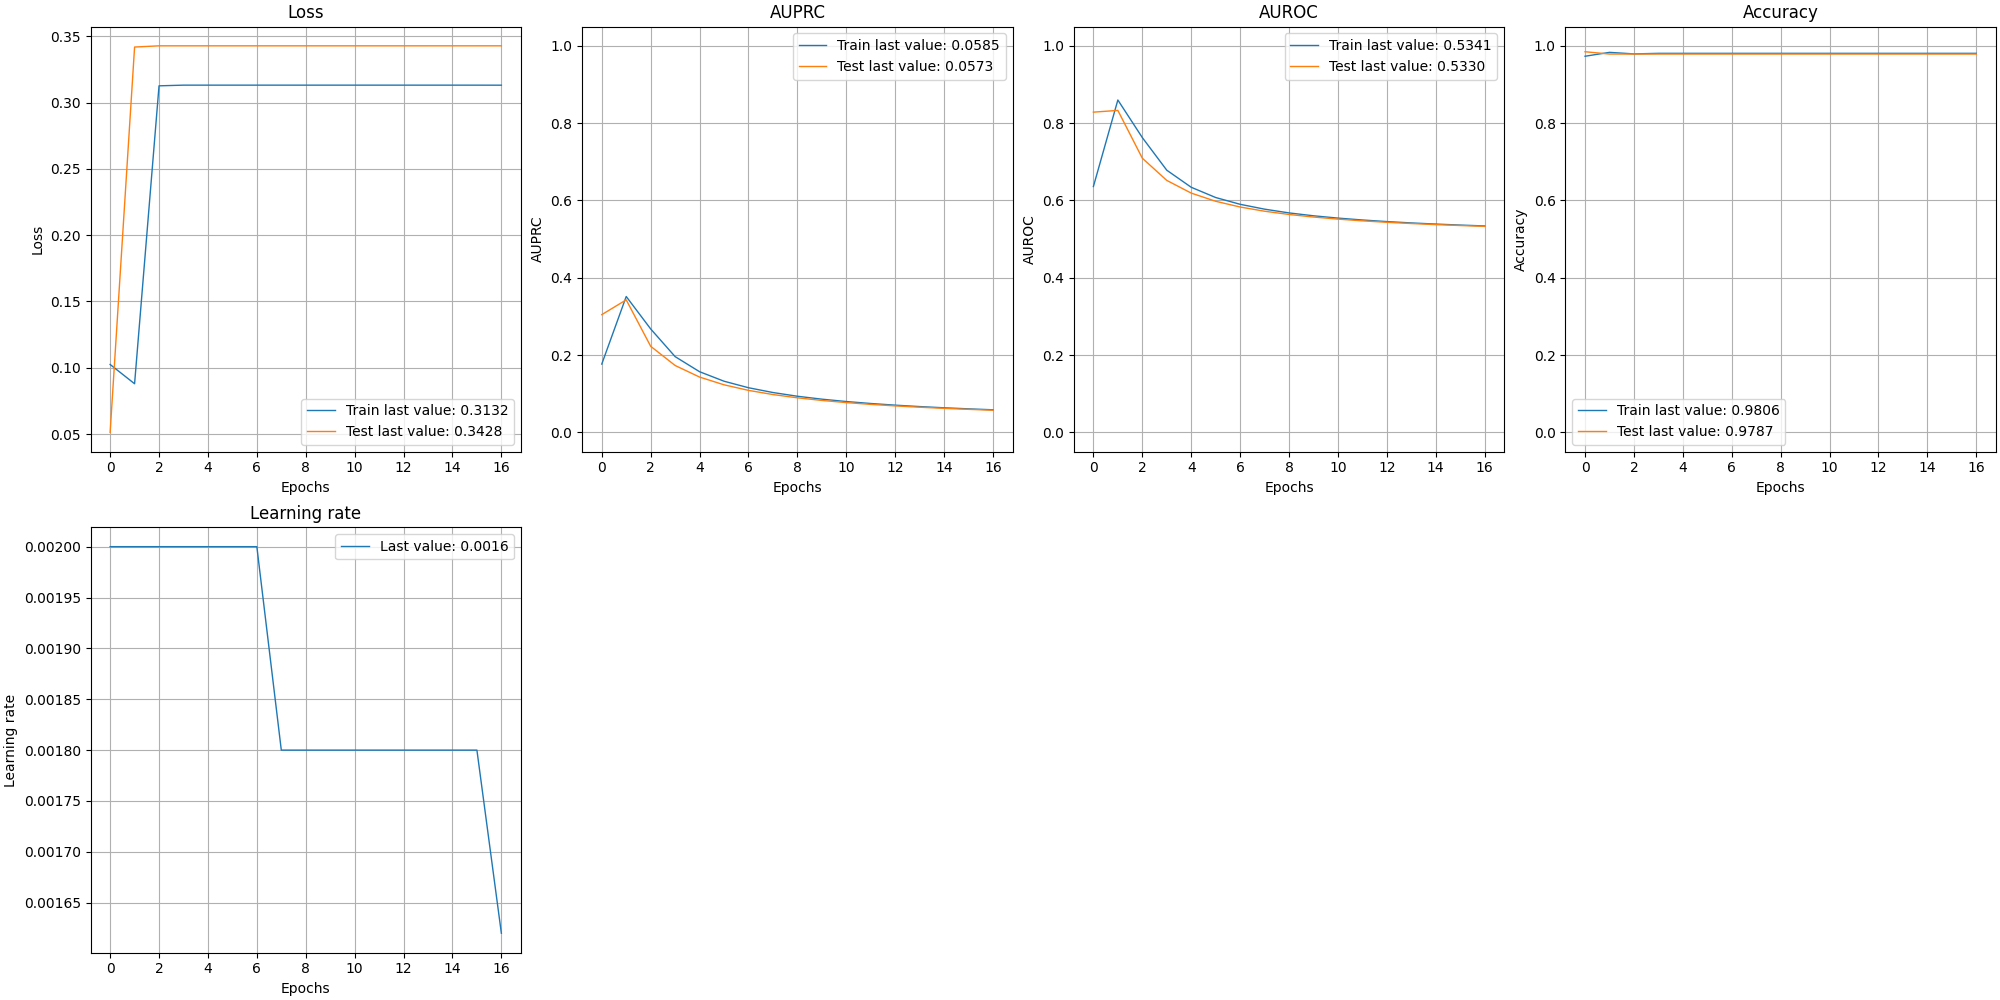
In the following example, we will see how to plot and either show or save the training history:
from keras.models import Sequential
from keras.layers import Dense
import matplotlib.pyplot as plt
import numpy as np
from plot_keras_history import show_history, plot_history

model = Sequential([
    Dense(1, activation="sigmoid")
])
model.compile(
    optimizer="nadam",
    loss="binary_crossentropy"
)
X = np.random.uniform(size=(100, 100))
y = np.random.randint(2, size=(100))
history = model.fit(
    X[:50], y[:50],
    validation_data=(X[50:], y[50:]),
    epochs=10,
    verbose=False
)
show_history(history)
plot_history(history, path="standard.png")
plt.close()
Plotting into separate graphs
By default, the graphs are all in one big image, but for various reasons, you might need them one by one:
from keras.models import Sequential
from keras.layers import Dense
import matplotlib.pyplot as plt
import numpy as np
from plot_keras_history import plot_history

model = Sequential([
    Dense(1, activation="sigmoid")
])
model.compile(
    optimizer="nadam",
    loss="binary_crossentropy"
)
X = np.random.uniform(size=(100, 100))
y = np.random.randint(2, size=(100))
history = model.fit(
    X[:50], y[:50],
    validation_data=(X[50:], y[50:]),
    epochs=10,
    verbose=False
)
plot_history(history, path="singleton", single_graphs=True)
plt.close()
Plotting multiple histories
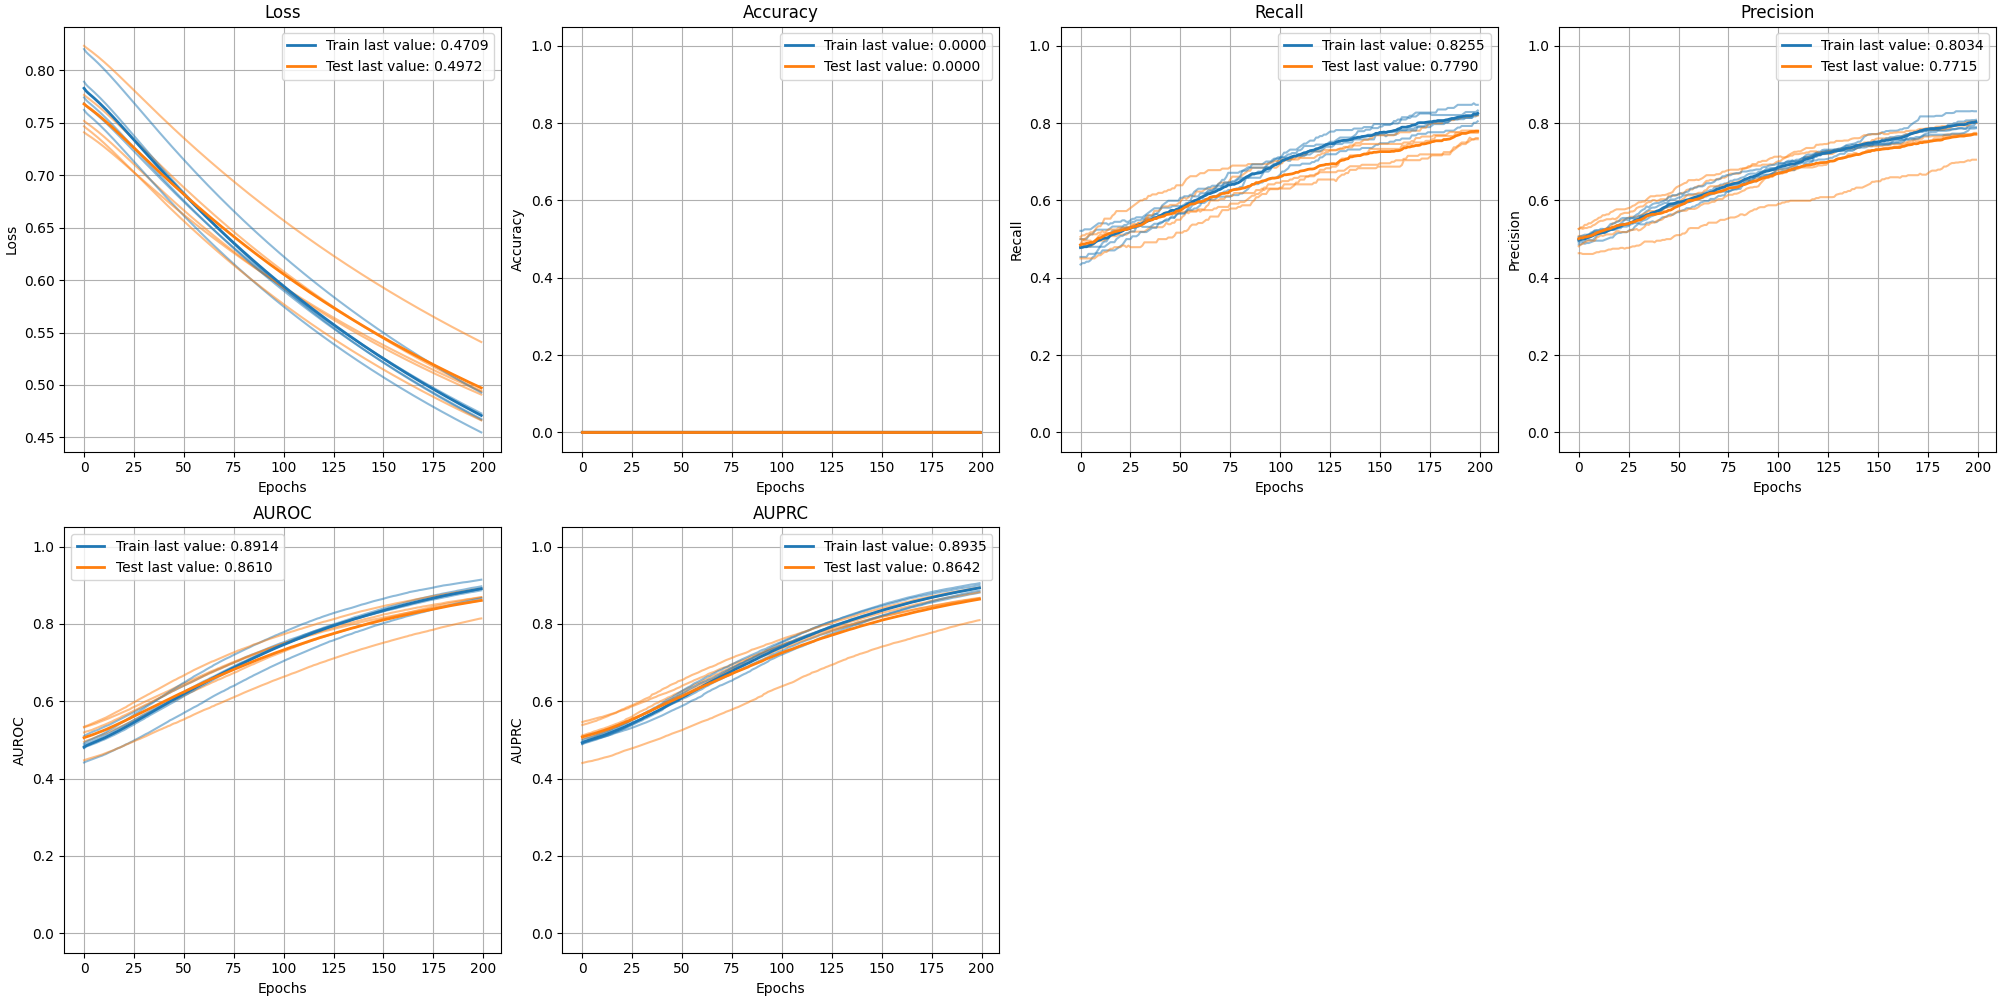
Suppose you are training your model on multiple holdouts and want to plot all of them, plus an average. Fortunately, we've got you covered!
from keras.models import Sequential
from keras.layers import Dense
import matplotlib.pyplot as plt
import numpy as np
from plot_keras_history import plot_history

histories = []
for holdout in range(10):
    model = Sequential([
        Dense(1, activation="sigmoid")
    ])
    model.compile(
        optimizer="nadam",
        loss="binary_crossentropy"
    )
    X = np.random.uniform(size=(100, 100))
    y = np.random.randint(2, size=(100))
    history = model.fit(
        X[:50], y[:50],
        validation_data=(X[50:], y[50:]),
        epochs=10,
        verbose=False
    )
    histories.append(history)

plot_history(
    histories,
    show_standard_deviation=False,
    show_average=True
)
plt.close()
Reducing the history noise with Savgol Filters
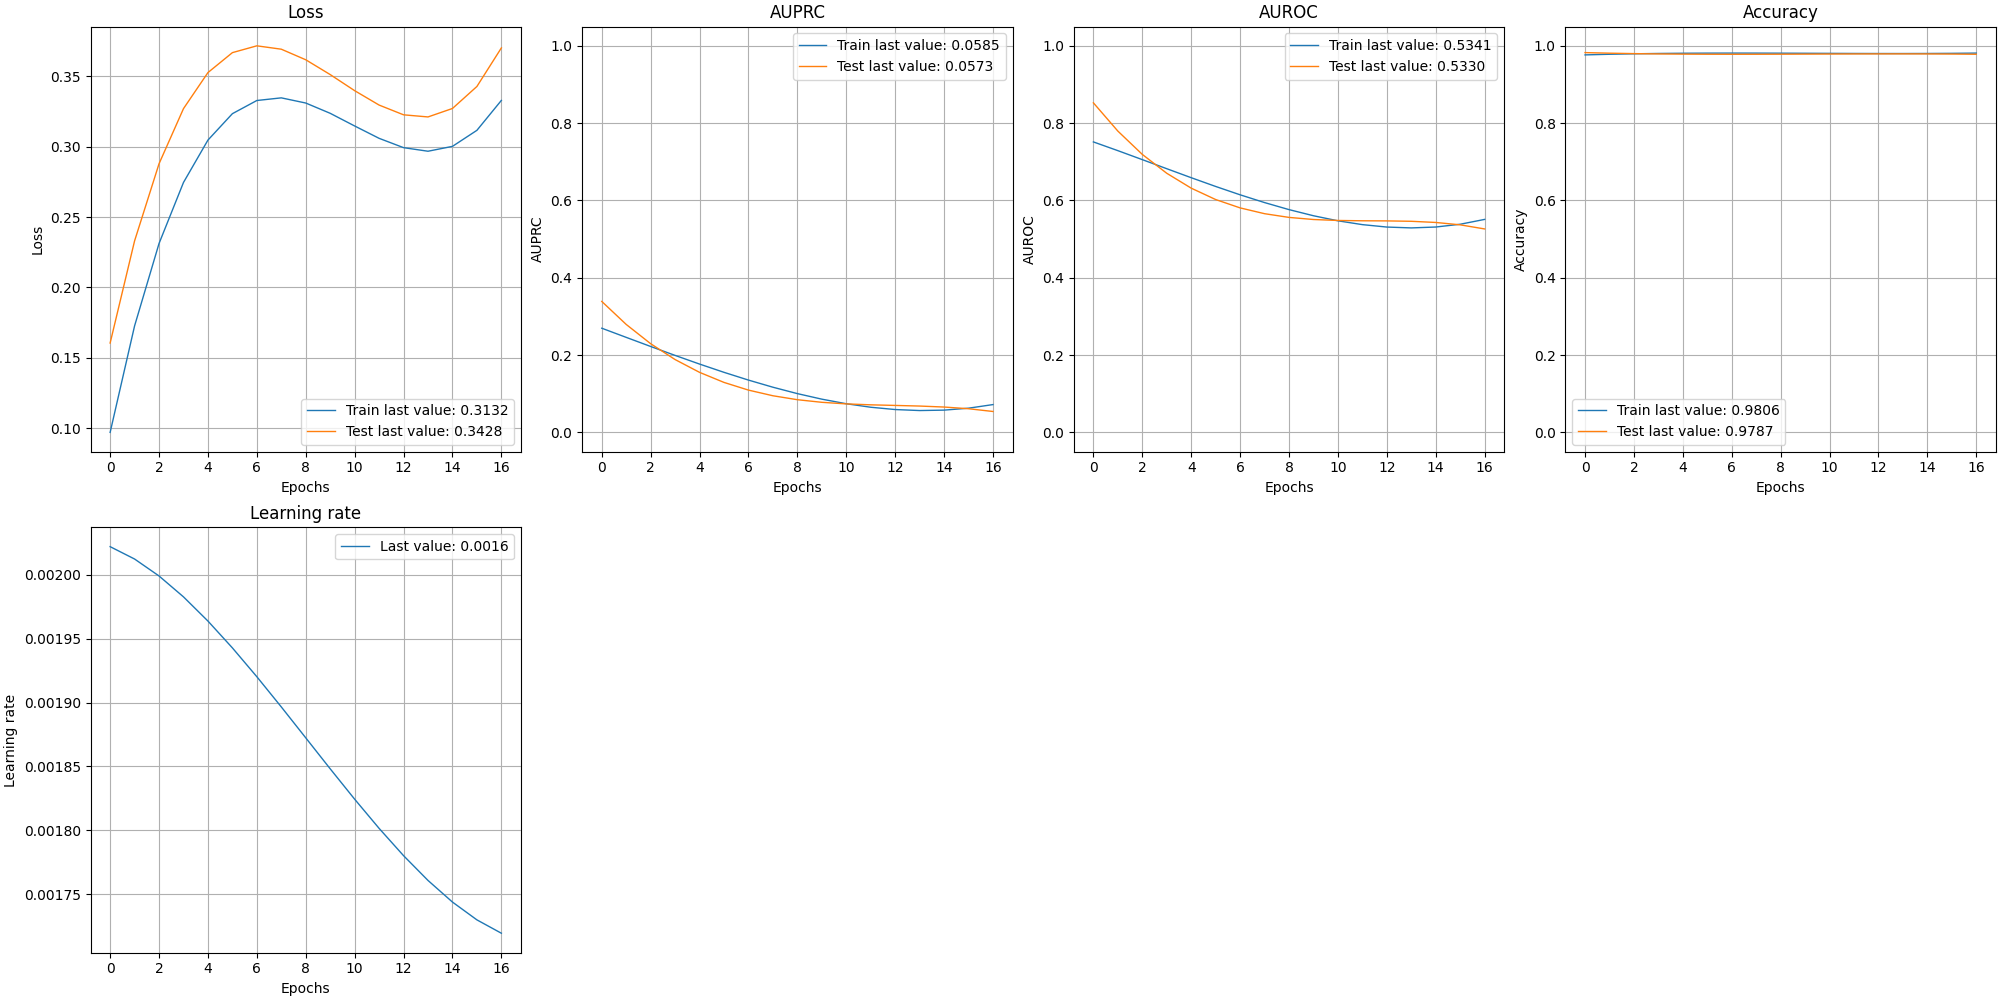
In some cases, it is necessary to see the progress of the history while interpolating results to reduce noise. A parameter is available to automatically apply a Savgol filter:
from keras.models import Sequential
from keras.layers import Dense
import matplotlib.pyplot as plt
import numpy as np
from plot_keras_history import plot_history

model = Sequential([
    Dense(1, activation="sigmoid")
])
model.compile(
    optimizer="nadam",
    loss="binary_crossentropy"
)
X = np.random.uniform(size=(100, 100))
y = np.random.randint(2, size=(100))
history = model.fit(
    X[:50], y[:50],
    validation_data=(X[50:], y[50:]),
    epochs=10,
    verbose=False
)
plot_history(history, path="interpolated.png", interpolate=True)
plt.close()
Automatic aliases
Metrics such as "lr" (Learning Rate) or "acc" (Accuracy) are automatically renamed to more descriptive labels.
Automatic normalization
The library normalizes the ranges of metrics known to be in [-1, 1] or [0, 1] to avoid visual biases.
All the available options
from keras.models import Sequential
from keras.layers import Dense
import matplotlib.pyplot as plt
import numpy as np
from plot_keras_history import plot_history

model = Sequential([
    Dense(1, activation="sigmoid")
])
model.compile(
    optimizer="nadam",
    loss="binary_crossentropy"
)
X = np.random.uniform(size=(100, 100))
y = np.random.randint(2, size=(100))
history = model.fit(
    X[:50], y[:50],
    validation_data=(X[50:], y[50:]),
    epochs=10,
    verbose=False
)
plot_history(
    history,
    style="-", # Line style.
    interpolate=True, # Whether to interpolate graph datapoints.
    side=5, # Graph size.
    graphs_per_row=4, # Number of graphs per row.
    customization_callback=None, # Callback for customizing graphs.
    path="interpolated.png", # Save path for the resulting image or images (for single_graphs).
    single_graphs=False # Whether to save as single or multiple graphs.
)
plt.close()
Chaining histories
If you stop and restart a model's training, it may break the history into two objects. Use chain_histories to merge them:
from keras.models import Sequential
from keras.layers import Dense
import numpy as np
from plot_keras_history import chain_histories

model = Sequential([
    Dense(1, activation="sigmoid")
])
model.compile(
    optimizer="nadam",
    loss="binary_crossentropy"
)
X = np.random.uniform(size=(100, 100))
y = np.random.randint(2, size=(100))
model = Sequential([
    Dense(1, activation="sigmoid")
])
model.compile(
    optimizer="nadam",
    loss="binary_crossentropy"
)
X = np.random.uniform(size=(100, 100))
y = np.random.randint(2, size=(100))
history1 = model.fit(
    X[:50], y[:50],
    validation_data=(X[50:], y[50:]),
    epochs=10,
    verbose=False
)
history2 = model.fit(
    X[:50], y[:50],
    validation_data=(X[50:], y[50:]),
    epochs=10,
    verbose=False
)
history = chain_histories(history1, history2)
Extras
Numerous additional metrics are available in extra_keras_metrics.
Cite this software
If you need a bib file to cite this work:
@software{Cappelletti_Plot_Keras_History_2022,
    author = {Cappelletti, Luca},
    doi = {10.5072/zenodo.1054923},
    month = {4},
    title = {{Plot Keras History}},
    version = {1.1.36},
    year = {2022}
}
Release history Release notifications | RSS feed


Download files
Download the file for your platform. If you're not sure which to choose, learn more about installing packages.
Source Distribution
File details
Details for the file plot_keras_history-1.1.39.tar.gz.
File metadata
- Download URL: plot_keras_history-1.1.39.tar.gz
- Upload date:
- Size: 12.4 kB
- Tags: Source
- Uploaded using Trusted Publishing? No
- Uploaded via: twine/3.8.0 pkginfo/1.8.2 readme-renderer/34.0 requests/2.27.1 requests-toolbelt/0.9.1 urllib3/1.26.9 tqdm/4.63.1 importlib-metadata/4.11.3 keyring/23.5.0 rfc3986/2.0.0 colorama/0.4.4 CPython/3.7.9
File hashes
| Algorithm | Hash digest | |
|---|---|---|
| SHA256 |
1cc7d75f273e0591f93deb5554e1272a1ef9a6291e299d8b0339f5d236de2145
|
|
| MD5 |
0f830087352a46537ba02ca4235944bd
|
|
| BLAKE2b-256 |
75ca019e3c4e36af1eadc85b2ec7d380e2095175d4bad654cf4aed4b396093c9
|


