Calendar Plot made with Plotly
Verified details
These details have been verified by PyPIProject links
GitHub Statistics
Maintainers

Project description
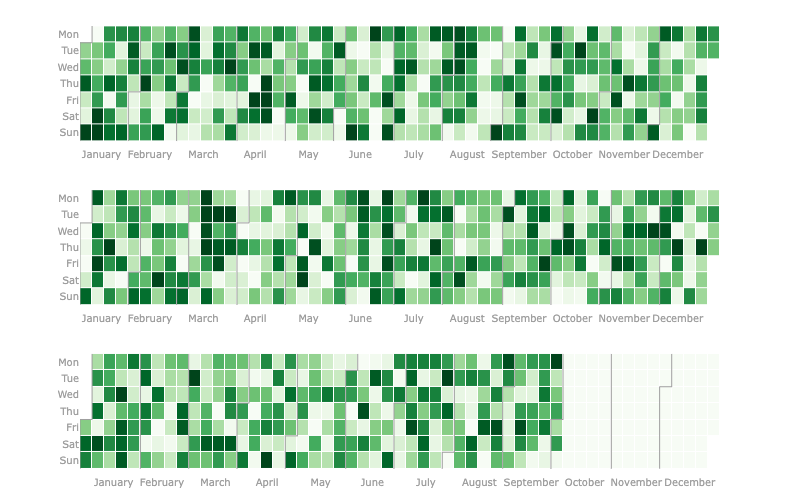
plotly-calheatmap
A continuation of plotly-calplot by Bruno Rocha Silva, which is no longer actively maintained.
This project picks up where plotly-calplot left off, providing an interactive calendar heatmap built with Plotly — similar to the contribution graphs on GitHub and GitLab profile pages.
Features
- Interactive calendar heatmaps built with Plotly
- Dataset swap — switch between multiple metrics via dropdown without regenerating the graph (
datasetsparameter) - Built-in aggregation — pass raw event data with
agg="sum"|"mean"|"count"|"max"instead of pre-aggregating - Logarithmic color scale —
log_scale=Trueapplieslog(1+x)so extreme values don't wash out the heatmap - Custom time groupings —
grouping="quarter"|"bimester"|"semester"draws separator lines and replaces axis labels - Vertical orientation — render months as rows with
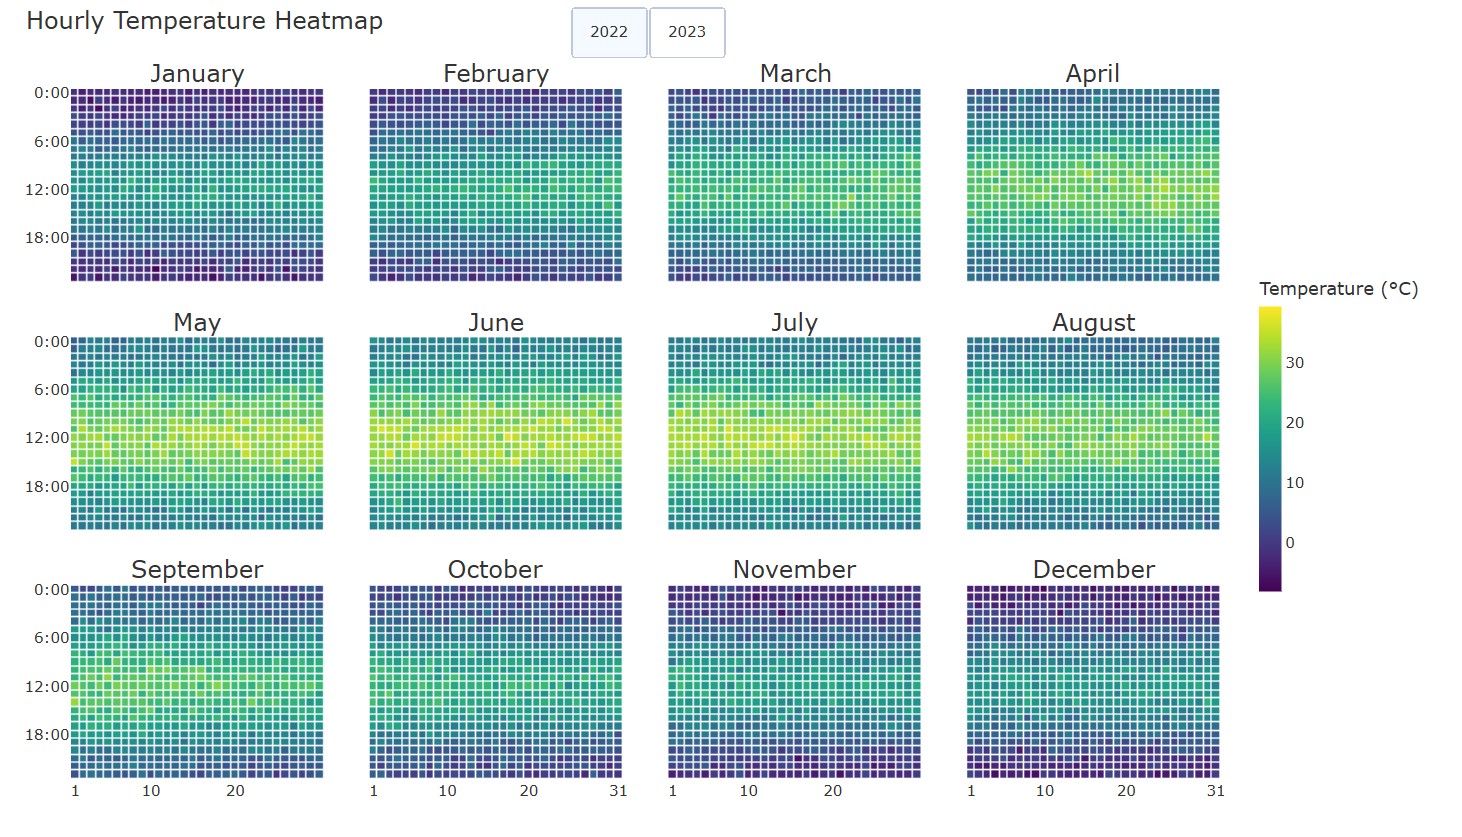
vertical=True - Hourly heatmap —
hourly_calheatmap()for hour × day grids per month - Skip empty years —
skip_empty_years=Trueexcludes years with no data - Replace NaNs with zeros —
replace_nans_with_zeros=Truedisplays empty dates as 0 - Top & bottom border lines —
top_bottom_lines=Truedraws horizontal lines enclosing each month - Month gap spacing — extra visual separation between months via
month_gap - Multi-year support with independent tick configurations per subplot
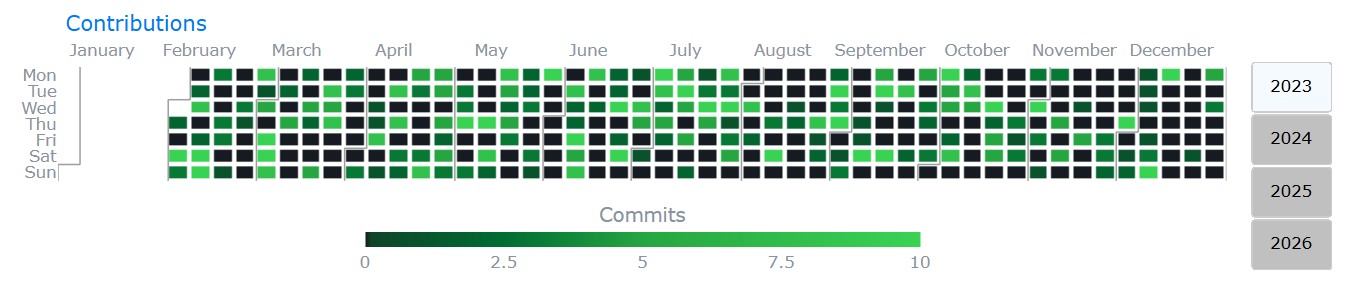
- Year navigation buttons (
navigation=True) - Localization support (
localeparameter) for month and day names (e.g.pt_BR,es,fr) - Customizable hovertemplate with friendly
{placeholder}syntax andcustomdatacolumns - Fully customizable colorscales (including custom lists)
- Month separator lines, configurable month label placement, and color scale with label/ticks
- Flexible layout options:
gap,margin,font_*,paper_bgcolor,plot_bgcolor, etc.
Installation
pip install plotly-calheatmap
Quick Start
from plotly_calheatmap import calheatmap

fig = calheatmap(df, x="date", y="value")
fig.show()
Built-in Aggregation
Pass raw (non-aggregated) event data directly — duplicate dates are grouped and aggregated automatically:
from plotly_calheatmap import calheatmap

# df has multiple rows per date (e.g. individual transactions)
fig = calheatmap(df, x="date", y="amount", agg="sum")
fig.show()
Supported functions: "sum", "mean", "count", "max".
Vertical Orientation
fig = calheatmap(df, x="date", y="value", vertical=True, month_gap=1)
Dataset Swap
Switch between multiple metrics on the same graph via a dropdown menu. Each dataset can have its own colorscale, value range, and legend title. Works with both calheatmap() and hourly_calheatmap(), alongside year navigation.
fig = calheatmap(
    data=df,
    x="date",
    y="sales",
    datasets={
        "Sales": {
            "y": "sales",
            "colorscale": "greens",
            "showscale": "Sales ($)",
            "cmap_min": 0,
        },
        "Activity": {
            "y": "activity",
            "colorscale": "blues",
            "showscale": "Activity (hours)",
        },
    },
    navigation=True,
)
Logarithmic Color Scale
When a few extreme values wash out the rest of the heatmap, use log_scale=True to apply log(1+x) to the color mapping. Hover text still shows original values.
fig = calheatmap(df, x="date", y="value", log_scale=True)
Custom Time Groupings
Draw thicker separator lines at quarter, bimester, or semester boundaries and replace axis labels with group names:
fig = calheatmap(df, x="date", y="value", grouping="quarter", month_lines=True)

Hourly Heatmap
from plotly_calheatmap import hourly_calheatmap

fig = hourly_calheatmap(df, x="datetime_col", y="value")
fig.show()
Skip Empty Years & Replace NaNs
fig = calheatmap(df, x="date", y="value", skip_empty_years=True, replace_nans_with_zeros=True)
Border Lines
Fully enclose each month by combining month_lines with top_bottom_lines:
fig = calheatmap(df, x="date", y="value", month_lines=True, top_bottom_lines=True)
Credits
This project is based on the original work by Bruno Rocha Silva — plotly-calplot.
Project details
Verified details
These details have been verified by PyPIProject links
GitHub Statistics
Maintainers


Download files
Download the file for your platform. If you're not sure which to choose, learn more about installing packages.
Source Distribution
Built Distribution
Filter files by name, interpreter, ABI, and platform.
If you're not sure about the file name format, learn more about wheel file names.
Copy a direct link to the current filters
File details
Details for the file plotly_calheatmap-0.3.1.tar.gz.
File metadata
- Download URL: plotly_calheatmap-0.3.1.tar.gz
- Upload date:
- Size: 23.5 kB
- Tags: Source
- Uploaded using Trusted Publishing? Yes
- Uploaded via: twine/6.1.0 CPython/3.13.7
File hashes
| Algorithm | Hash digest | |
|---|---|---|
| SHA256 |
c981e86b5e9afb02e6ec391cf7caa35e063a26ae0da449997c2d67da58b06239
|
|
| MD5 |
9edf40c136dafd6d4aa5c58bc1179ecd
|
|
| BLAKE2b-256 |
ea1672a04d13df43713f0aaecf3531f1317de3cf2355d84eebb742651d4dd742
|
Provenance
The following attestation bundles were made for plotly_calheatmap-0.3.1.tar.gz:
Publisher:
publish.yaml on thomazyujibaba/plotly-calheatmap
-
Statement:
-
Statement type:
https://in-toto.io/Statement/v1 -
Predicate type:
https://docs.pypi.org/attestations/publish/v1 -
Subject name:
plotly_calheatmap-0.3.1.tar.gz -
Subject digest:
c981e86b5e9afb02e6ec391cf7caa35e063a26ae0da449997c2d67da58b06239 - Sigstore transparency entry: 870352301
- Sigstore integration time:
-
Permalink:
thomazyujibaba/plotly-calheatmap@ab550554f0143ac3cb79f735a27e0f01a40986dc -
Branch / Tag:
refs/tags/v0.3.1 - Owner: https://github.com/thomazyujibaba
-
Access:
public
-
Token Issuer:
https://token.actions.githubusercontent.com -
Runner Environment:
github-hosted -
Publication workflow:
publish.yaml@ab550554f0143ac3cb79f735a27e0f01a40986dc -
Trigger Event:
release
-
Statement type:
File details
Details for the file plotly_calheatmap-0.3.1-py3-none-any.whl.
File metadata
- Download URL: plotly_calheatmap-0.3.1-py3-none-any.whl
- Upload date:
- Size: 26.5 kB
- Tags: Python 3
- Uploaded using Trusted Publishing? Yes
- Uploaded via: twine/6.1.0 CPython/3.13.7
File hashes
| Algorithm | Hash digest | |
|---|---|---|
| SHA256 |
4e03d0546bc7b518e9d0923891c0ce0d7af81275d7bb5f7395fcf80b5e0549fa
|
|
| MD5 |
8aa6bdcf6325b9356d6a7b2b4755eadd
|
|
| BLAKE2b-256 |
af97b84f43940219f790a8f25f217b756e1231df161ea94241ccedbece278ea2
|
Provenance
The following attestation bundles were made for plotly_calheatmap-0.3.1-py3-none-any.whl:
Publisher:
publish.yaml on thomazyujibaba/plotly-calheatmap
-
Statement:
-
Statement type:
https://in-toto.io/Statement/v1 -
Predicate type:
https://docs.pypi.org/attestations/publish/v1 -
Subject name:
plotly_calheatmap-0.3.1-py3-none-any.whl -
Subject digest:
4e03d0546bc7b518e9d0923891c0ce0d7af81275d7bb5f7395fcf80b5e0549fa - Sigstore transparency entry: 870352319
- Sigstore integration time:
-
Permalink:
thomazyujibaba/plotly-calheatmap@ab550554f0143ac3cb79f735a27e0f01a40986dc -
Branch / Tag:
refs/tags/v0.3.1 - Owner: https://github.com/thomazyujibaba
-
Access:
public
-
Token Issuer:
https://token.actions.githubusercontent.com -
Runner Environment:
github-hosted -
Publication workflow:
publish.yaml@ab550554f0143ac3cb79f735a27e0f01a40986dc -
Trigger Event:
release
-
Statement type:


