










plotly_resampler: visualize large sequential data by adding resampling functionality to Plotly figures
FlexViz is our successor project.
👉 Try the live demo on 2 x 100M rows: flexviz.tech/demo |
plotly-resampler improves the scalability of Plotly for visualizing large time series datasets. Specifically, our library dynamically aggregates time-series data respective to the current graph view, ensuring efficient and responsive updates during user interactions like panning or zooming via callbacks.
This core aggregation functionality is achieved by utilizing by time-series data point selection algorithms, for which plotly-resampler leverages the highly optimized implementations available in tsdownsample. Our default data aggregation method is MinMaxLTTB (and selects 1000 data points for plotting). For a deeper understanding of this method, you can consult to the algorithm's dedicated MinMaxLTTB repository and the associated research paper.
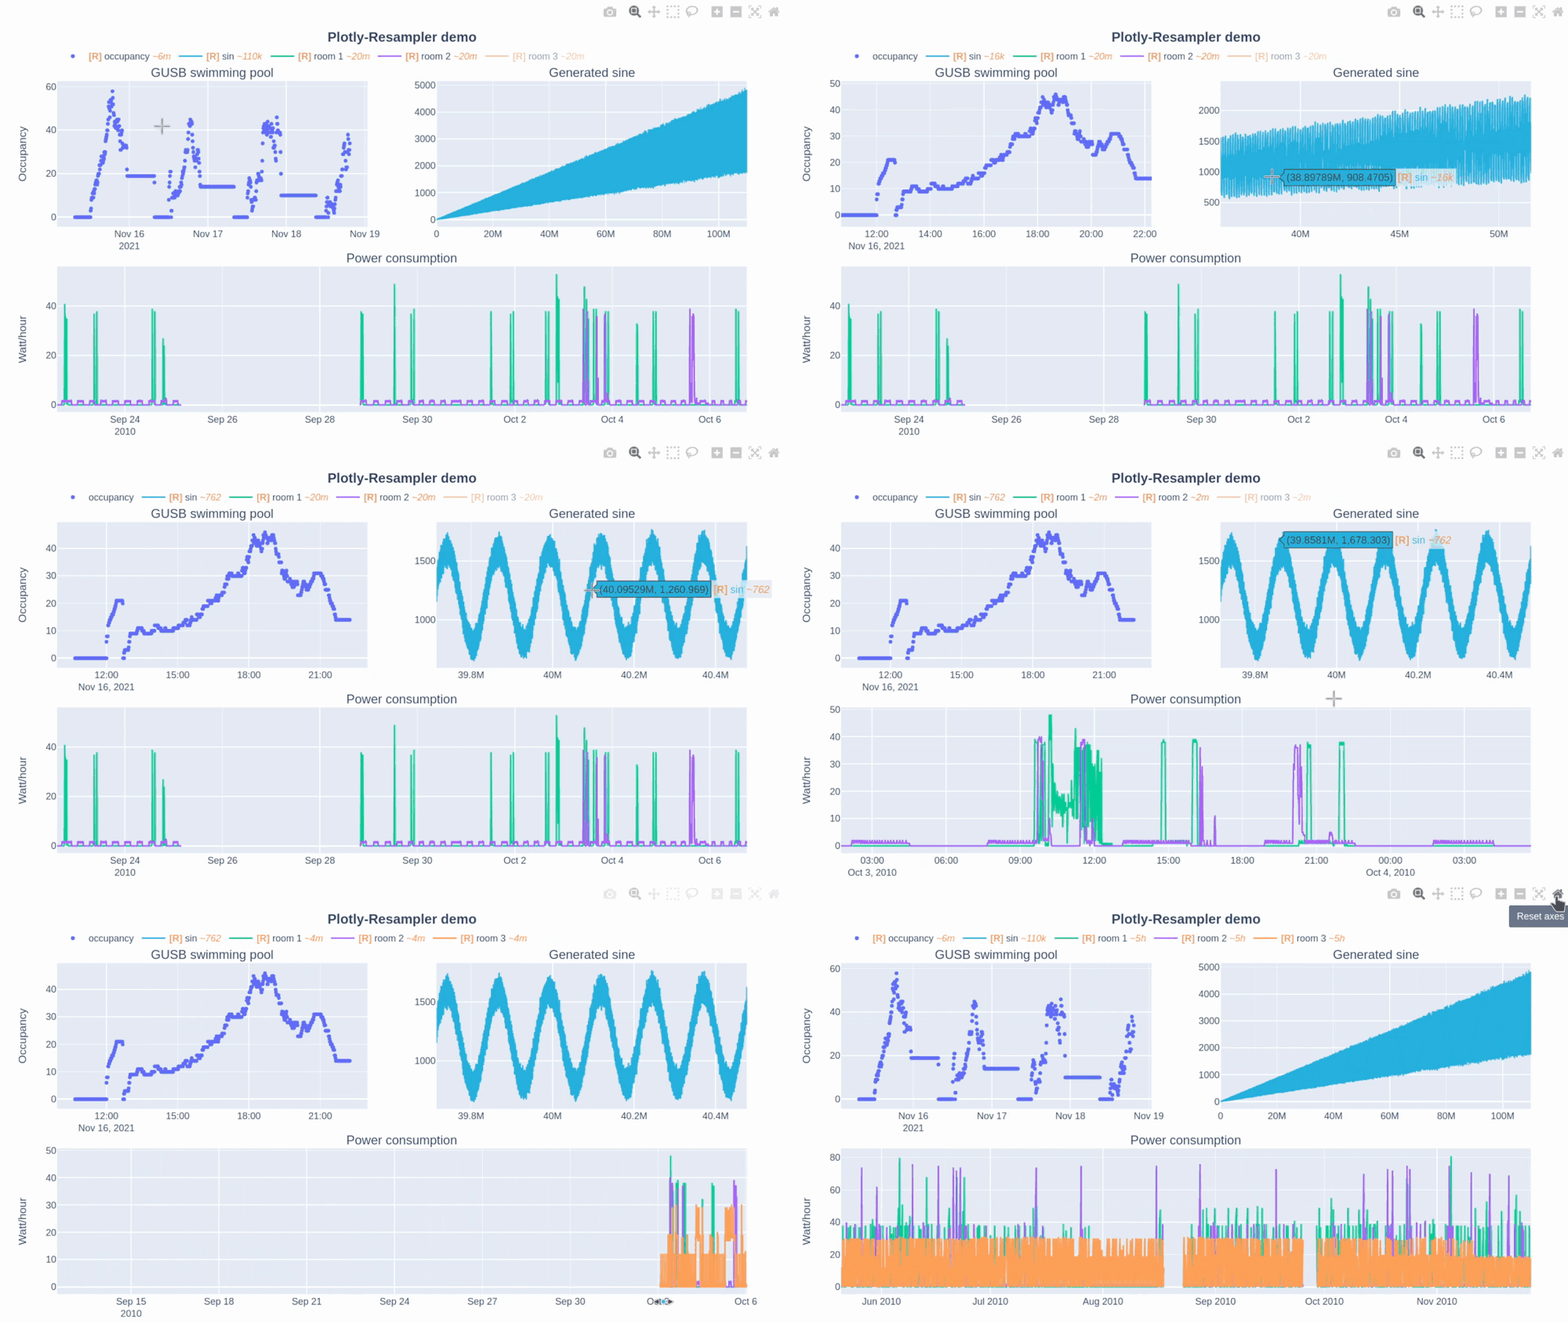
In this Plotly-Resampler demo over 110,000,000 data points are visualized!
🛠️ Installation
| pip | pip install plotly-resampler |
|---|
👀 What is the difference between plotly-resampler figures and plain plotly figures?
plotly-resampler can be thought of as wrapper around plain plotly figures which adds visualization scalability to line-charts by dynamically aggregating the data w.r.t. the front-end view. plotly-resampler thus adds dynamic aggregation functionality to plain plotly figures.
❗ Important to know:
showalways generates a static HTML view of the figure, prohibiting dynamic aggregation.- To have dynamic aggregation:
- Use
show_dashwithFigureResamplerto initiate a Dash app to realize the dynamic aggregation with callbacks.
(or output the object in a cell viaIPython.display), which will also spawn a dash-web app - with
FigureWidgetResampler, you need to useIPython.displayon the object, which uses widget-events to realize dynamic aggregation (via the running IPython kernel).
- Use
Other changes of plotly-resampler figures w.r.t. vanilla plotly:
- double-clicking within a line-chart area does not Reset Axes, as it results in an “Autoscale” event. We decided to implement an Autoscale event as updating your y-range such that it shows all the data that is in your x-range.
- Note: vanilla Plotly figures their Autoscale result in Reset Axes behavior, in our opinion this did not make a lot of sense. It is therefore that we have overriden this behavior in plotly-resampler.
📋 Features
- Convenient to use:
- just add either
register_plotly_resamplerfunction to your notebook with the best suitedmodeargument.FigureResamplerdecorator around a plotly Figure and call.show_dash()FigureWidgetResamplerdecorator around a plotly Figure and output the instance in a cell
- allows all other plotly figure construction flexibility to be used!
- just add either
- Environment-independent
- can be used in Jupyter, vscode-notebooks, Pycharm-notebooks, Google Colab, DataSpell, and even as application (on a server)
- Interface for various aggregation algorithms:
- ability to develop or select your preferred sequence aggregation method
🚀 Usage
Add dynamic aggregation to your plotly Figure (unfold your fitting use case)
-
🤖 Automatically (minimal code overhead):
Use the
register_plotly_resamplerfunction
- Import and call the
register_plotly_resamplermethod - Just use your regular graph construction code
- code example:
import plotly.graph_objects as go; import numpy as np
from plotly_resampler import register_plotly_resampler

# Call the register function once and all Figures/FigureWidgets will be wrapped
# according to the register_plotly_resampler its `mode` argument
register_plotly_resampler(mode='auto')

x = np.arange(1_000_000)
noisy_sin = (3 + np.sin(x / 200) + np.random.randn(len(x)) / 10) * x / 1_000


# auto mode: when working in an IPython environment, this will automatically be a
# FigureWidgetResampler else, this will be an FigureResampler
f = go.Figure()
f.add_trace({"y": noisy_sin + 2, "name": "yp2"})
f
Note: This wraps all plotly graph object figures with a
FigureResampler|FigureWidgetResampler. This can thus also be used for theplotly.expressinterface. 🎉 - Import and call the
-
👷 Manually (higher data aggregation configurability, more speedup possibilities):
- Within a jupyter environment without creating a web application
- wrap the plotly Figure with
FigureWidgetResampler - output the
FigureWidgetResamplerinstance in a cell
import plotly.graph_objects as go; import numpy as np
from plotly_resampler import FigureResampler, FigureWidgetResampler

x = np.arange(1_000_000)
noisy_sin = (3 + np.sin(x / 200) + np.random.randn(len(x)) / 10) * x / 1_000

# OPTION 1 - FigureWidgetResampler: dynamic aggregation via `FigureWidget.layout.on_change`
fig = FigureWidgetResampler(go.Figure())
fig.add_trace(go.Scattergl(name='noisy sine', showlegend=True), hf_x=x, hf_y=noisy_sin)

fig
- wrap the plotly Figure with
- Using a web-application with dash callbacks
- wrap the plotly Figure with
FigureResampler - call
.show_dash()on theFigure
import plotly.graph_objects as go; import numpy as np
from plotly_resampler import FigureResampler, FigureWidgetResampler

x = np.arange(1_000_000)
noisy_sin = (3 + np.sin(x / 200) + np.random.randn(len(x)) / 10) * x / 1_000

# OPTION 2 - FigureResampler: dynamic aggregation via a Dash web-app
fig = FigureResampler(go.Figure())
fig.add_trace(go.Scattergl(name='noisy sine', showlegend=True), hf_x=x, hf_y=noisy_sin)

fig.show_dash(mode='inline')
- wrap the plotly Figure with
Tip 💡: For significant faster initial loading of the Figure, we advise to wrap the constructor of the plotly Figure and add the trace data as
hf_xandhf_y - Within a jupyter environment without creating a web application
Note: Any plotly Figure can be wrapped with
FigureResamplerandFigureWidgetResampler! 🎉 But only thego.Scatter/go.Scattergltraces are resampled.
🔭 The successor: FlexViz
plotly-resampler does one thing well: it makes a line trace fast inside an existing Plotly figure. The features asked for most often over the years are the ones this design cannot deliver: linked charts, cross-filtering, histograms and heatmaps that re-aggregate on zoom, and reading straight from Parquet instead of from an in-memory array.
FlexViz is our answer, built by the same authors. Every zoom, pan, and brush is answered by a lazy Polars aggregation with Rust kernels behind it, so a whole dashboard stays interactive at 100M+ rows.
| plotly-resampler | FlexViz | |
|---|---|---|
| Drop into an existing Plotly / Dash figure | ✅ | ❌ (own Figure / Dashboard API) |
| Large line traces | ✅ MinMaxLTTB | ✅ Rust min-max kernels |
| Linked charts and cross-filtering | ❌ | ✅ |
| Trace types that re-aggregate on interaction | Scatter / Scattergl only |
10: line, histogram, bar, pie, box, treemap, 2D histogram, correlation heatmap, maps |
| Dashboard layout | you build it (Dash) | drag-and-resize grid, built in |
| Where the data lives | in the Python process | lazy Polars scan (Parquet, …) |
| Status | stable, maintained | pre-1.0, moving fast |
If plotly-resampler covers your needs, keep using it. If you have hit its ceiling, FlexViz is where our new development goes: live demo · GitHub · docs
💭 Important considerations & tips
- When running the code on a server, you should forward the port of the
FigureResampler.show_dash()method to your local machine.
Note that you can add dynamic aggregation to plotly figures with theFigureWidgetResamplerwrapper without needing to forward a port! - The
FigureWidgetResampleruses the IPython main thread for its data aggregation functionality, so when this main thread is occupied, no resampling logic can be executed. For example; if you perform long computations within your notebook, the kernel will be occupied during these computations, and will only execute the resampling operations that take place during these computations after finishing that computation. - In general, when using downsampling one should be aware of (possible) aliasing effects.
The [R] in the legend indicates when the corresponding trace is being resampled (and thus possibly distorted) or not. Additionally, the
~<range>suffix represent the mean aggregation bin size in terms of the sequence index. - The plotly autoscale event (triggered by the autoscale button or a double-click within the graph), does not reset the axes but autoscales the current graph-view of plotly-resampler figures. This design choice was made as it seemed more intuitive for the developers to support this behavior with double-click than the default axes-reset behavior. The graph axes can ofcourse be resetted by using the
reset_axisbutton. If you want to give feedback and discuss this further with the developers, see issue #49.
📜 Citation and papers
The paper about the plotly-resampler toolkit itself (preprint): https://arxiv.org/abs/2206.08703
@inproceedings{van2022plotly,
  title={Plotly-resampler: Effective visual analytics for large time series},
  author={Van Der Donckt, Jonas and Van Der Donckt, Jeroen and Deprost, Emiel and Van Hoecke, Sofie},
  booktitle={2022 IEEE Visualization and Visual Analytics (VIS)},
  pages={21--25},
  year={2022},
  organization={IEEE}
}
Related papers:
- Visual representativeness of time series data point selection algorithms (preprint): https://arxiv.org/abs/2304.00900
code: https://github.com/predict-idlab/ts-datapoint-selection-vis - MinMaxLTTB - an efficient data point selection algorithm (preprint): https://arxiv.org/abs/2305.00332
code: https://github.com/predict-idlab/MinMaxLTTB
👤 Jonas Van Der Donckt, Jeroen Van Der Donckt, Emiel Deprost


Release files for plotly-resampler 0.11.1
For a detailed explanation of source distributions (sdists) and built distributions (wheels), please see the package formats documentation.
Source distribution (sdist)
| File | Size | Uploaded | |
|---|---|---|---|
| plotly_resampler-0.11.1.tar.gz | 59.4 kB | Details |
Built distribution (wheel)
| File | Interpreter | ABI | Platform | Reset |
|---|---|---|---|---|
| plotly_resampler-0.11.1-py3-none-any.whl | Python 3 | none | any | Details |
Total release size: 121.7 kB
Release files / plotly_resampler-0.11.1.tar.gz
| Download URL | plotly_resampler-0.11.1.tar.gz |
|---|---|
| Size | 59.4 kB |
| Tags | Source |
|
SHA-256 checksum How to use checksums |
54ea25120ff05eb6f66c421c690ea1fe7b43708c9a868c554c8e9cb5cc33b38d
|
|
BLAKE2b-256 checksum How to use checksums |
d06902846c1ec535965f64ac7fa16c70f019a8925dbe9f2ff2bd97a3ef72eaae
|
| Upload date | |
|
Uploaded using Trusted Publishing? What is trusted publishing? |
No |
| Uploaded via |
uv/0.11.8 {"installer":{"name":"uv","version":"0.11.8","subcommand":["publish"]},"python":null,"implementation":{"name":null,"version":null},"distro":{"name":"macOS","version":null,"id":null,"libc":null},"system":{"name":null,"release":null},"cpu":null,"openssl_version":null,"setuptools_version":null,"rustc_version":null,"ci":null}
|
Release files / plotly_resampler-0.11.1-py3-none-any.whl
| Download URL | plotly_resampler-0.11.1-py3-none-any.whl |
|---|---|
| Size | 62.3 kB |
| Tags | Python 3 |
|
SHA-256 checksum How to use checksums |
2c9f3b1a5fa24e7e4a141fbc2207ed54edab4c106469c7efac582d78c2c512e6
|
|
BLAKE2b-256 checksum How to use checksums |
5b8d0fc2f17d13f388452df13b12cd07bd4895aa6887becea7cd257bdcee833a
|
| Upload date | |
|
Uploaded using Trusted Publishing? What is trusted publishing? |
No |
| Uploaded via |
uv/0.11.8 {"installer":{"name":"uv","version":"0.11.8","subcommand":["publish"]},"python":null,"implementation":{"name":null,"version":null},"distro":{"name":"macOS","version":null,"id":null,"libc":null},"system":{"name":null,"release":null},"cpu":null,"openssl_version":null,"setuptools_version":null,"rustc_version":null,"ci":null}
|














