
polars-telemetry
OpenTelemetry instrumentation for Polars query execution.
One span per query carrying the plan, and per-node counters as metrics, to any OTLP collector — or a profile file you open in your browser, with no collector at all.
Install
pip install polars-telemetry          # API only; bring your own OTel SDK
pip install 'polars-telemetry[otlp]'  # with SDK and OTLP exporter
pip install 'polars-telemetry[datadog]'  # for the DogStatsD exporter
Python 3.10+.
Use
import polars_telemetry

polars_telemetry.install()
install() enables polars' query monitoring, which sets the engine affinity to
"streaming" and therefore changes how your queries execute — so it never
happens on import. uninstall() turns monitoring off and puts the previous
affinity back.
What you get
A polars.collect span per query, on whatever trace context was active:
- the plan — scan sources, pushed-down predicates, join types and keys, group-by keys
polars.cpu_ms,polars.parallelism, result rows- the hottest node and its share of total CPU
- diagnostics — parallel efficiency, filter selectivity, join amplification, projection efficiency, morsel skew, predicate pushdown, row-group skipping
- the file, line and function that ran the query, as OpenTelemetry's
code.*attributes
Per-node counters — rows, morsels, polls, work-stealing, poll latency, state updates, IO time and bytes — as 15 metric instruments dimensioned by node kind.
Every name is listed in the attribute reference.
Where it goes
| Exporter | Sends | To |
|---|---|---|
OTelExporter, the default |
a span and per-node metrics | your OpenTelemetry SDK |
DogStatsdExporter |
the same metrics, with tags | the Datadog Agent, or Telegraf into InfluxDB |
FileExporter |
a profile per query: both plans, every counter | a .jsonl file for the viewer |
ConsoleExporter |
a short summary | standard error |
from datadog import DogStatsd
from polars_telemetry.export.dogstatsd import DogStatsdExporter

statsd = DogStatsd(disable_buffering=False, disable_background_sender=False)
polars_telemetry.install(exporter=DogStatsdExporter(statsd))
exporter takes a list, so several can run at once. Each has a
page in the docs,
with its options and what it costs.
Profiles without a collector
from polars_telemetry.export.file import FileExporter

polars_telemetry.install(exporter=FileExporter("profiles/session.jsonl"))
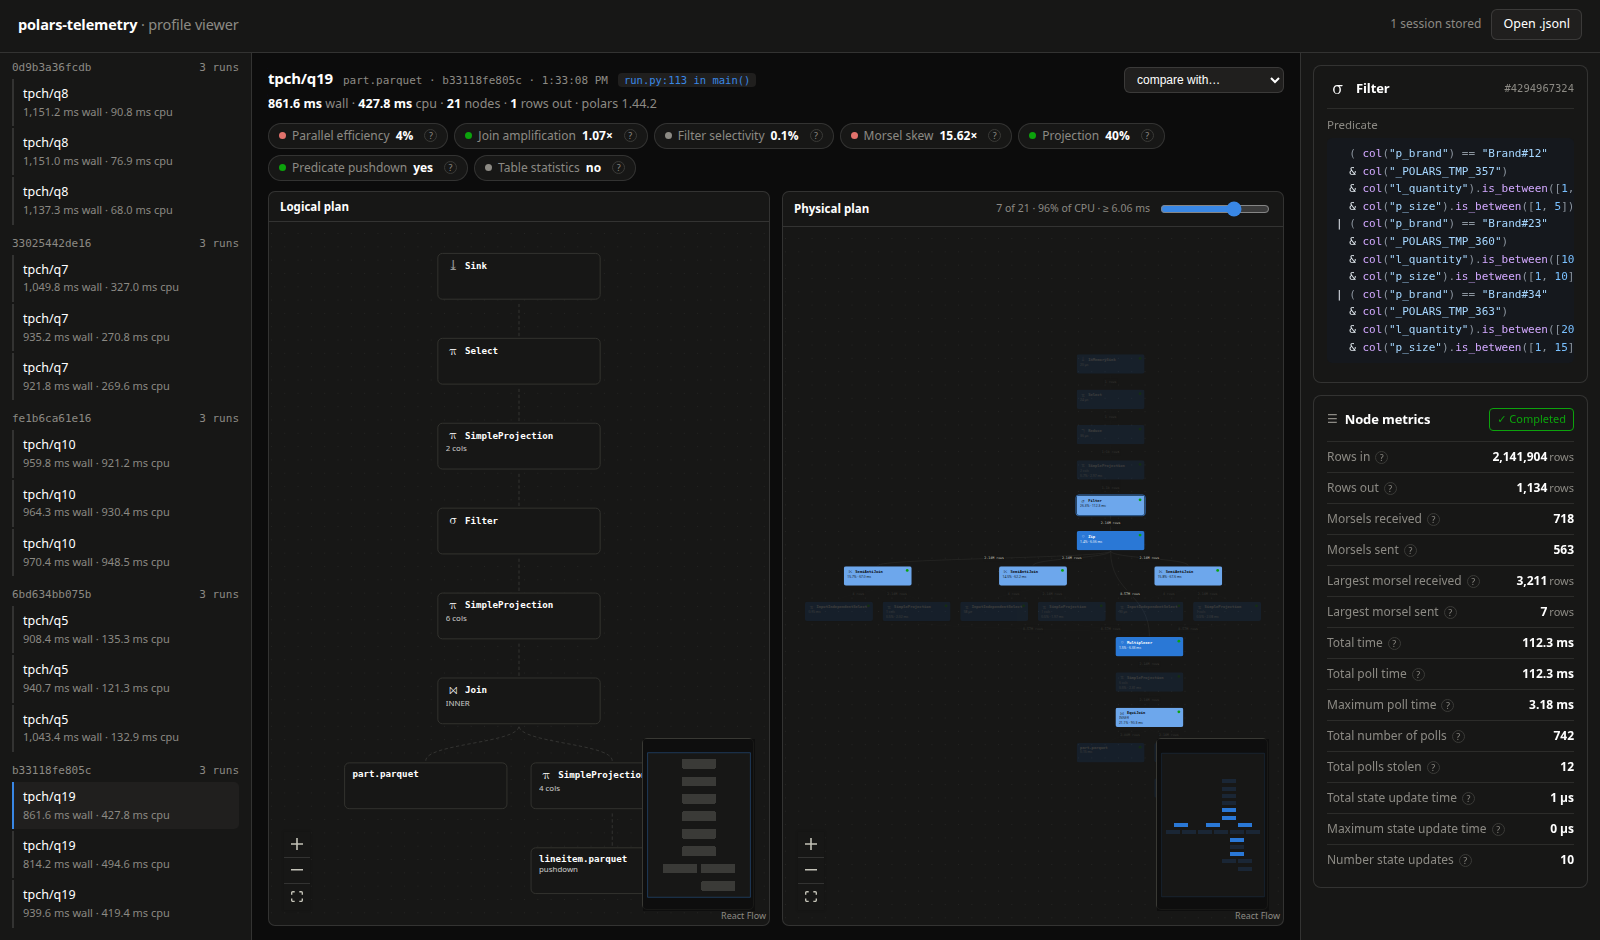
One self-contained JSON document per query: both plans with every node property, all 19 per-node counters, the diagnostics, and a fingerprint of the plan shape.
Drop the file on the
profile viewer to read
both plans, per-node counters, and a diff between two runs of the same shape.
It runs entirely in your browser; nothing is uploaded. To try it without a
workload of your own, open the viewer and load a TPC-H example with one click:
the 22 queries at scale factor 1 or 10, three runs each. The same sessions are
in examples/.
Label what runs
with polars_telemetry.label("revenue_by_region"):
    report.collect()
The label is on the span and in the profile; nested labels join with /.
Profile a block of code
from polars_telemetry import profile

with profile() as session:
    report = build_report()

session.slowest.call_site  # where the slow one was run
session.write("report.jsonl")  # open in the viewer
Installs instrumentation only if nothing was installed. With an application already instrumented it collects alongside the existing exporter.
Configure
from polars_telemetry import Config

polars_telemetry.install(Config(node_metrics=False))
| Option | Default | Effect |
|---|---|---|
node_metrics |
True |
Read per-node counters once at query end |
include_plan |
False |
Attach the full plan to the span as JSON |
call_site |
True |
Record the file, line and function that ran the query |
redaction |
None |
What to mask before exporters see a query; Redaction() masks literal values |
Your data
Spans carry plan detail: scan paths, column names, join keys and literal
predicate values — col("email") == "..." arrives verbatim, because knowing
which predicate was slow is usually the point.
Config(redaction=Redaction())masks literal values: text, numbers, dates and times.Redaction(paths=True, call_site=True, labels=True)masks more.redacted(exporter, ...)gives one exporter its own setting, so a shared backend can get a masked copy while a local file keeps full detail.- Literals are never used as metric attributes, at any setting.
- Attributes that can carry user data are listed in
polars_telemetry.export.semconv.CARRIES_USER_DATA.
Polars Cloud
If polars-cloud is installed, its observer is wrapped and forwarded to rather
than replaced. Both work at once.
Links
- Documentation
- Contributing — development, testing, releasing
- Changelog
License
1 maintainer

Metadata
1 maintainer
Release files for polars-telemetry 0.4.0
For a detailed explanation of source distributions (sdists) and built distributions (wheels), please see the package formats documentation.
Source distribution (sdist)
| File | Size | Uploaded | |
|---|---|---|---|
| polars_telemetry-0.4.0.tar.gz | 534.3 kB | Details |
Built distribution (wheel)
| File | Interpreter | ABI | Platform | Reset |
|---|---|---|---|---|
| polars_telemetry-0.4.0-py3-none-any.whl | Python 3 | none | any | Details |
Total release size: 595.3 kB
Release files / polars_telemetry-0.4.0.tar.gz
| Download URL | polars_telemetry-0.4.0.tar.gz |
|---|---|
| Size | 534.3 kB |
| Tags | Source |
|
SHA-256 checksum How to use checksums |
c2562613ee3e12b3eb2fb1cdc60c1342da789af90898ece8036eaaff0f992949
|
|
BLAKE2b-256 checksum How to use checksums |
1fef7e0d40e07e9a20a976cc90671ec54315046bc4e080c23324ce091b37724b
|
| Upload date | |
|
Uploaded using Trusted Publishing? What is trusted publishing? |
Yes |
| Uploaded via |
twine/7.0.0 CPython/3.13.14
|
Provenance
Provenance describes where a file came from. On PyPI, provenance is shared via attestations, which provide a verifiable record of the build or publishing details. View details, limitations and caveats.


PyPI Publish Attestation
PyPI verified that this artifact, at this checksum, originated from the publisher listed below.
Signed by GitHub Actions, verified by PyPI on Oct 3, 2026.
Transparency logRelease files / polars_telemetry-0.4.0-py3-none-any.whl
| Download URL | polars_telemetry-0.4.0-py3-none-any.whl |
|---|---|
| Size | 60.9 kB |
| Tags | Python 3 |
|
SHA-256 checksum How to use checksums |
36d98f7751369512157e3ace8ffe462078bd256d889cf05c5ce2ba6659814126
|
|
BLAKE2b-256 checksum How to use checksums |
b9d22d5e47f2838cf9892853fc1e058e2d679f12d1d35010ef73f3c6e5e9fde0
|
| Upload date | |
|
Uploaded using Trusted Publishing? What is trusted publishing? |
Yes |
| Uploaded via |
twine/7.0.0 CPython/3.13.14
|
Provenance
Provenance describes where a file came from. On PyPI, provenance is shared via attestations, which provide a verifiable record of the build or publishing details. View details, limitations and caveats.
PyPI Publish Attestation
PyPI verified that this artifact, at this checksum, originated from the publisher listed below.
Signed by GitHub Actions, verified by PyPI on Oct 3, 2026.
Transparency log













