
pptx-shapes



Python library for adding basic geometric shapes directly to PowerPoint (.pptx) slides by editing the XML structure.
Features
- Add basic shapes (ellipse, line, polygon, etc.) to existing slides
- Control position, size, fill, stroke, and other styles
- Simple, expressive API with smart defaults
- Supports minimalistic charts such as donut, bar, scatter charts
- Work directly with slides XML structure
- Save result as
.pptx
Installation
pip install pptx-shapes
Quick Start
from pptx_shapes import Presentation
from pptx_shapes.shapes import Ellipse, Rectangle, TextBox
from pptx_shapes.style import FillStyle, FontFormat, FontStyle, StrokeStyle

with Presentation(presentation_path="empty.pptx") as presentation:
    presentation.add(shape=TextBox(
        x=23, y=4, width=12, height=2, angle=45,
        text="Hello from pptx-shapes!",
        style=FontStyle(size=32),
        formatting=FontFormat(bold=True)
    ))

    presentation.add(shape=Ellipse(
        x=20, y=2, width=4, height=4,
        fill=FillStyle(color="#7699d4")
    ))

    presentation.add(shape=Rectangle(
        x=18, y=8, width=4, height=8.5, radius=0.25, angle=30,
        fill=FillStyle(color="#dd7373"),
        stroke=StrokeStyle(color="magenta", thickness=3)
    ))

    presentation.save("result.pptx")
How it works
This library modifies .pptx files by directly editing the underlying XML structure.
A .pptx presentation is essentially a ZIP archive containing XML files that describe slides, layouts, and content. This library works by:
- Unzipping the
.pptxfile. - Locating and parsing the target slide file (e.g.,
ppt/slides/slide1.xml). - Inserting new shape elements into the slide's XML tree, using tags like
<p:sp>,<p:cxnSp>, and<a:prstGeom>. - Saving the modified XML.
- Repacking all files into a
.pptxarchive.
This low-level approach is ideal for automated slide generation, data visualizations, and geometric illustrations – especially when you need to create many shapes or apply programmatic styles.
Supported Shapes
Currently, pptx-shapes supports the following geometric shapes:
| Shape | Class | Description |
|---|---|---|
| Line | Line |
Straight line between two points |
| Arrow | Arrow |
Straight arrow between two points |
| Arc | Arc |
Curved segment defined by the bounding box and start/end angles |
| Arch | Arch |
Ring-shaped arc defined by the bounding box, thickness and start/end angles |
| Ellipse | Ellipse |
Ellipse defined by top-left corner, size, and rotation angle |
| Rectangle | Rectangle |
Rectangle defined by top-left corner, size, corner radius and rotation angle |
| Pie | Pie |
Filled sector of a circle, defined by the bounding box and start/end angles |
| Polygon | Polygon |
Arbitrary polygon defined by a list of points and rotation angle |
| Polyline | Polyline |
Arbitrary polyline defined by a list of points and rotation angle |
| TextBox | TextBox |
Text container with position, size, rotation, and font style |
| Group | Group |
A group of multiple shapes |
Supported charts
The pptx_shapes.charts module provides classes for adding simple charts to PowerPoint presentations using basic shapes.
| Chart | Class | Description |
|---|---|---|
| Donut | DonutChart |
A donut chart used to visualize proportions of categorical data. |
| Bar | BarChart |
A bar chart used to display values across categories or time series. |
| Scatter | ScatterPlot |
A scatter plot used to visualize a set of points on a coordinate plane. |
Documentation
Full documentation and examples are available at pptx-shapes.readthedocs.io
Examples
The following examples illustrate how to generate PowerPoint slides with various geometric shapes using pptx-shapes.
All examples include screenshots, downloadable .pptx files, and links to the corresponding source code.
Example 1. Basic shapes
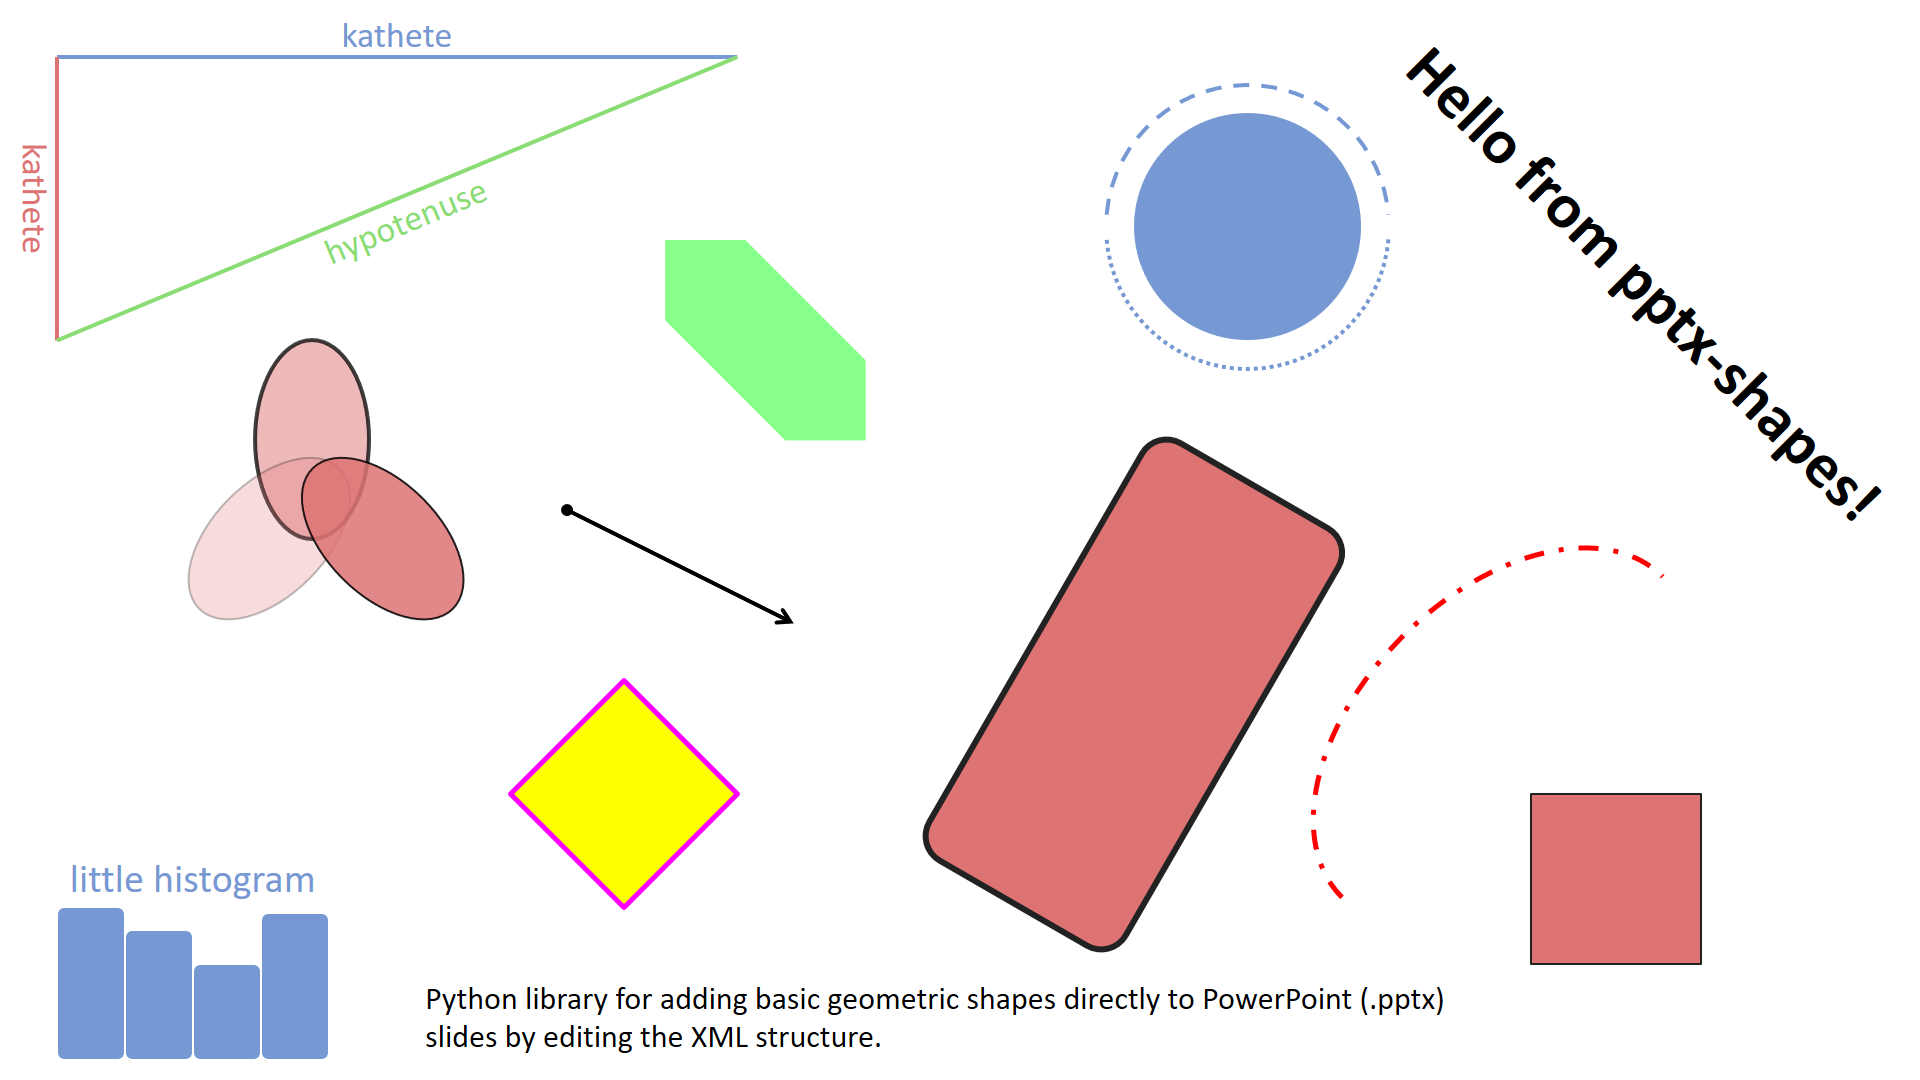
A simple demonstration of how to draw basic geometric elements – lines, ellipses, rectangles, polygons, arrows and text – on a blank slide (examples/basic.py).
Download .pptx: examples/basic.pptx
Example 2. Fractal
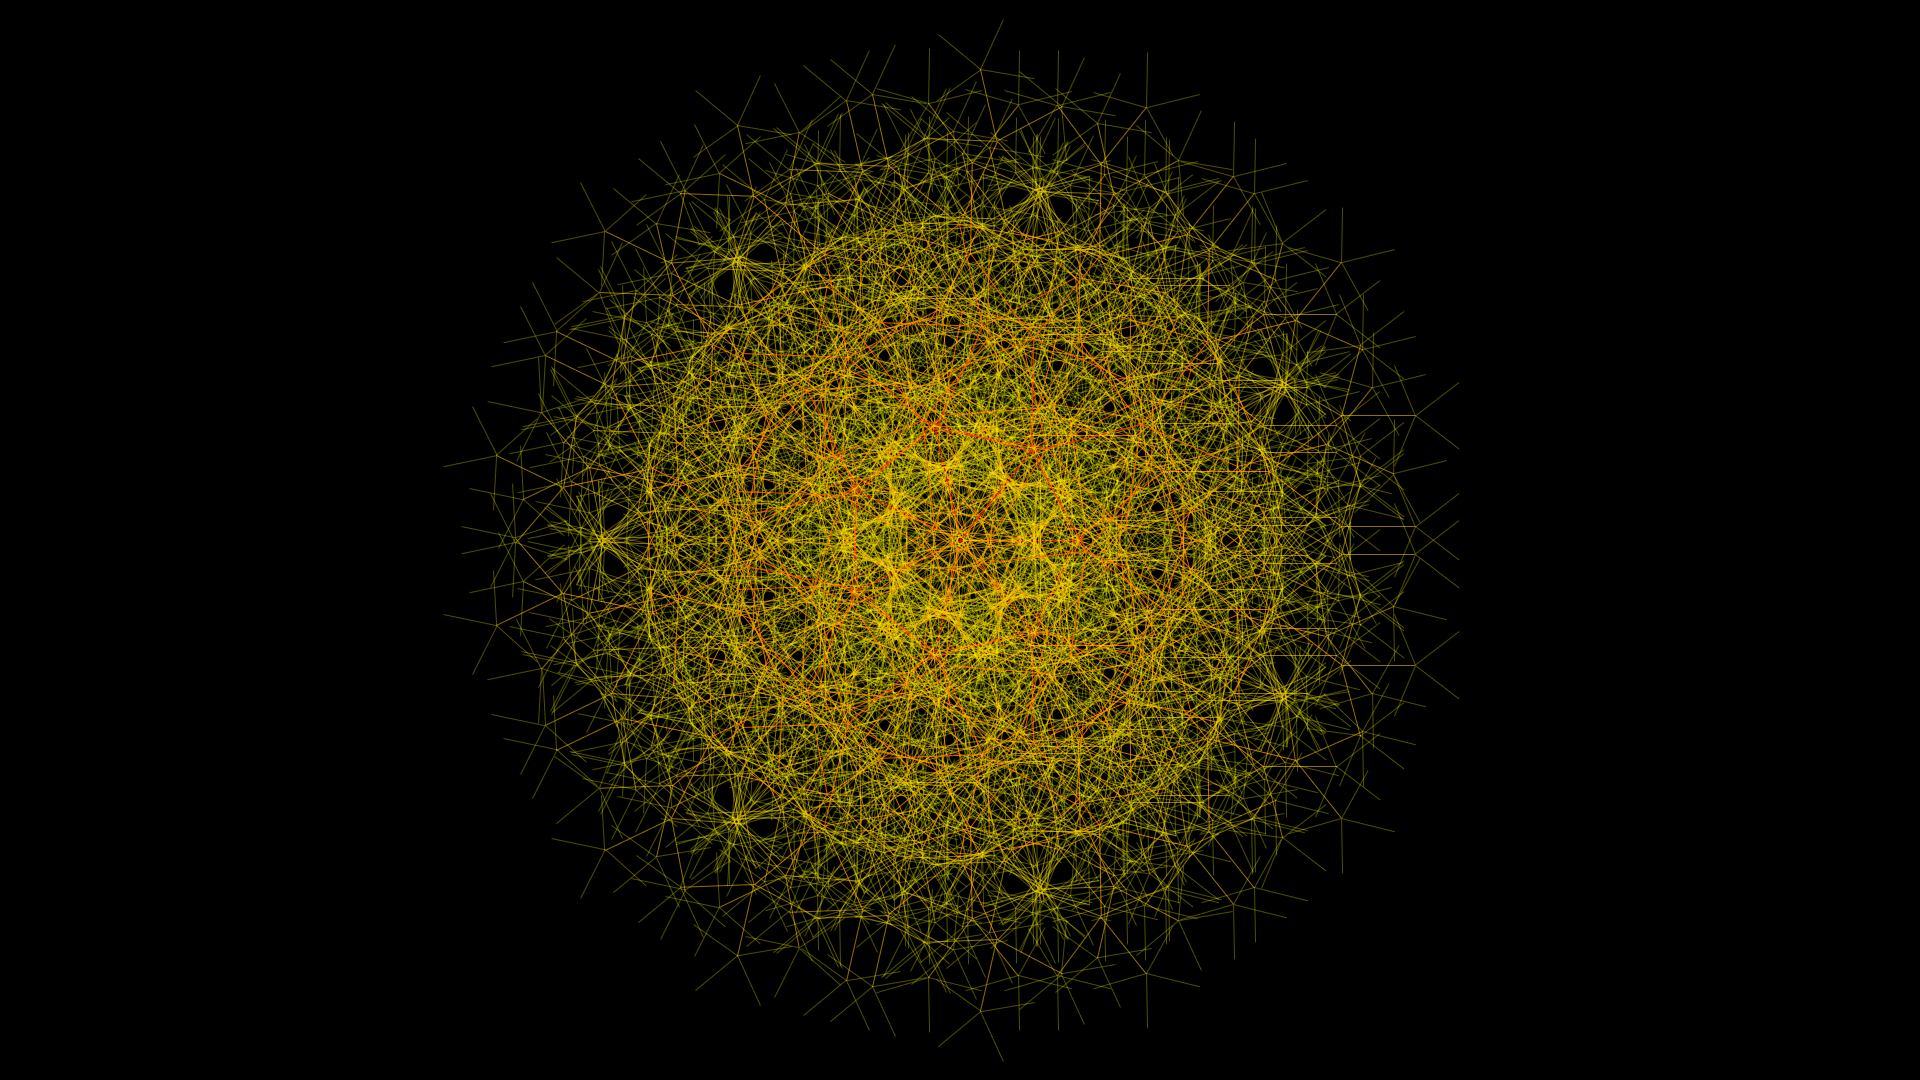
This example shows how to render a fractal using lines (examples/fractal.py).
Download .pptx: examples/fractal.pptx
Example 3. Scatter plots
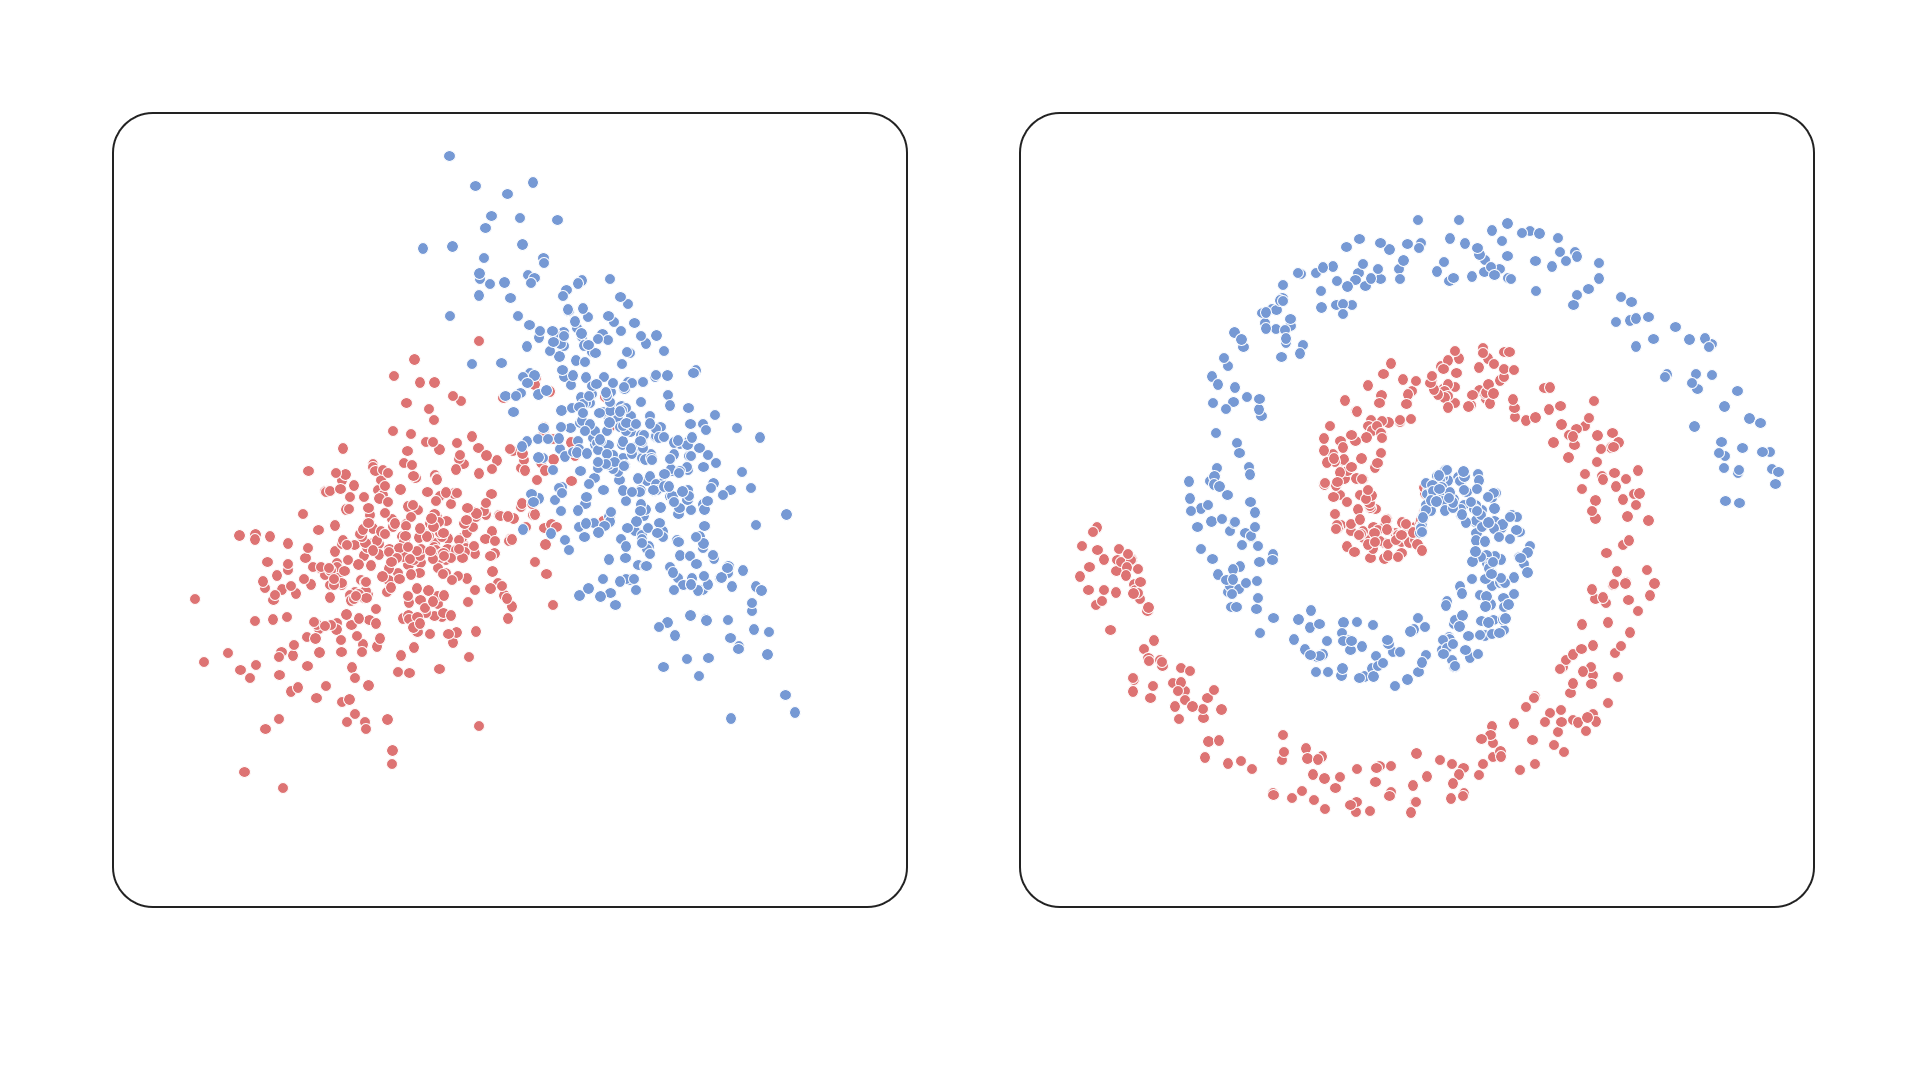
This example shows how to render a scatter plot using ellipses as data points, demonstrating precise positioning and styling (examples/scatter.py).
Download .pptx: examples/scatter.pptx
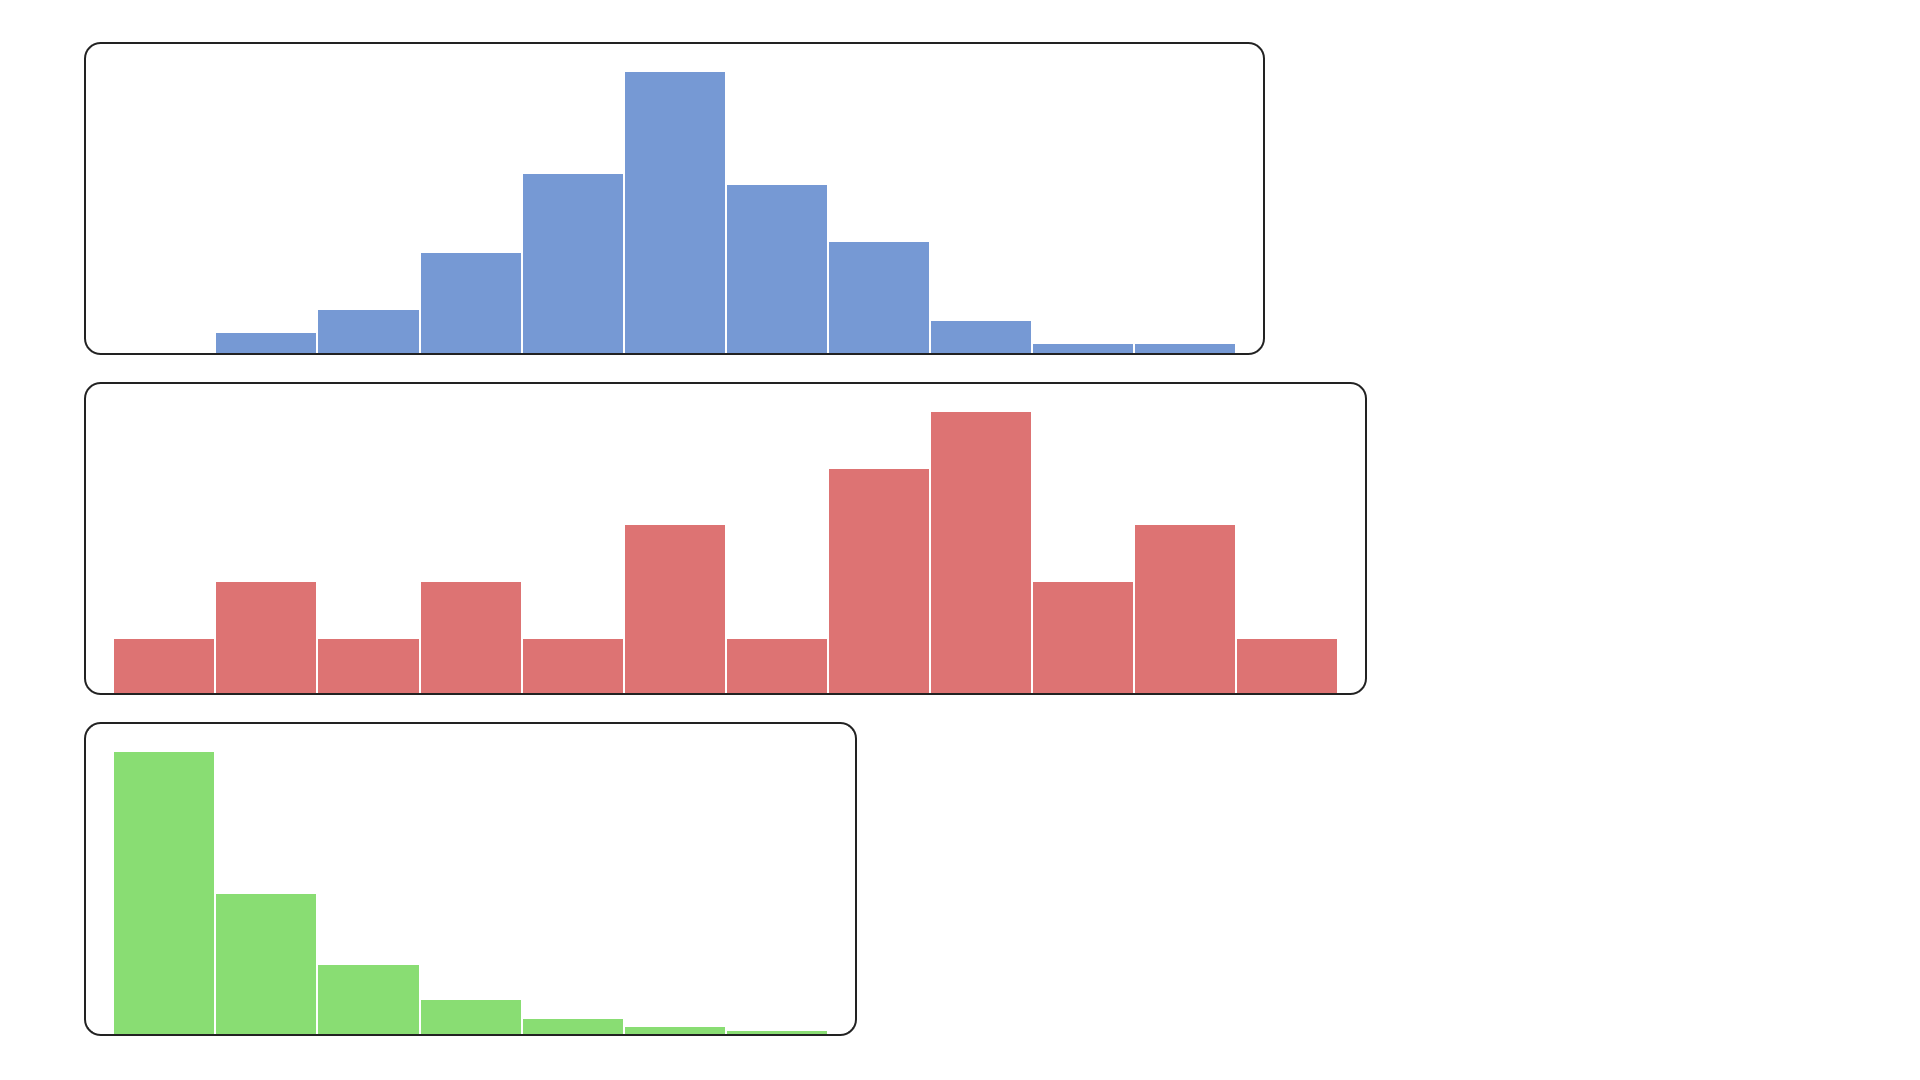
Example 4. Histograms
Bar-style visualizations built using rectangles – this example illustrates how to construct a histogram layout with custom colors (examples/histogram.py).
Download .pptx: examples/histogram.pptx
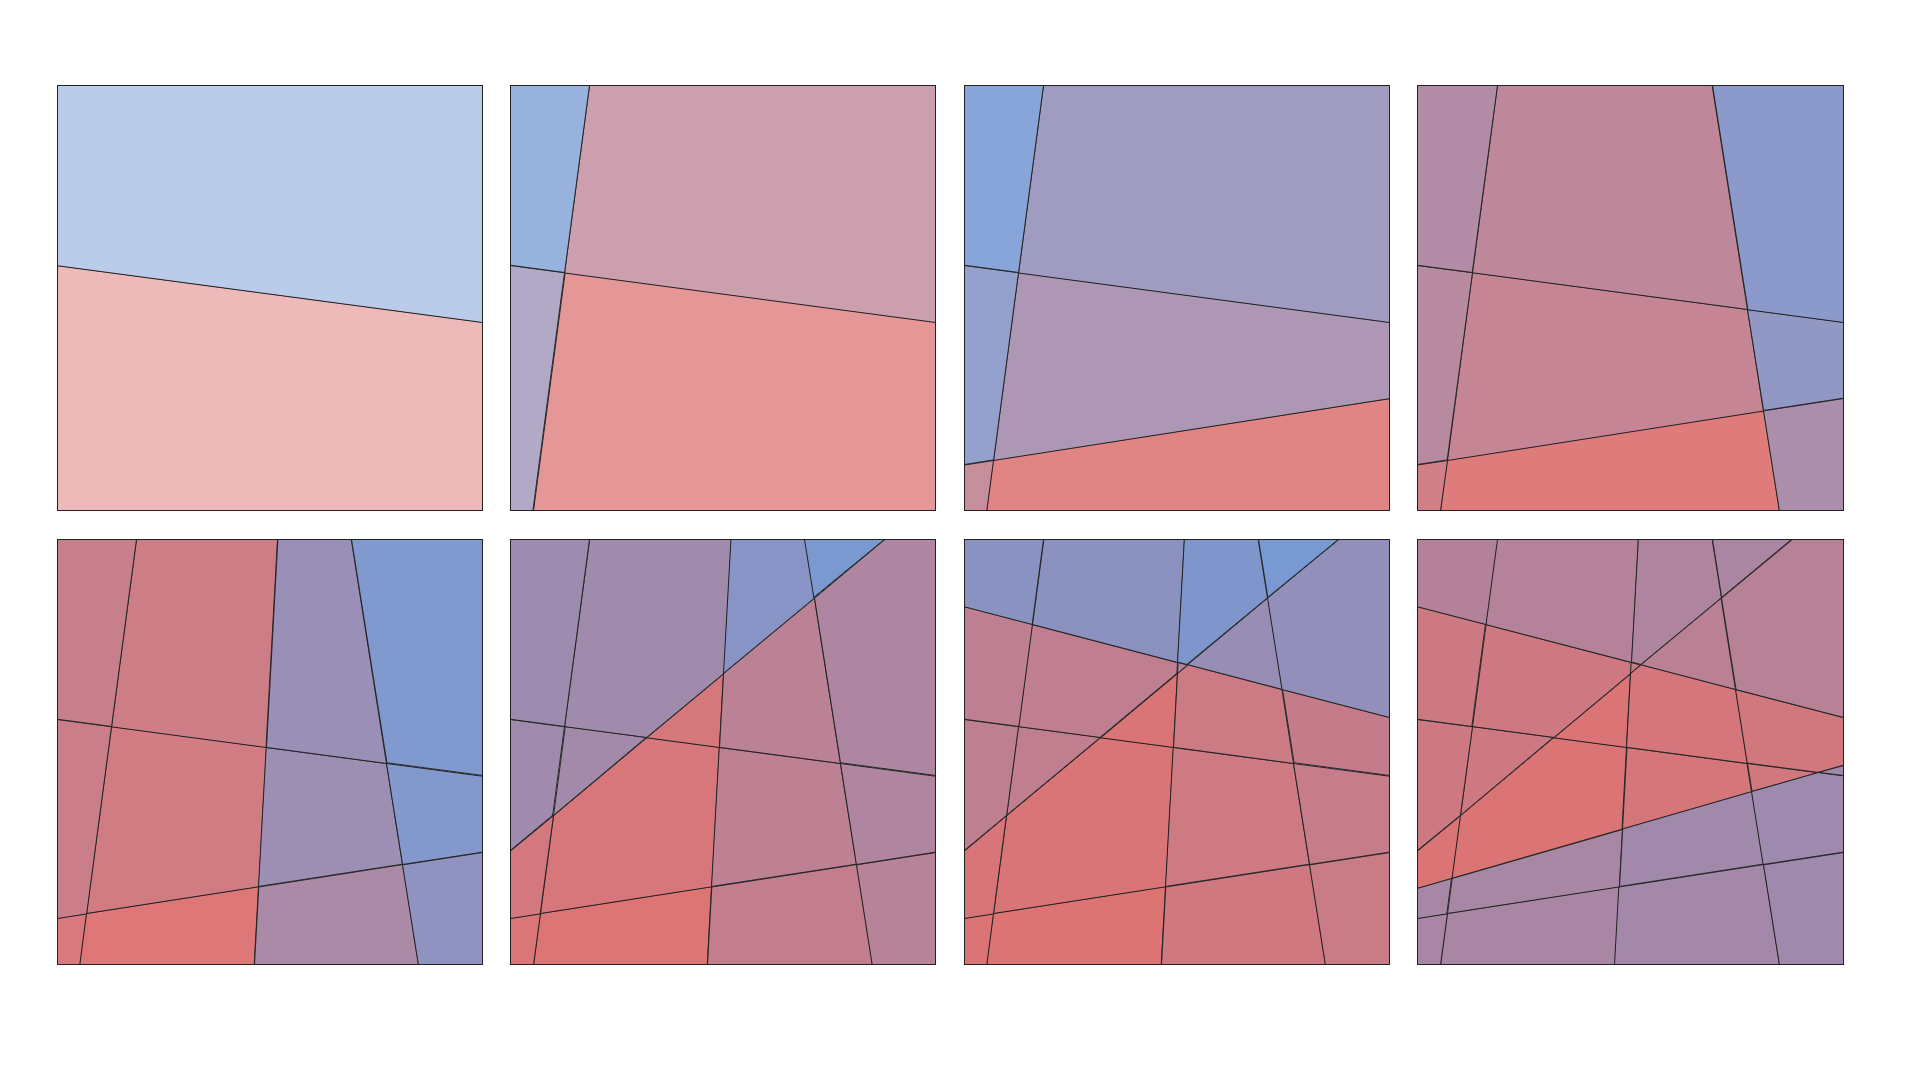
Example 5. Polygons split
A more advanced use case – splitting polygonal shapes by lines. Useful for illustrating partitions or segmentations (examples/polygons.py).
Download .pptx: examples/polygons.pptx
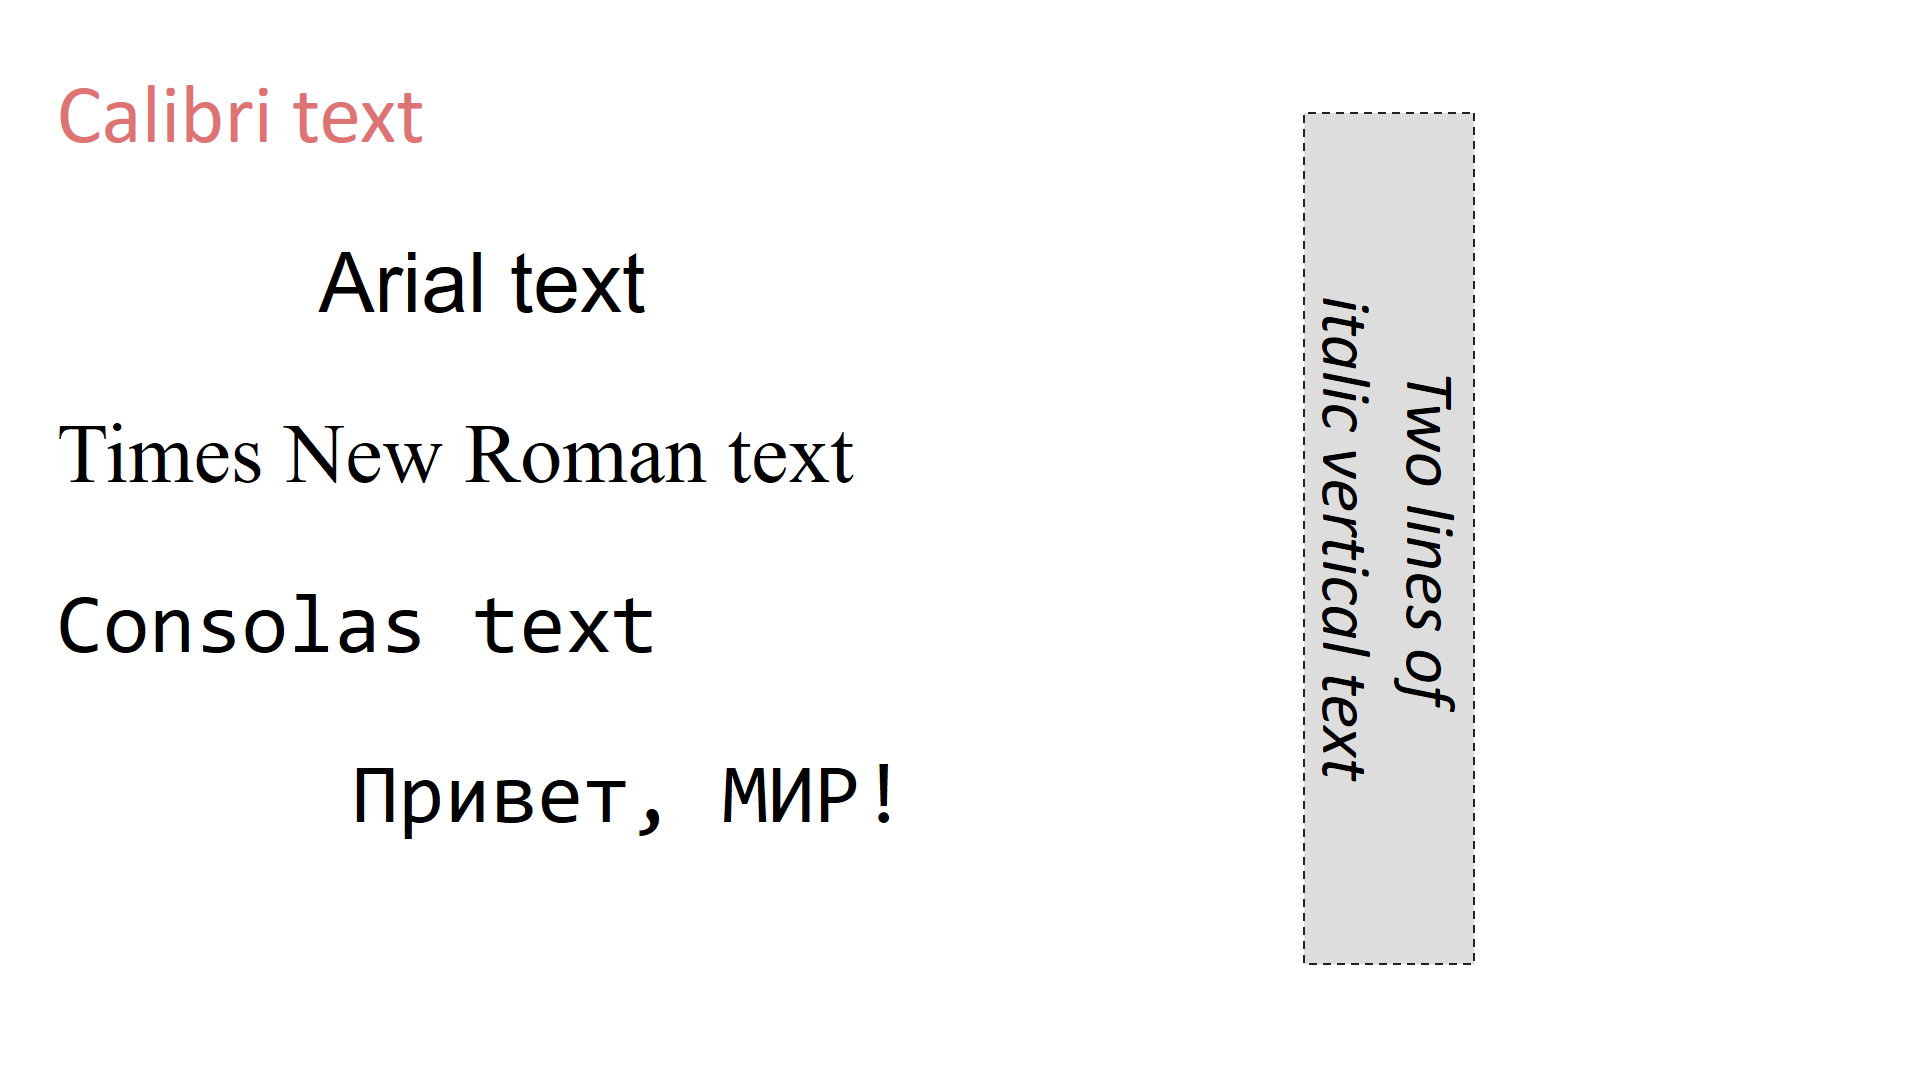
Example 6. Font families and text styles
This example demonstrates how to use different font families and styles in TextBox shapes. It shows how to customize font size, alignment, color, and the font family.
(examples/text_boxes.py).
Download .pptx: examples/text_boxes.pptx
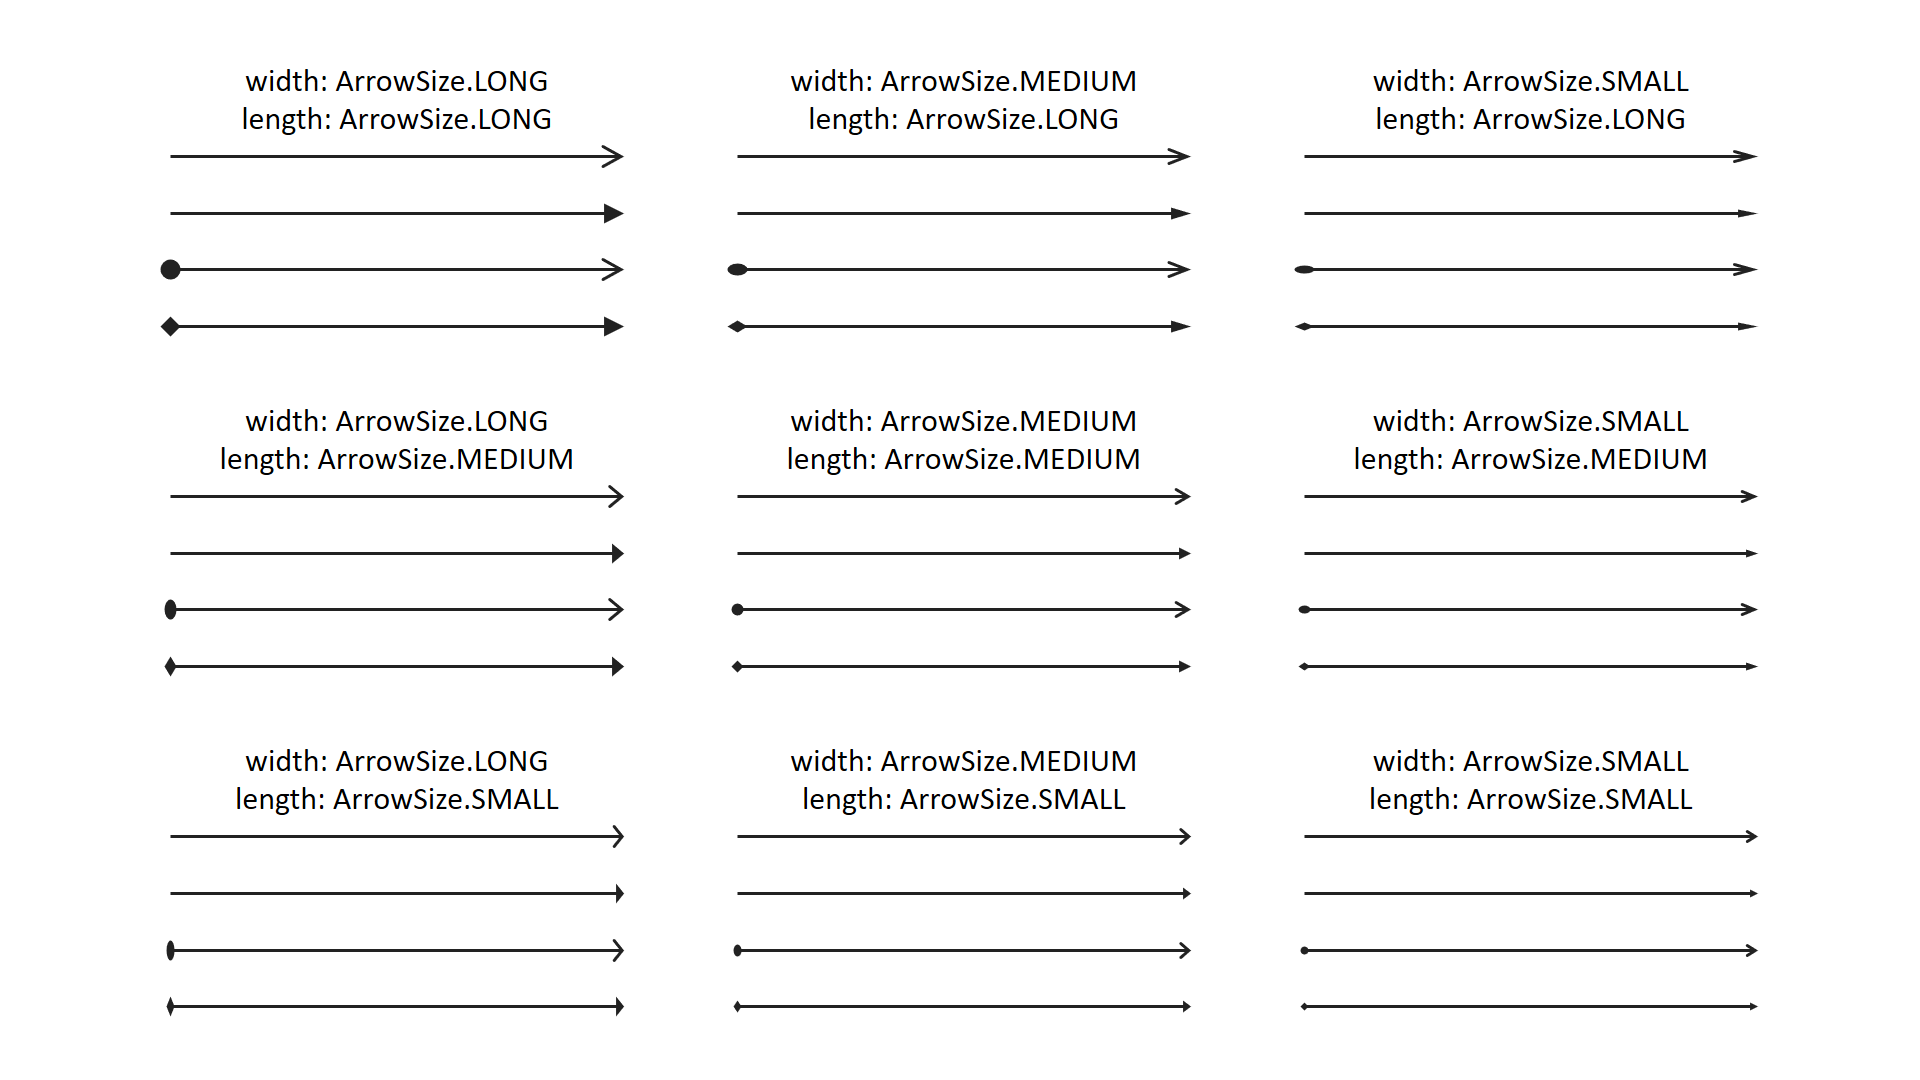
Example 7. Arrowhead styles
This example demonstrates how to use different arrowhead types for Arrow shapes. It shows how to customize head form, length and width of arrowhead.
(examples/arrows.py).
Download .pptx: examples/arrows.pptx
Chart examples
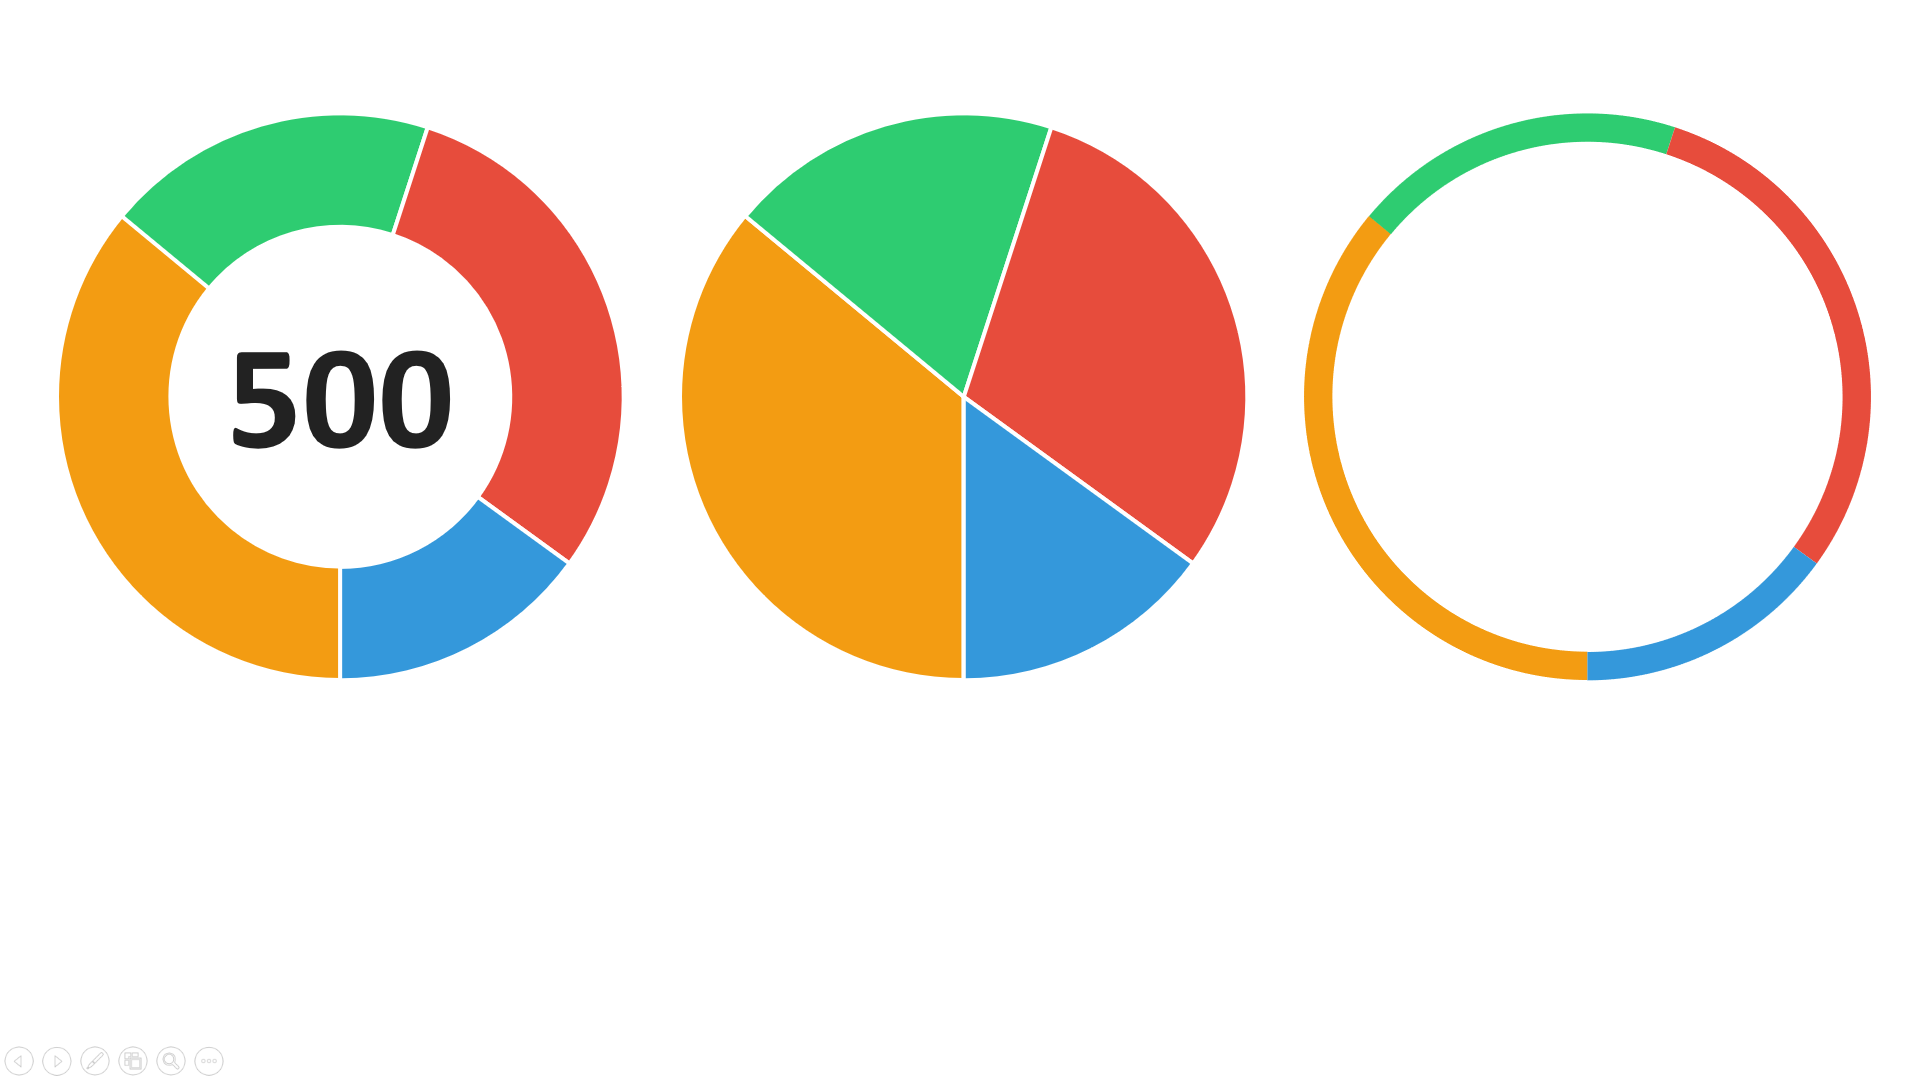
Example 1. Donut charts
This example demonstrates how to use DonutChart from charts.donut module
(examples/charts/donut_chart.py).
Download .pptx: examples/charts/donut_chart.pptx
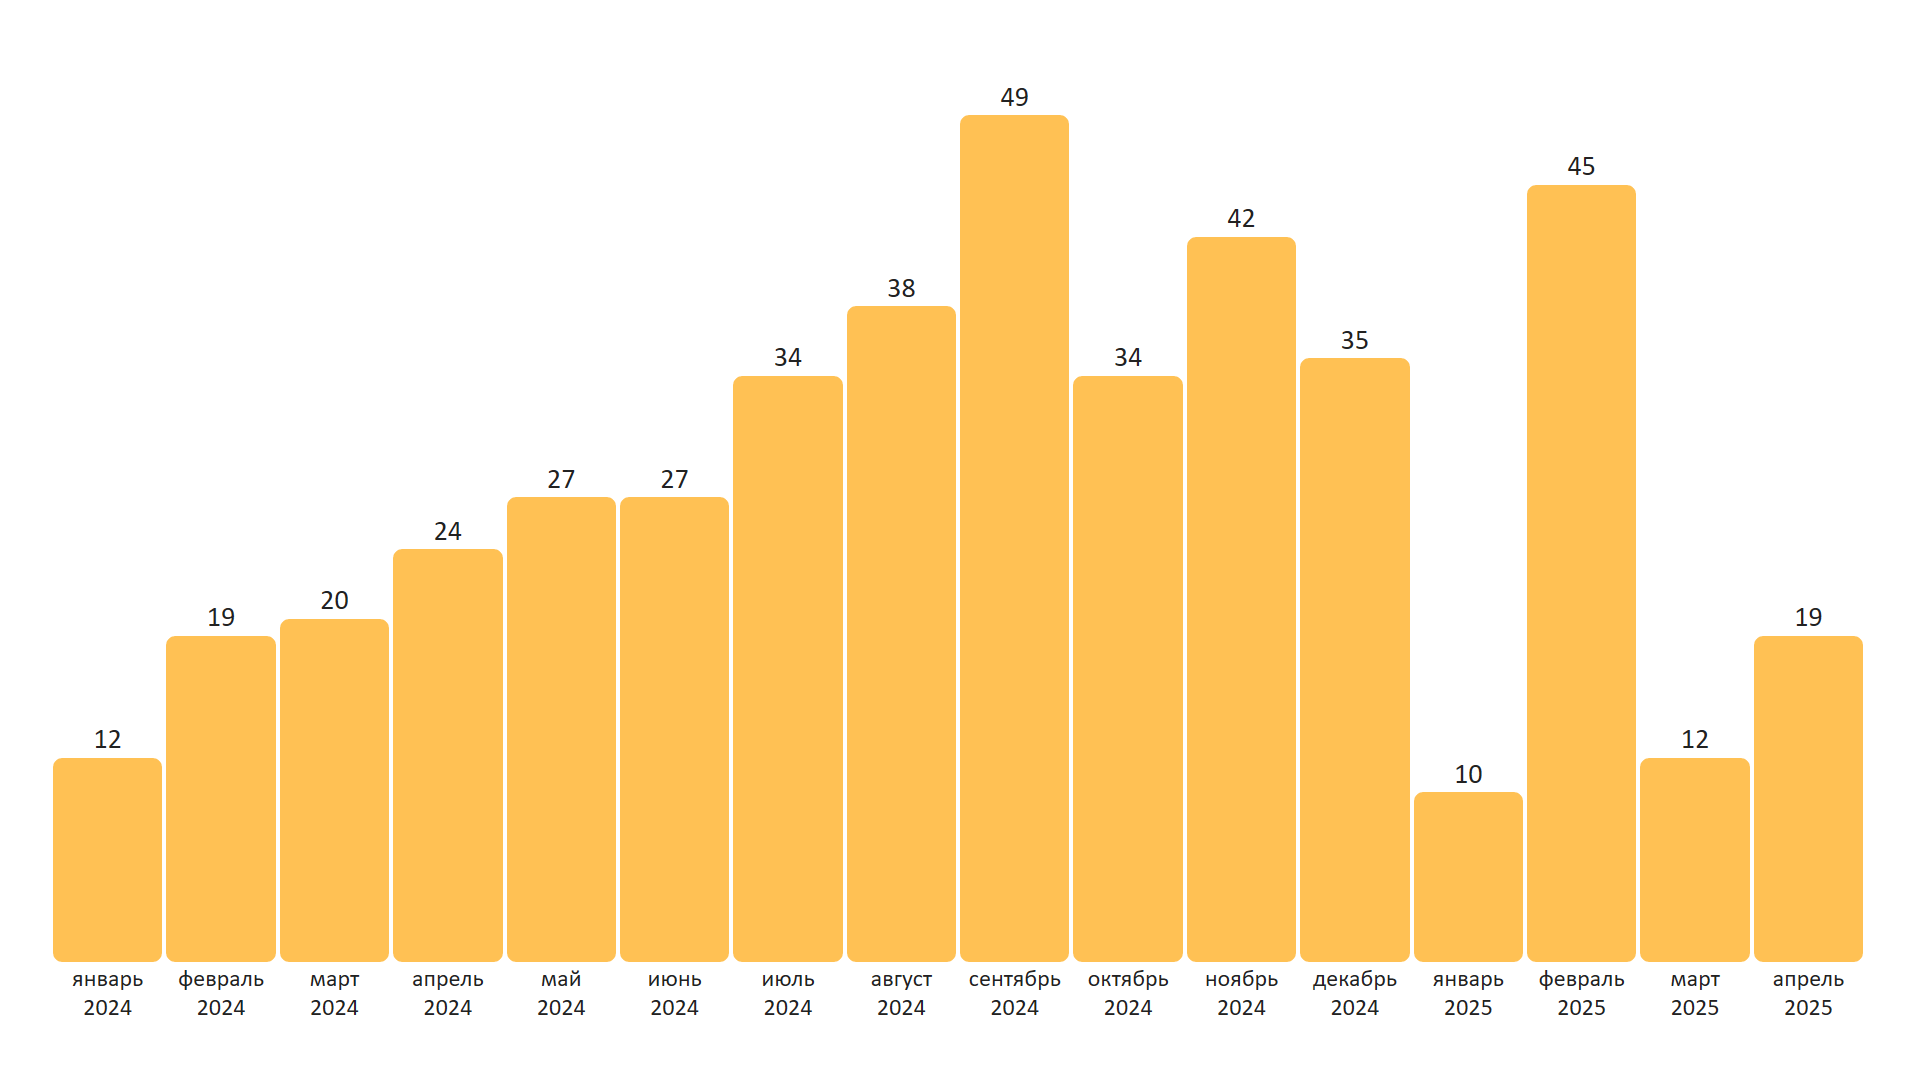
Example 2. Bar chart
This example demonstrates how to use BarChart from charts.bar module
(examples/charts/bar_chart.py).
Download .pptx: examples/charts/bar_chart.pptx
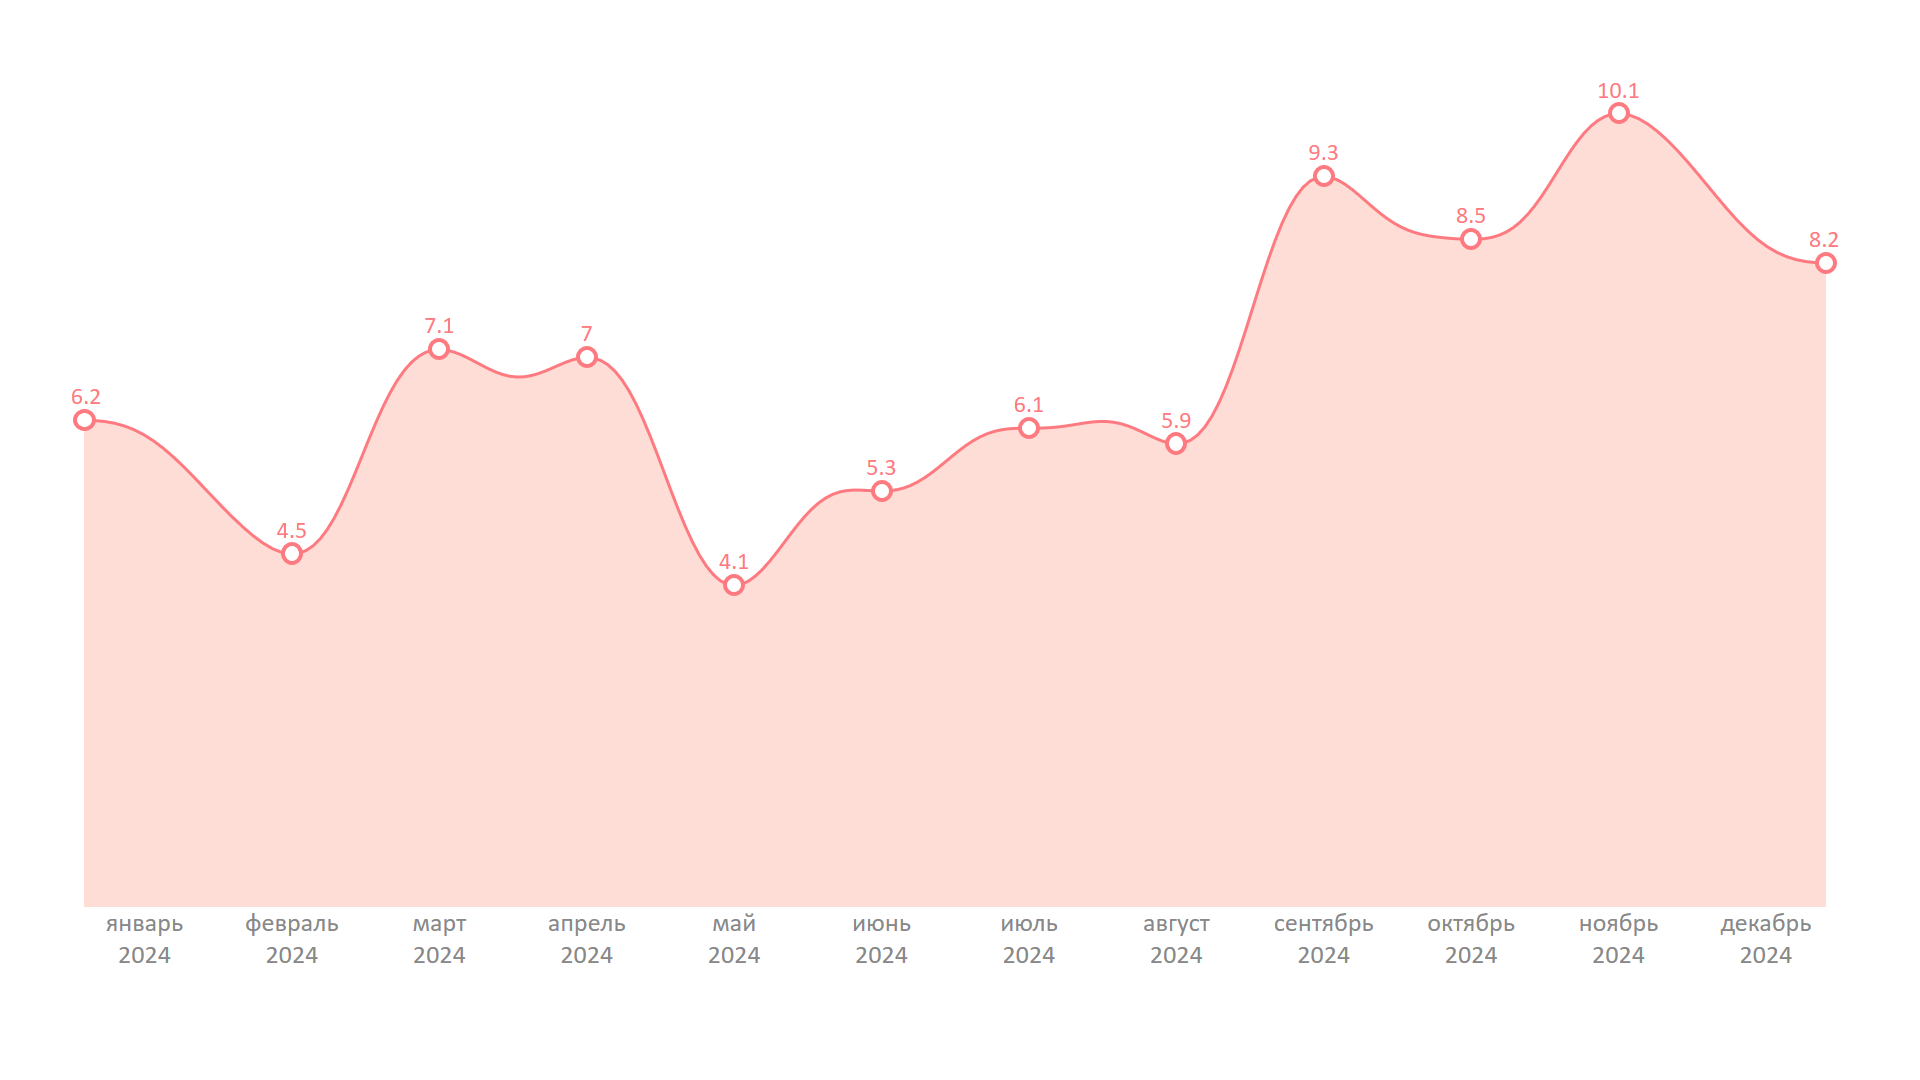
Example 3. Line chart
This example demonstrates how to use LineChart from charts.line module
(examples/charts/line_chart.py).
Download .pptx: examples/charts/line_chart.pptx
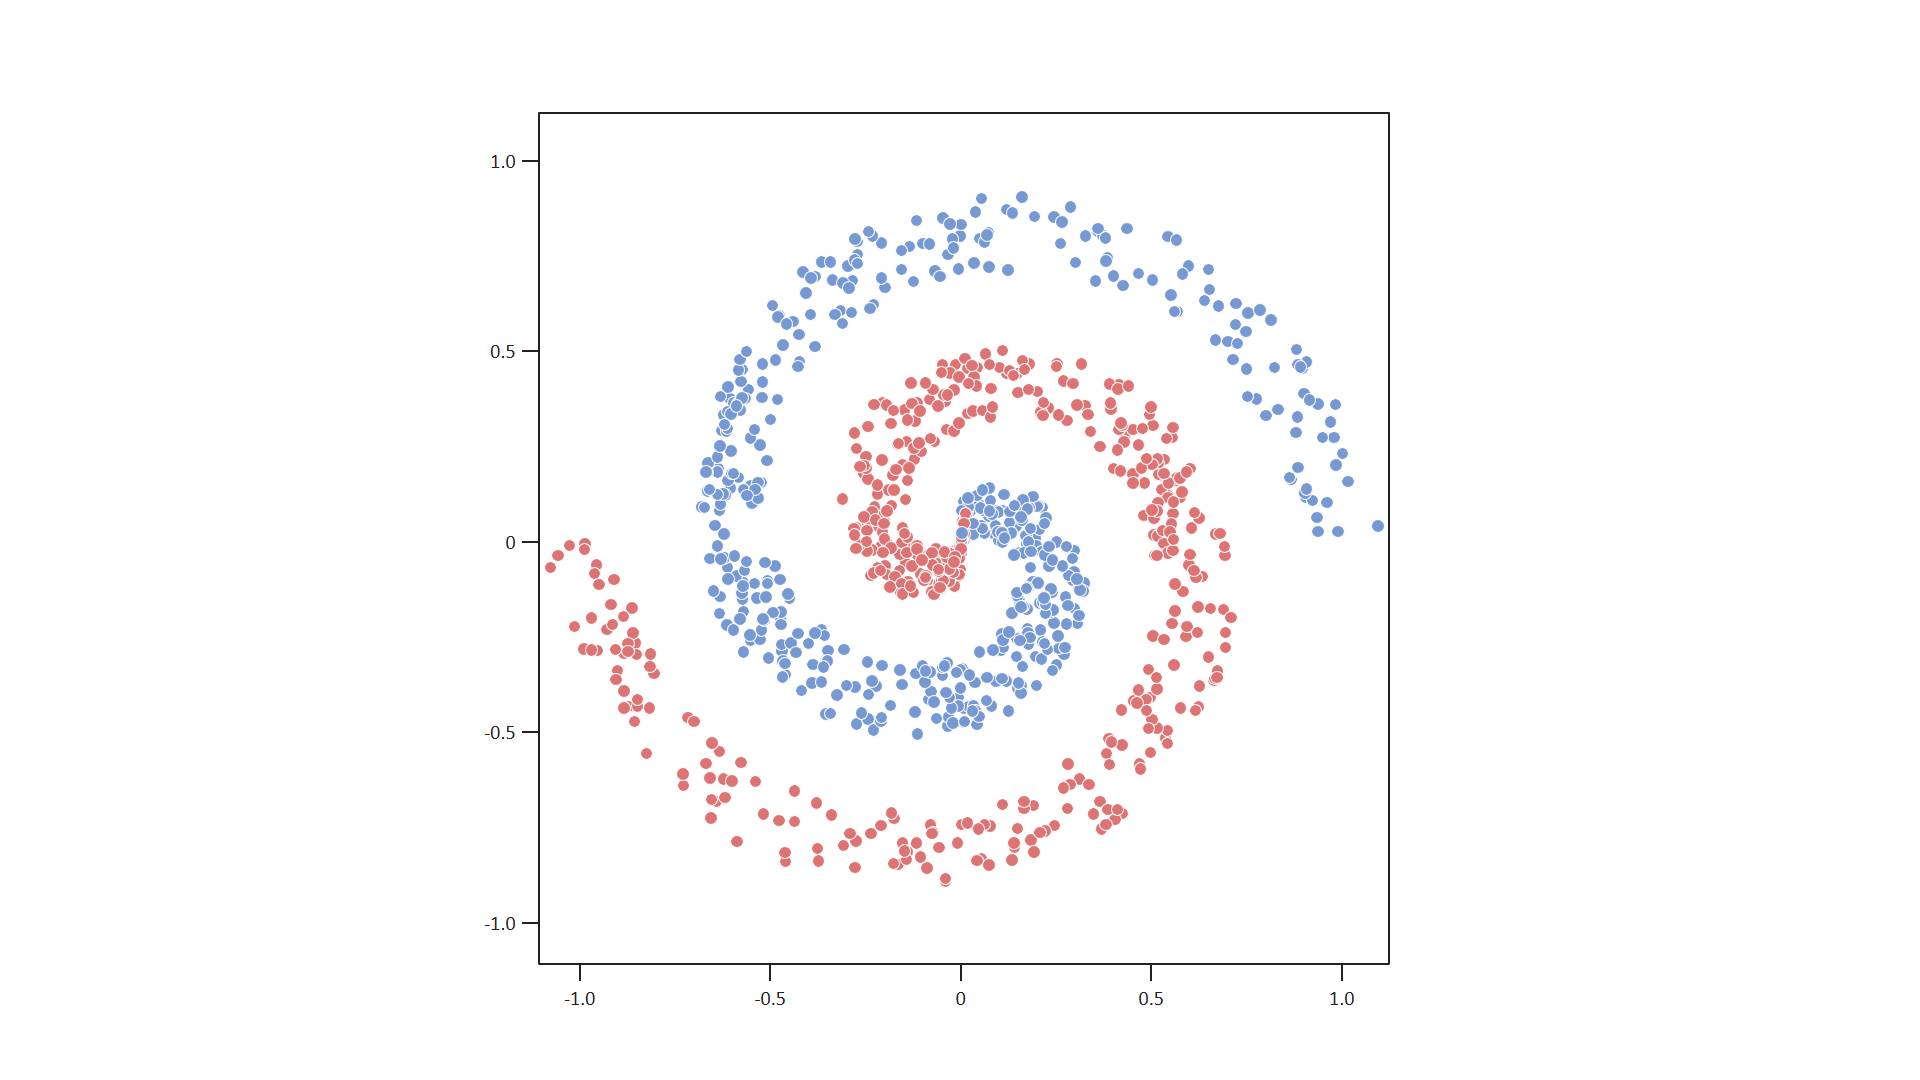
Example 4. Scatter plot
This example demonstrates how to use ScatterPlot from charts.scatter module
(examples/charts/scatter_plot.py).
Download .pptx: examples/charts/scatter_plot.pptx
Changelog
See CHANGELOG.md for version history.
License
Licensed under the MIT License. Feel free to use it in your projects.
Contributing
Pull requests, issues, and feature ideas are very welcome!
1 maintainer

Release files for pptx-shapes 0.3.1
For a detailed explanation of source distributions (sdists) and built distributions (wheels), please see the package formats documentation.
Source distribution (sdist)
| File | Size | Uploaded | |
|---|---|---|---|
| pptx_shapes-0.3.1.tar.gz | 21.6 kB | Details |
Built distribution (wheel)
| File | Interpreter | ABI | Platform | Reset |
|---|---|---|---|---|
| pptx_shapes-0.3.1-py3-none-any.whl | Python 3 | none | any | Details |
Total release size: 54.8 kB
Release files / pptx_shapes-0.3.1.tar.gz
| Download URL | pptx_shapes-0.3.1.tar.gz |
|---|---|
| Size | 21.6 kB |
| Tags | Source |
|
SHA-256 checksum How to use checksums |
21d103155c0cd7af9881b8fdc91058d8fb6037f2fce210c955721623b4c9fbe1
|
|
BLAKE2b-256 checksum How to use checksums |
fb0e69e6313571949450695eda15c77dcc9af9c43c19933028610eec33efab69
|
| Upload date | |
|
Uploaded using Trusted Publishing? What is trusted publishing? |
No |
| Uploaded via |
twine/6.1.0 CPython/3.10.0
|
Release files / pptx_shapes-0.3.1-py3-none-any.whl
| Download URL | pptx_shapes-0.3.1-py3-none-any.whl |
|---|---|
| Size | 33.2 kB |
| Tags | Python 3 |
|
SHA-256 checksum How to use checksums |
f3775761d5633b3590523667361bfab0ed03b5fdf6dce432d8fcef03a20f382e
|
|
BLAKE2b-256 checksum How to use checksums |
299d146b768c90795234a121be2824caeec3b7e8c0fbec7ec69f5f4e86b653f5
|
| Upload date | |
|
Uploaded using Trusted Publishing? What is trusted publishing? |
No |
| Uploaded via |
twine/6.1.0 CPython/3.10.0
|














