Python library for adding basic geometric shapes directly to PowerPoint (.pptx) slides by editing the XML structure.

Project description
pptx-shapes


Python library for adding basic geometric shapes directly to PowerPoint (.pptx) slides by editing the XML structure.
Features
- Add basic shapes (ellipse, line, polygon, etc.) to existing slides
- Control position, size, fill, stroke, and other styles
- Work directly with slides XML structure
- Save result as
.pptx
Installation
pip install pptx-shapes
Quick Start
from pptx_shapes import Presentation
from pptx_shapes.shapes import Ellipse, Rectangle, TextBox
from pptx_shapes.style import FillStyle, FontFormat, FontStyle, StrokeStyle

with Presentation(presentation_path="empty.pptx") as presentation:
    presentation.add(shape=TextBox(
        x=23, y=4, width=12, height=2, angle=45,
        text="Hello from pptx-shapes!",
        style=FontStyle(size=32),
        formatting=FontFormat(bold=True)
    ))

    presentation.add(shape=Ellipse(
        x=20, y=2, width=4, height=4,
        fill=FillStyle(color="#7699d4")
    ))

    presentation.add(shape=Rectangle(
        x=18, y=8, width=4, height=8.5, radius=0.25, angle=30,
        fill=FillStyle(color="#dd7373"),
        stroke=StrokeStyle(color="magenta", thickness=3)
    ))

    presentation.save("result.pptx")
How it works
This library modifies .pptx files by directly editing the underlying XML structure.
A .pptx presentation is essentially a ZIP archive containing XML files that describe slides, layouts, and content. This library works by:
- Unzipping the
.pptxfile. - Locating and parsing the target slide file (e.g.,
ppt/slides/slide1.xml). - Inserting new shape elements into the slide's XML tree, using tags like
<p:sp>,<p:cxnSp>, and<a:prstGeom>. - Saving the modified XML.
- Repacking all files into a
.pptxarchive.
This low-level approach is ideal for automated slide generation, data visualizations, and geometric illustrations – especially when you need to create many shapes or apply programmatic styles.
Supported Shapes
Currently, pptx-shapes supports the following geometric shapes:
| Shape | Class | Description |
|---|---|---|
| Line | Line |
Straight line between two points |
| Arrow | Arrow |
Straight arrow between two points |
| Arc | Arc |
Curved segment defined by the bounding box and start/end angles |
| Arch | Arch |
Ring-shaped arc defined by the bounding box, thickness and start/end angles |
| Ellipse | Ellipse |
Ellipse defined by top-left corner, size, and rotation angle |
| Rectangle | Rectangle |
Rectangle defined by top-left corner, size, corner radius and rotation angle |
| Pie | Pie |
Filled sector of a circle, defined by the bounding box and start/end angles |
| Polygon | Polygon |
Arbitrary polygon defined by a list of points and rotation angle |
| TextBox | TextBox |
Text container with position, size, rotation, and font style |
| Group | Group |
A group of multiple shapes |
Line
A straight line connecting two points.
Line(
    x1=0.5, y1=1, # start point (cm)
    x2=1.5, y2=5, # end point (cm)
    stroke=...    # StrokeStyle
)
Parameters
x1,y1: coordinates for the start pointx2,y2: coordinates for the end pointstroke:StrokeStylefor the stroke
Arrow
A straight arrow connecting two points.
Arrow(
    x1=0.5, y1=1,                 # start point (cm)
    x2=1.5, y2=5,                 # end point (cm)
    start_type=ArrowType.NONE,    # type of arrow at the start
    end_type=ArrowType.TRIANGLE,  # type of arrow at the end
    stroke=...                    # StrokeStyle
)
Parameters
x1,y1: coordinates for the start pointx2,y2: coordinates for the end pointstart_type:ArrowTypeof arrow at the start pointend_type:ArrowTypeof arrow at the end pointstroke:StrokeStylefor the stroke
Arc
Draws a curved segment defined by the bounding box and start/end angles.
Arc(
    x=24, y=9,          # top-left angle (cm)
    width=5, height=8,  # diameters (cm)
    start_angle=90,     # start angle of the arc (degrees)
    end_angle=270,      # end angle of the arc (degrees)
    angle=30,           # optional rotation angle (degrees)
    fill=...,           # optional FillStyle
    stroke=...          # optional StrokeStyle
)
Parameters
x,y: top-left corner of the bounding box in centimeterswidth,height: width and height of the bounding box in centimetersstart_angle: start angle of the arc (in degrees, default0)end_angle: end angle of the arc (in degrees, default180)angle: the rotation angle of the arc in degrees (default is0).fill: optionalFillStyleto fill the arcstroke: optionalStrokeStylefor the border
Arch
A ring-shaped arc defined by the bounding box, thickness, and angular range. It is based on PowerPoint’s blockArc shape.
Arch(
    x=5, y=5,           # center (cm)
    width=3, height=3,  # sizes (cm)
    thickness=1,        # ring thickness (cm)
    start_angle=0,      # start angle (degrees)
    end_angle=270,      # end angle (degrees)
    angle=45,           # optional rotation angle (degrees)
    fill=...,           # optional FillStyle
    stroke=...          # optional StrokeStyle
)
Parameters
x,y: top-left corner coordinates in centimeterswidth,height: sizes in centimetersthickness: width of the ring (distance between outer and inner radius) in centimetersstart_angle,end_angle: arc range in degrees (default0and180)angle: the rotation angle of the arch in degrees (default is0)fill: optionalFillStyleto fill the archstroke: optionalStrokeStylefor the border
Ellipse
An ellipse is defined by its top-left corner and its width and height. It can be rotated by a given angle.
Ellipse(
    x=2, y=3.5,        # top-left angle (cm)
    width=4, height=6, # sizes (cm)
    angle=30,          # optional rotation angle (degrees)
    fill=...,          # optional FillStyle
    stroke=...         # optional StrokeStyle
)
Parameters
x,y: top-left corner coordinates in centimeterswidth,height: sizes in centimetersangle: the rotation angle of the ellipse in degrees (default is0)fill: optionalFillStyleto fill the ellipsestroke: optionalStrokeStylefor the border
Rectangle
A rectangle is defined by its top-left corner and its width and height. Like the ellipse, it can be rotated by a specific angle.
Rectangle(
    x=2, y=3.5,        # top-left angle (cm)
    width=4, height=6, # sizes (cm)
    angle=45,          # optional rotation angle (degrees)
    radius=0.05,       # optional radius of corner rounding (percents)
    fill=...,          # optional FillStyle
    stroke=...         # optional StrokeStyle
)
Parameters
x,y: coordinates defining the top-left corner (cm)width,height: the width and height of the rectangle (cm)radius: the radius of rounded corners as a percentage of the width/height (default is0)angle: the rotation angle of the rectangle in degrees (default is0)fill: fill stylestroke: stroke style
Pie
A filled sector of an ellipse, defined by its bounding box and angular range.
Pie(
    x=5, y=5,           # center (cm)
    width=3, height=3,  # sizes (cm)
    start_angle=0,      # start angle (degrees)
    end_angle=270,      # end angle (degrees)
    angle=45,           # optional rotation angle (degrees)
    fill=...,           # optional FillStyle
    stroke=...          # optional StrokeStyle
)
Parameters
x,y: top-left corner coordinates in centimeterswidth,height: sizes in centimetersstart_angle,end_angle: the angular range of the slice in degrees (default0and180)angle: the rotation angle of the pie in degrees (default is0)fill: optionalFillStyleto fill the archstroke: optionalStrokeStylefor the border
Polygon
A polygon can be an arbitrary shape defined by a list of points. It can also be rotated by an angle.
Polygon(
    points=[
        (11, 12),
        (13, 14),
        (11, 16),
        (9, 14),
        (11, 12)
    ],         # list of tuple points (cm)
    angle=15,  # optional rotation angle (degrees)
    fill=...,  # optional FillStyle
    stroke=... # optional StrokeStyle
)
Parameters
points: a list of tuples of(x, y)coordinates that define the vertices of the polygonangle: the rotation angle of the polygon in degrees (default is0)fill: fill stylestroke: stroke style
TextBox
A text box that holds text with customizable size, font style, margins, and rotation. You can define margins (padding around the text), and enable auto_fit to automatically resize
the box based on the text's length. If auto_fit is set to True, the width and height of the text box will be adjusted to accommodate the text content.
TextBbox(
    x=23, y=4,          # top-left angle (cm)
    width=12, height=2, # sizes (cm)
    text="Hello!",      # text content (new lines also possible)
    angle=45,           # optional rotation angle (degrees)
    auto_fit=False,     # fit sizes by the text content
    style=...,          # optional FontStyle
    formatting=...,     # optional FontFormat
    margin=...,         # optional Margin
    fill=...,           # optional FillStyle
    stroke=...          # optional StrokeStyle
)
Parameters
x,y: coordinates defining the top-left corner (cm)width,height: the width and height of the text boxtext: the text content of the boxangle: the rotation angle of the text box in degrees (default is0)auto_fit: boolean that, when set toTrue, automatically adjusts the size of the text box to fit itsstyle: style of the font (font size, color, etc.)formatting: formatting of the content (bold, italic, underline, ...)margin: (left, top, right, bottom) margins that define the inner spacing of the text boxfill: fill stylestroke: stroke style
Group
A group allows you to combine multiple shapes into one unit. This is useful for creating complex compositions of shapes that should be manipulated together.
Group(shapes=[
    Ellipse(...),
    Rectangle(...),
    ...
])
Parameters
shapes: a list ofShapeobjects that you want to group together.
Style and formatting classes
The library provides several classes to define the style and formatting of shapes. These classes help customize the appearance of shapes, including their colors, borders, text styling, and margins.
FillStyle
Defines the fill color and opacity for a shape. The FillStyle class allows you to control the internal color of shapes like rectangles, ellipses, and more.
FillStyle(
    color="#7699d4", # hex, rgb or named color
    opacity=1
)
StrokeStyle
Defines the stroke (outline) of a shape, including its color, thickness, opacity, and line style. Use this class to customize the borders of shapes such as lines, rectangles, and ellipses.
StrokeStyle(
    color="#7699d4", # hex, rgb or named color
    thickness=1,     # width in pt
    opacity=1,
    dash=LineDash.SOLID
)
FontStyle
Defines the font style for text shape (TextBox). This includes font size, color, and alignments.
FontStyle(
    size=14,
    family="Calibri",
    color="#000000",
    align=Align.CENTER,
    vertical_align=VerticalAlign.CENTER
)
FontFormat
Defines additional text formatting options for font styling. You can use this class to apply bold, italic, underline, or strike-through to text.
FontFormat(
    bold=False,
    italic=False,
    underline=False,
    strike=False
)
Margin
Defines the margins inside a TextBox. These margins control the inner spacing around the text content.
Margin(
    left=0.25,
    right=0.25,
    top=0.1,
    bottom=0.1
)
These formatting classes allow you to fine-tune the appearance of shapes and text on your slides. You can apply custom fills, strokes, fonts, and margins to make the presentation visually appealing and precise.
Enums
Several enums are used to standardize alignment, line styles, and arrowheads.
Align
Horizontal text alignment:
Align.LEFT     # "l"
Align.CENTER   # "ctr"
Align.RIGHT    # "r"
VerticalAlign
Vertical text alignment:
VerticalAlign.TOP     # "t"
VerticalAlign.CENTER  # "ctr"
VerticalAlign.BOTTOM  # "b"
ArrowType
Arrowhead style:
ArrowType.TRIANGLE  # triangle arrowhead
ArrowType.ARROW     # classic open arrowhead
ArrowType.DIAMOND   # diamond arrowhead
ArrowType.OVAL      # oval arrowhead
ArrowType.NONE      # no arrowhead
LineDash
Stroke dash style for lines:
LineDash.SOLID                 # solid line
LineDash.DASHED                # dashed line
LineDash.DOTTED                # dotted line
LineDash.SHORT_DASHED          # short dashes
LineDash.DASH_DOTTED           # dash-dot pattern
LineDash.LONG_DASH             # long dashes
LineDash.LONG_DASH_DOTTED      # long dash-dot
LineDash.LONG_DASH_DOT_DOTTED  # long dash-dot-dot
Examples
The following examples illustrate how to generate PowerPoint slides with various geometric shapes using python-shapes.
All examples include screenshots, downloadable .pptx files, and links to the corresponding source code.
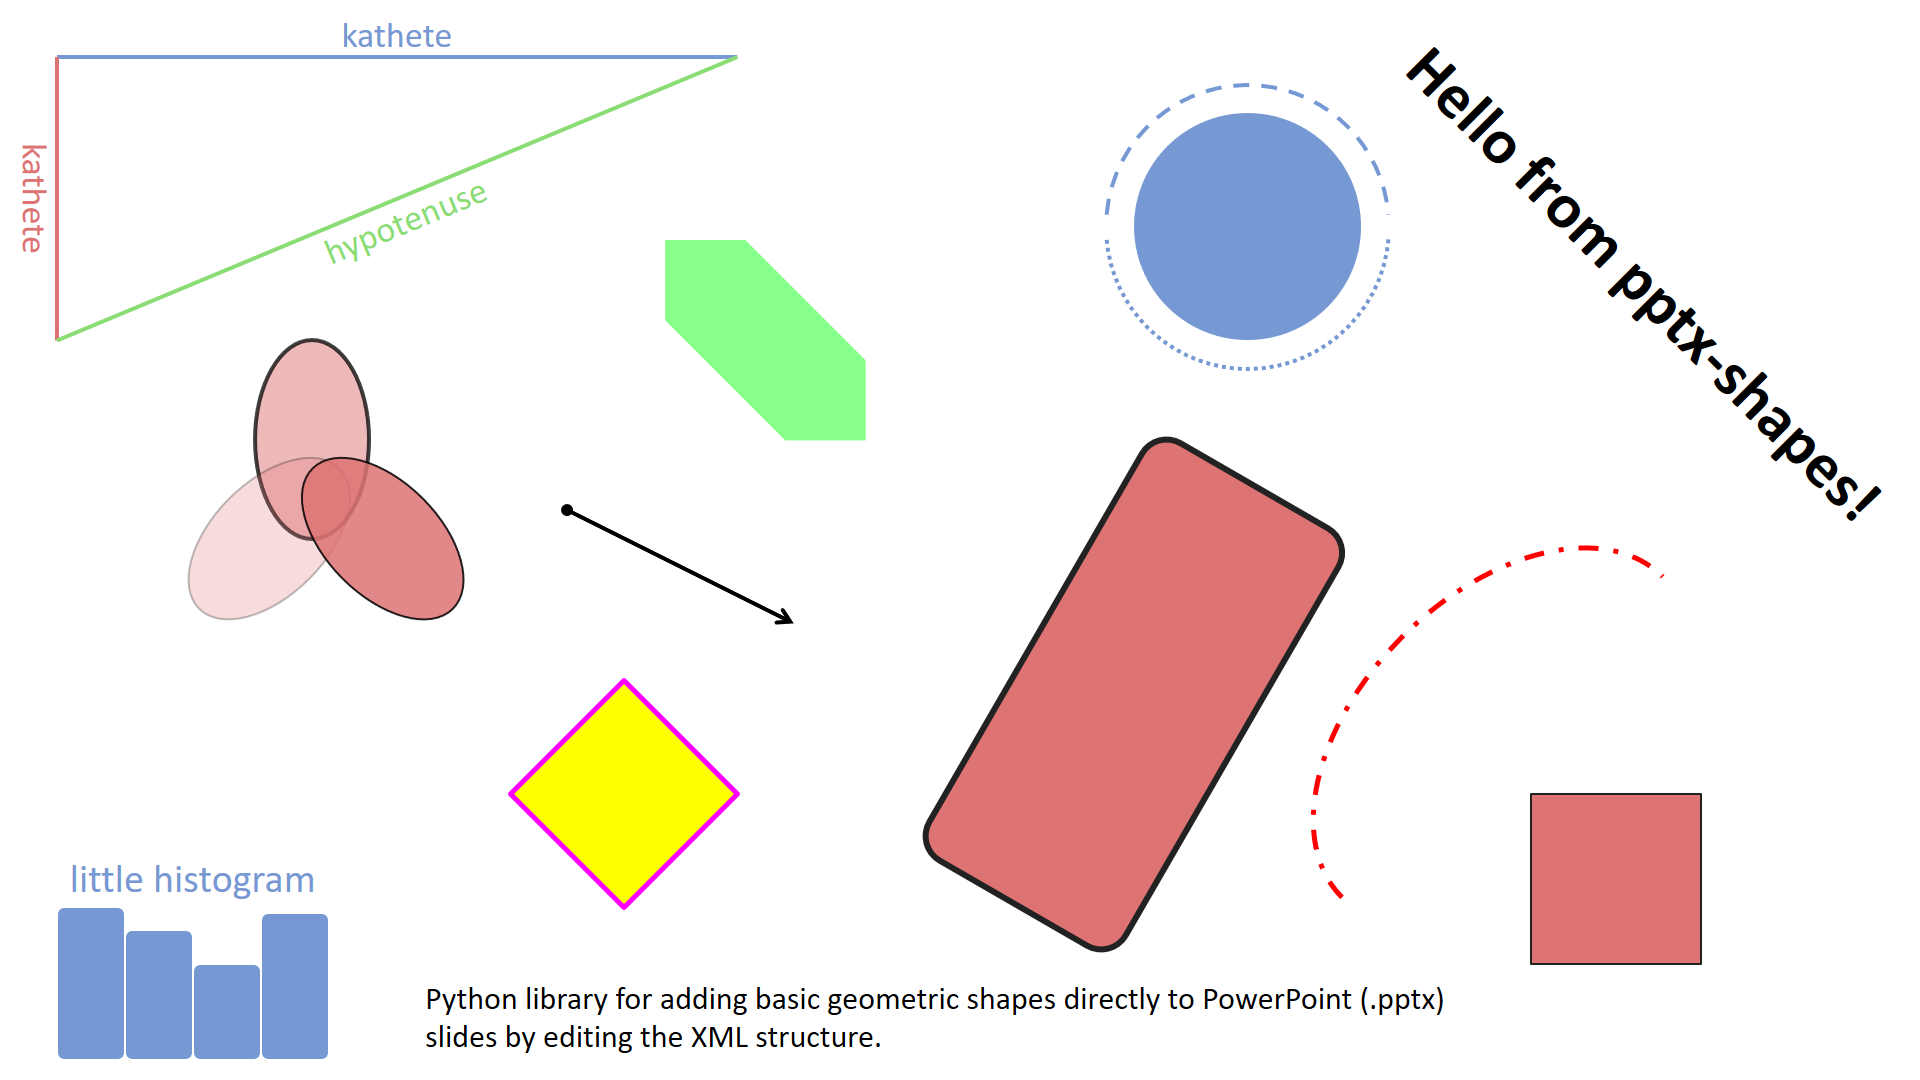
Example 1. Basic shapes
A simple demonstration of how to draw basic geometric elements – lines, ellipses, rectangles, polygons, arrows and text – on a blank slide (examples/basic.py).
Download .pptx: examples/basic.pptx
Example 2. Scatter plots
This example shows how to render a scatter plot using ellipses as data points, demonstrating precise positioning and styling (examples/scatter.py).
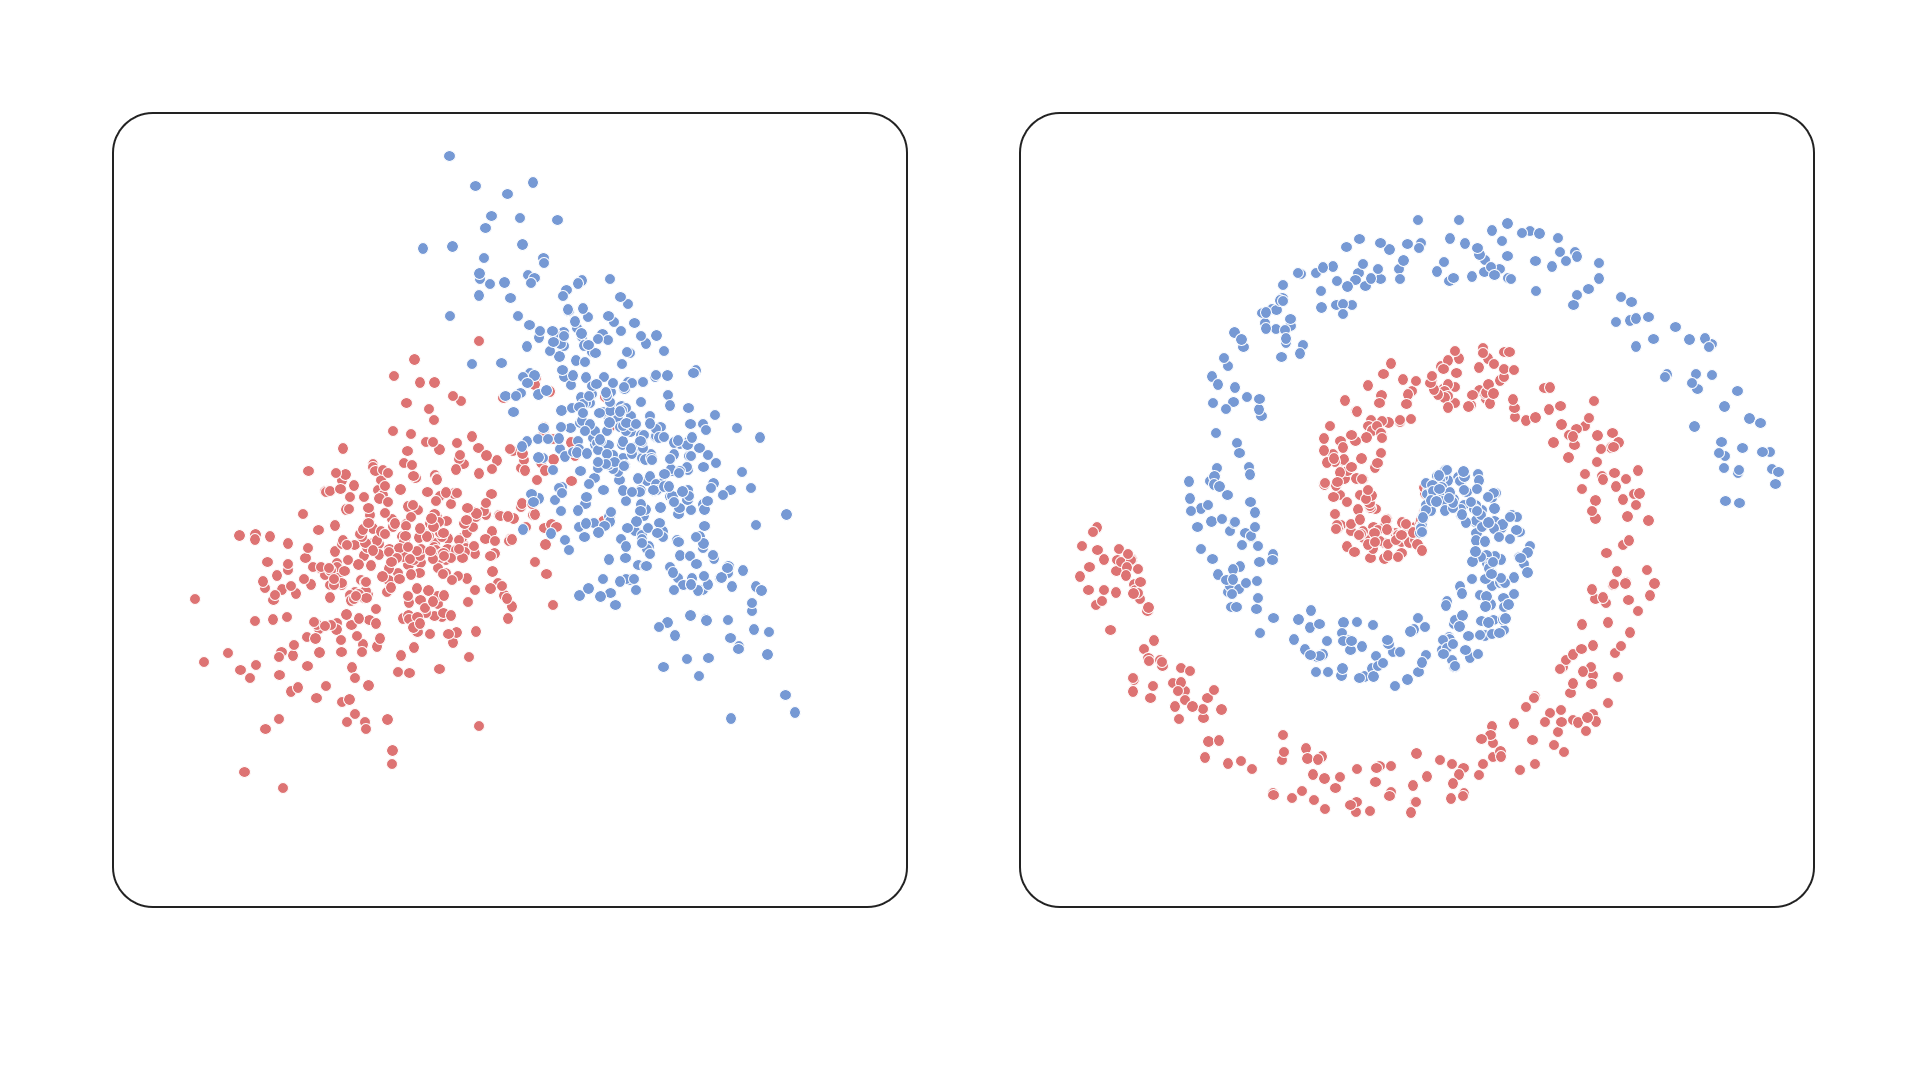
Download .pptx: examples/scatter.pptx
Example 3. Histograms
Bar-style visualizations built using rectangles – this example illustrates how to construct a histogram layout with custom colors (examples/histogram.py).
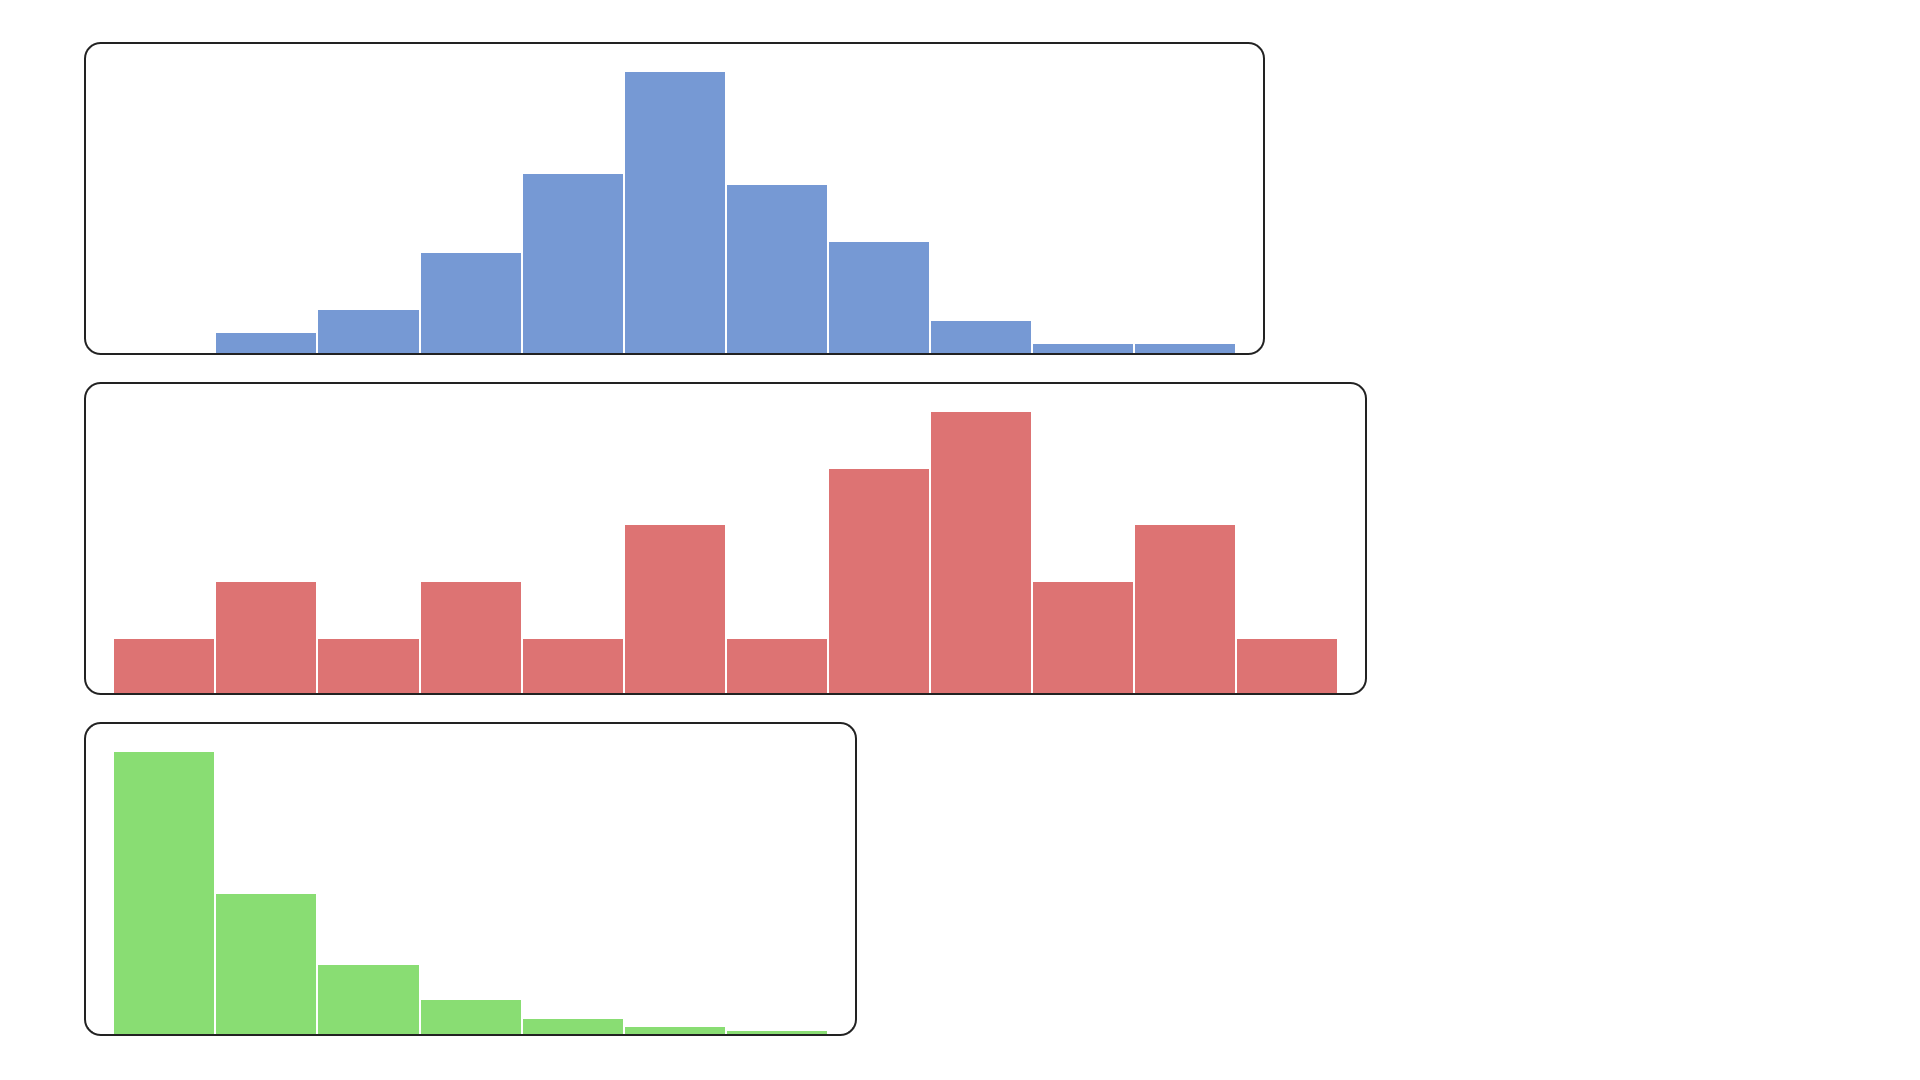
Download .pptx: examples/histogram.pptx
Example 4. Polygons split
A more advanced use case – splitting polygonal shapes by lines. Useful for illustrating partitions or segmentations (examples/polygons.py).

Download .pptx: examples/polygons.pptx
Example 5. Font families and text styles
This example demonstrates how to use different font families and styles in TextBox shapes. It shows how to customize font size, alignment, color, and the font family.
(examples/text_boxes.py).
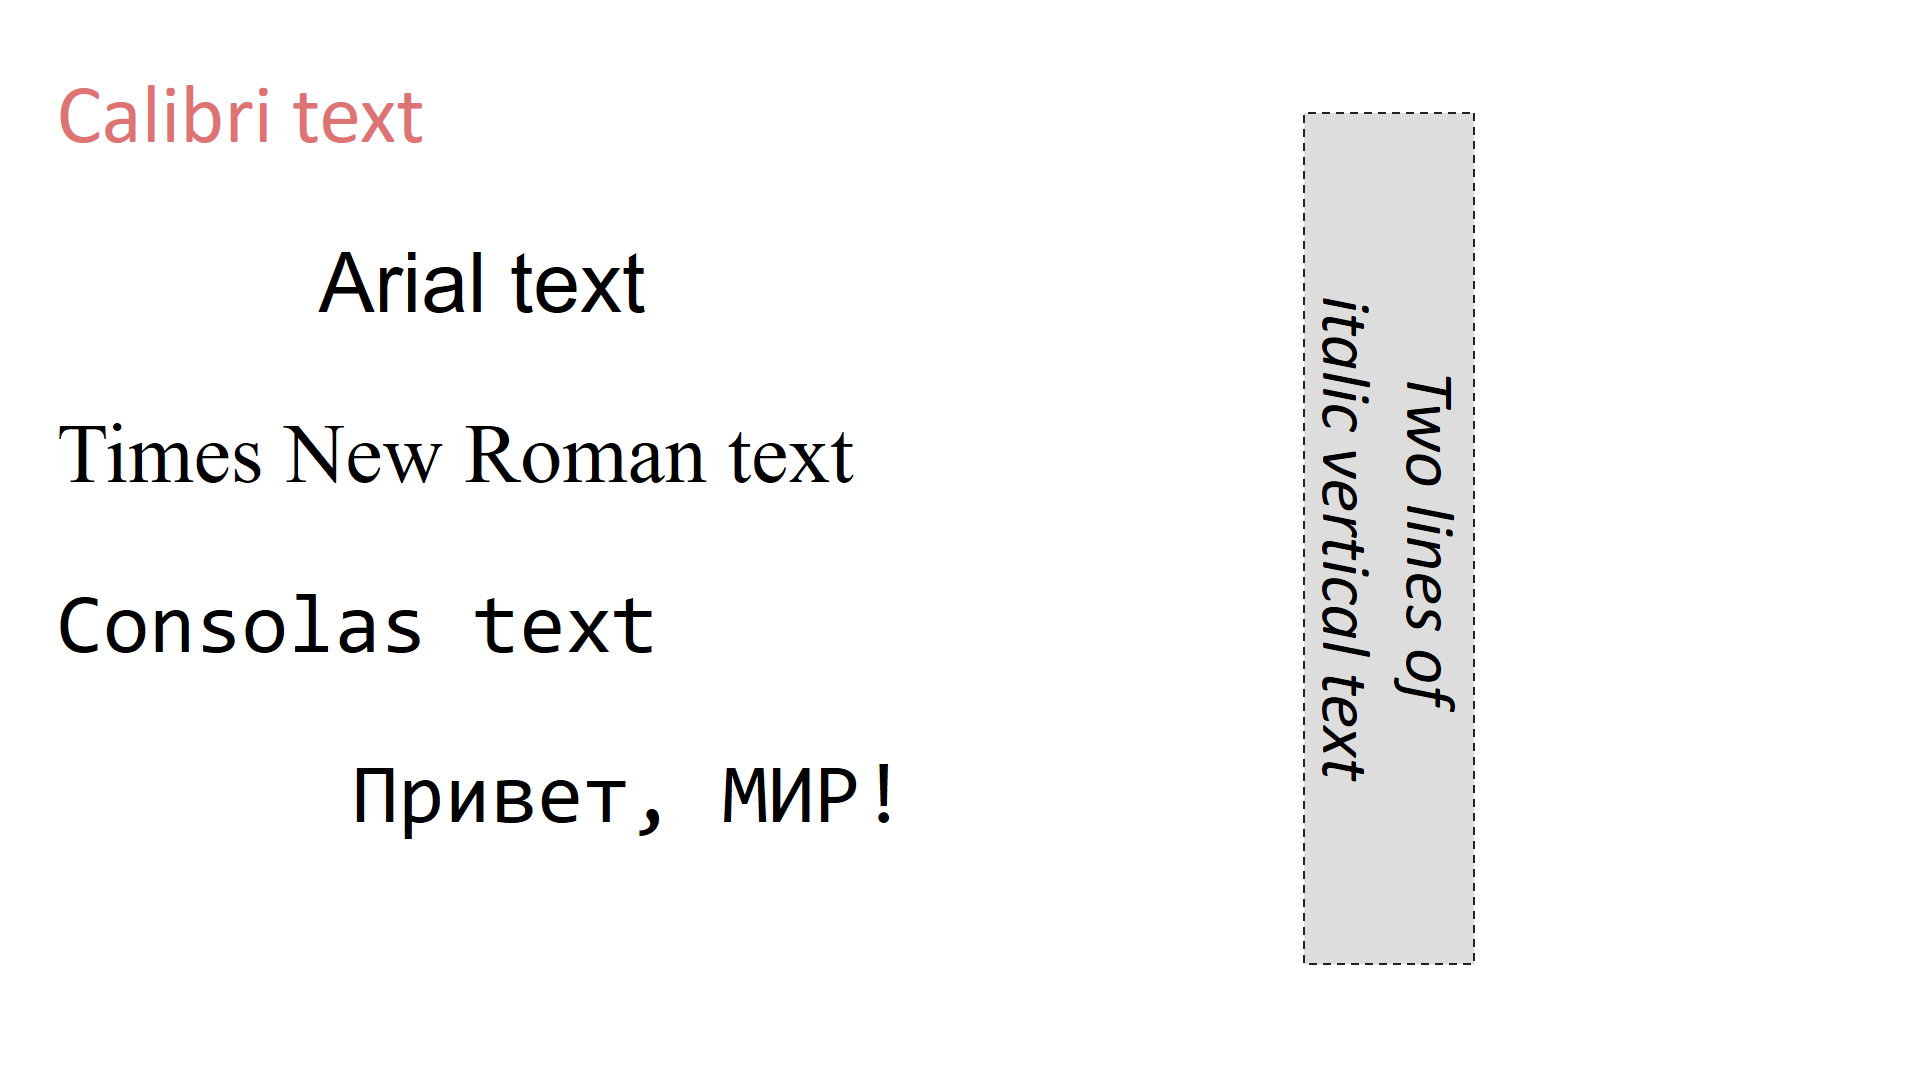
Download .pptx: examples/text_boxes.pptx
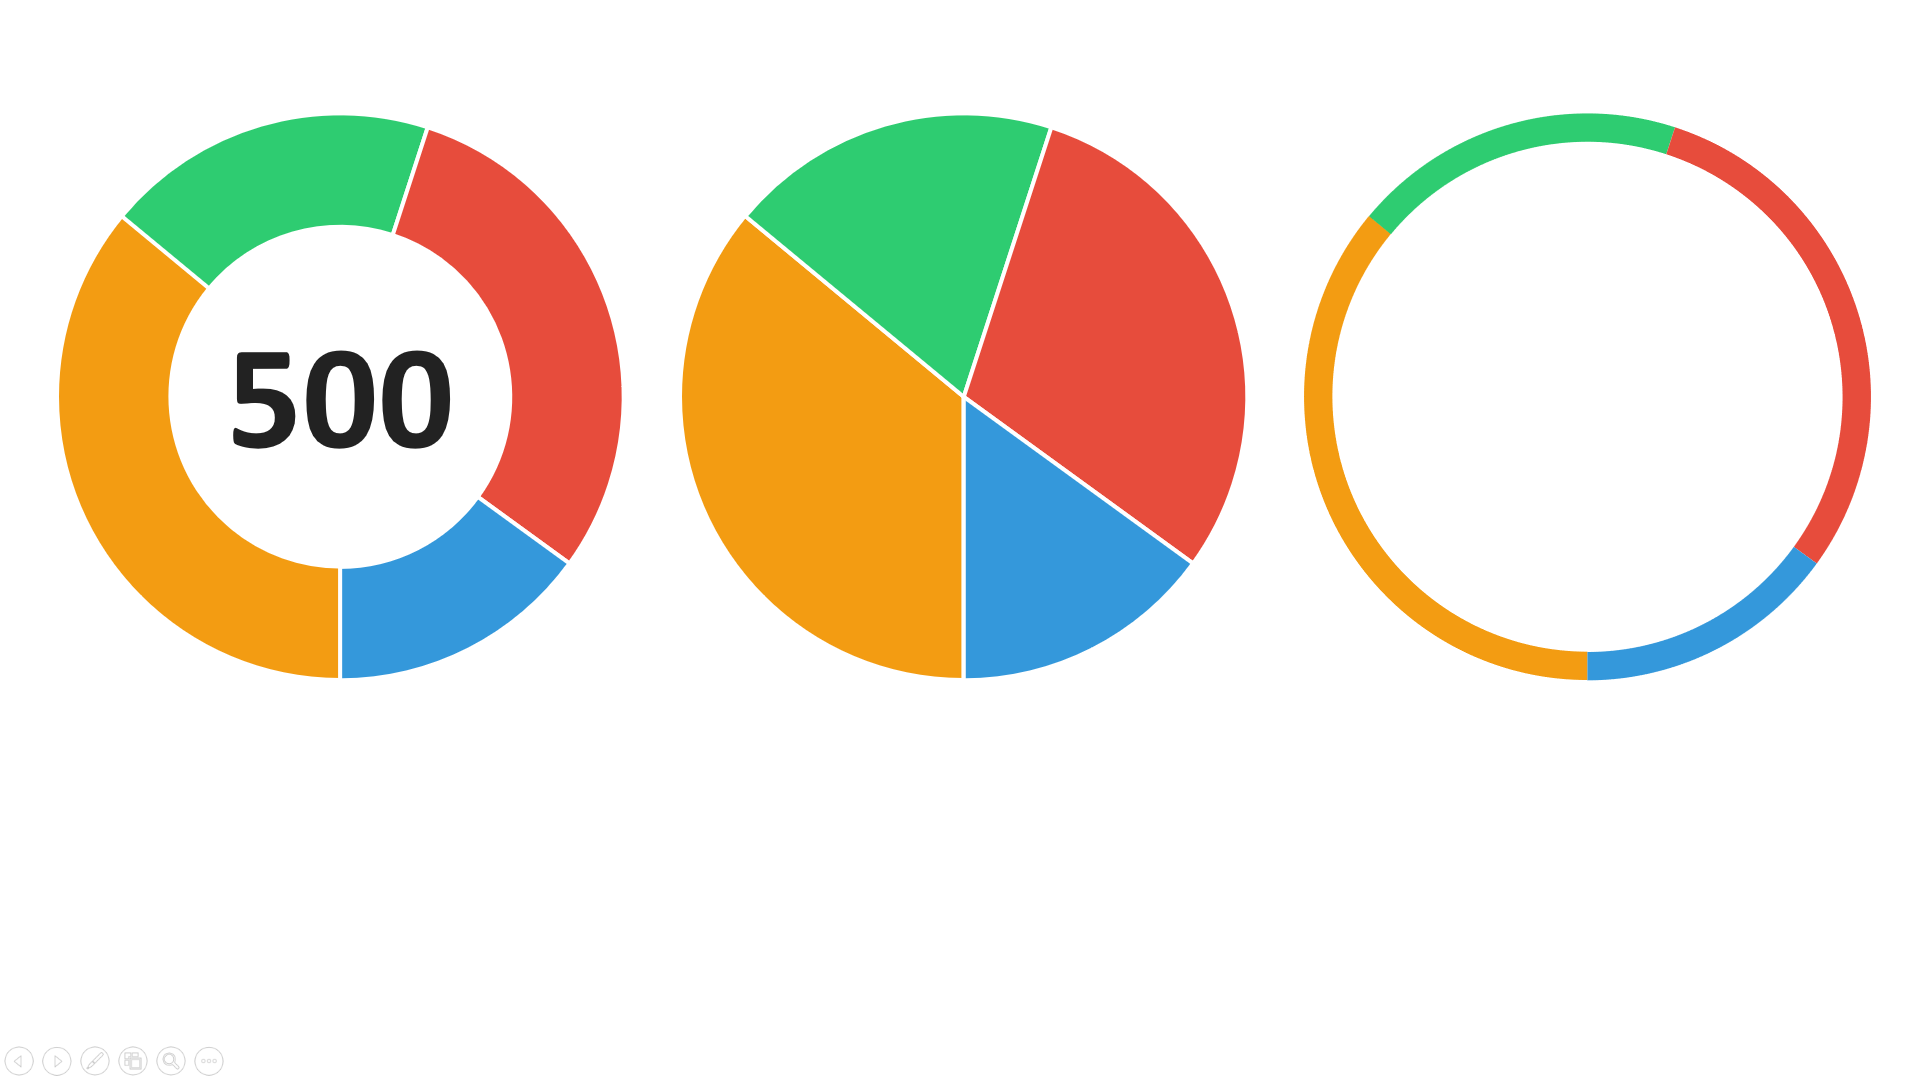
Example 6. Donut charts example
This example demonstrates how to use DonutChart from charts module
(examples/charts/donut_chart.py).
Download .pptx: examples/charts/donut_chart.pptx
Changelog
See CHANGELOG.md for version history.
License
Licensed under the MIT License. Feel free to use it in your projects.
Contributing
Pull requests, issues, and feature ideas are very welcome!
Release history Release notifications | RSS feed


Download files
Download the file for your platform. If you're not sure which to choose, learn more about installing packages.
Source Distribution
Built Distribution
Filter files by name, interpreter, ABI, and platform.
If you're not sure about the file name format, learn more about wheel file names.
Copy a direct link to the current filters
File details
Details for the file pptx_shapes-0.2.0.tar.gz.
File metadata
- Download URL: pptx_shapes-0.2.0.tar.gz
- Upload date:
- Size: 21.1 kB
- Tags: Source
- Uploaded using Trusted Publishing? No
- Uploaded via: twine/6.1.0 CPython/3.10.0
File hashes
| Algorithm | Hash digest | |
|---|---|---|
| SHA256 |
279c76b71bf7a334a76ccbbf6b4269d9805d8fef2be247ef8688f89574182351
|
|
| MD5 |
a6070068fc91d7e62042eb9be8093703
|
|
| BLAKE2b-256 |
11682a63332d86b11138810d7c2deea23021aecc27be47f0e16a87aabc8ca3b4
|
File details
Details for the file pptx_shapes-0.2.0-py3-none-any.whl.
File metadata
- Download URL: pptx_shapes-0.2.0-py3-none-any.whl
- Upload date:
- Size: 26.3 kB
- Tags: Python 3
- Uploaded using Trusted Publishing? No
- Uploaded via: twine/6.1.0 CPython/3.10.0
File hashes
| Algorithm | Hash digest | |
|---|---|---|
| SHA256 |
7e08bf6dbbe03295f9d0206d6fc788934d3e71a93f408277c98851fe1b616c2a
|
|
| MD5 |
b1a644c4a06a55fb83e46b4616f91d17
|
|
| BLAKE2b-256 |
a712463a2106de9e93f128b049b8b17a9974178cf415ac3cc6afc66309447968
|


