

Tell Claude Code which endpoint is slow. Get back a measured, verified fix.





Profyle traces the requests of your FastAPI, Flask, Django or Tornado app and gives Claude Code what it needs to find the bottleneck, fix your code and prove the fix by replaying the same request.
Quick start
1. Install, once per project
$ pip install profyle
$ profyle init
profyle init connects Claude Code to Profyle in this project. Commit the two files it
adds (.mcp.json and .claude/skills/) and your teammates only need pip install profyle.
2. Ask Claude Code
GET /orders is slow, can you fix it?
You don't have to start anything first: Claude starts your app with tracing if needed.
3. Get a measured, verified fix
GET /ordersnow takes about 17 ms warm, down from about 120 ms.Root cause: an N+1 query.
list_orders(main.py:22) calledget_customer(main.py:17) once per order: 50 calls, 107 ms, 90% of the request.Change:
get_customersfetches all the names with oneWHERE id IN (...)query.
Before After Median request time 119.9 ms 16.9 ms Lookup calls 50 1 Behavior check: status 200 and an identical response body before and after.
A real Claude Code session on a project with no Profyle code and the server stopped.
What Claude did between steps 2 and 3
- Checked the setup with
doctor: nothing traced yet. - Found the dev server command in the README and, with your OK, started it with
profyle run uvicorn main:app --reload, which traces without code changes. - Called the endpoint and replayed it 3 times for a warm baseline (the first request of a server includes warm-up).
- Read the trace digest:
list_orders → get_customer ×50, 90% of the request. - Fixed the code, waited for the reload, replayed the same request and compared the traces: 7× faster, same status, same response body.
Without Claude Code
Start your dev server through profyle run, and every request tells you where its time
went:
$ profyle run uvicorn main:app --reload
profyle ▸ GET /orders 123.8 ms · #2 · repeated: list_orders → get_customer ×50 (87.1%)
Then dig into any trace:
$ profyle start           # browse the traces in a web UI, with Perfetto
$ profyle analyze 2       # the bottleneck digest of trace #2
$ profyle replay 2        # send the same request again and compare
Good to know
- Requirements: Python 3.10+.
- Which environment Claude uses:
profyle initstarts the MCP server withuv runorpoetry runin projects that use them, and withprofylefrom yourPATHotherwise. In that case open Claude Code with your project's environment activated, or edit the command in.mcp.json. - Many projects? Install the Claude Code plugin once instead of running
profyle initin each:claude plugin marketplace add vpcarlos/profyle && claude plugin install profyle@profyle(setPROFYLE_COMMAND=/path/to/.venv/bin/profyleifprofyleis not on yourPATH). - Remove it:
profyle uninstall, thenpip uninstall profyle(see Uninstall).
Add tracing to your app
Without code changes: profyle run
Put profyle run in front of the command that starts your dev server:
$ profyle run uvicorn main:app --reload            # FastAPI, Starlette, any ASGI app
$ profyle run flask --app app run --debug          # Flask
$ profyle run python manage.py runserver           # Django (WSGI)
$ profyle run gunicorn -k tornado app:app          # Tornado (or: profyle run python app.py)
$ profyle run uvicorn mysite.asgi:application      # Django (ASGI)
Each request prints its main finding in the console:
profyle ▸ tracing requests of `uvicorn main:app --reload` → .profyle/profile.db. Each request prints a summary line here; …
profyle ▸ GET /orders 543.3 ms · #1 · repeated: getblock → _tokenize ×44 (64.2%) · first request, includes warm-up
profyle ▸ GET /orders 123.8 ms · #2 · repeated: list_orders → get_customer ×50 (87.1%)
profyle run adds the middleware when your framework loads: FastAPI/Starlette, Flask,
Django and Tornado under any server, plus any other ASGI framework (Litestar, Quart, …)
served by uvicorn. For other combinations, add the middleware yourself.
With a middleware
FastAPI / Starlette
from fastapi import FastAPI
from profyle.fastapi import ProfyleMiddleware

app = FastAPI()
app.add_middleware(ProfyleMiddleware)                      # trace every request
# app.add_middleware(ProfyleMiddleware, pattern="/users*") # or only some paths
Flask
from flask import Flask
from profyle.flask import ProfyleMiddleware

app = Flask(__name__)
app.wsgi_app = ProfyleMiddleware(app.wsgi_app)
Django
# settings.py
MIDDLEWARE = [
    "profyle.django.ProfyleMiddleware",  # first, so it traces the other middlewares too
    ...
]
Tornado
import tornado.web
from profyle.tornado import instrument

app = instrument(tornado.web.Application([(r"/orders", OrdersHandler)]))
Works with Tornado's own server and with gunicorn's tornado worker.
Any ASGI or WSGI framework (Litestar, Quart, Falcon, Bottle, Pyramid…)
from profyle.asgi import ProfyleMiddleware   # ASGI apps
app = ProfyleMiddleware(app)

from profyle.wsgi import ProfyleMiddleware   # WSGI apps
app = ProfyleMiddleware(app)
An explicit middleware takes precedence over profyle run, so you can keep it and
still use profyle run.
What gets traced
- The whole request: the middlewares, your view, and the code your framework runs in
worker threads (sync FastAPI endpoints, Django under ASGI,
run_in_executor). Responses streamed by WSGI apps (Flask...) are traced until the body has been sent. - One request at a time: VizTracer records one trace per process. A request that arrives while another one is traced is served normally but not traced (the console says so). Profyle is meant for requests you make one at a time while developing.
- No waiting: a trace is saved in a background thread after the response is sent; a request arriving while the previous trace is still being saved waits a moment for it.
Configuration
Every integration reads the same settings. Each one comes from, in order of priority:
an environment variable, the code (middleware arguments or Django PROFYLE_* settings),
[tool.profyle] in pyproject.toml, or the default. profyle doctor shows the values
in use and where each one comes from.
| Setting | Environment variable | Default | Description |
|---|---|---|---|
enabled |
PROFYLE_ENABLED |
true |
Trace requests at all |
pattern |
PROFYLE_PATTERN |
all paths | Only trace paths matching this glob, e.g. /api/* |
max_stack_depth |
PROFYLE_MAX_STACK_DEPTH |
-1 (unlimited) |
Maximum call stack depth to record |
min_duration |
PROFYLE_MIN_DURATION |
0 |
Drop function calls shorter than this, in microseconds |
console |
PROFYLE_CONSOLE |
true |
Print one line per traced request |
capture_secrets |
PROFYLE_CAPTURE_SECRETS |
false |
Store auth headers and cookies with the request instead of [redacted] (see Replay safety) |
replay_allow_remote |
PROFYLE_REPLAY_ALLOW_REMOTE |
false |
Allow replaying requests to non-local hosts |
# pyproject.toml
[tool.profyle]
pattern = "/api/*"
max-stack-depth = 30
PROFYLE_DB chooses the trace database (see Trace database); it is
an environment variable only, since it decides where everything else is read from.
Browse traces
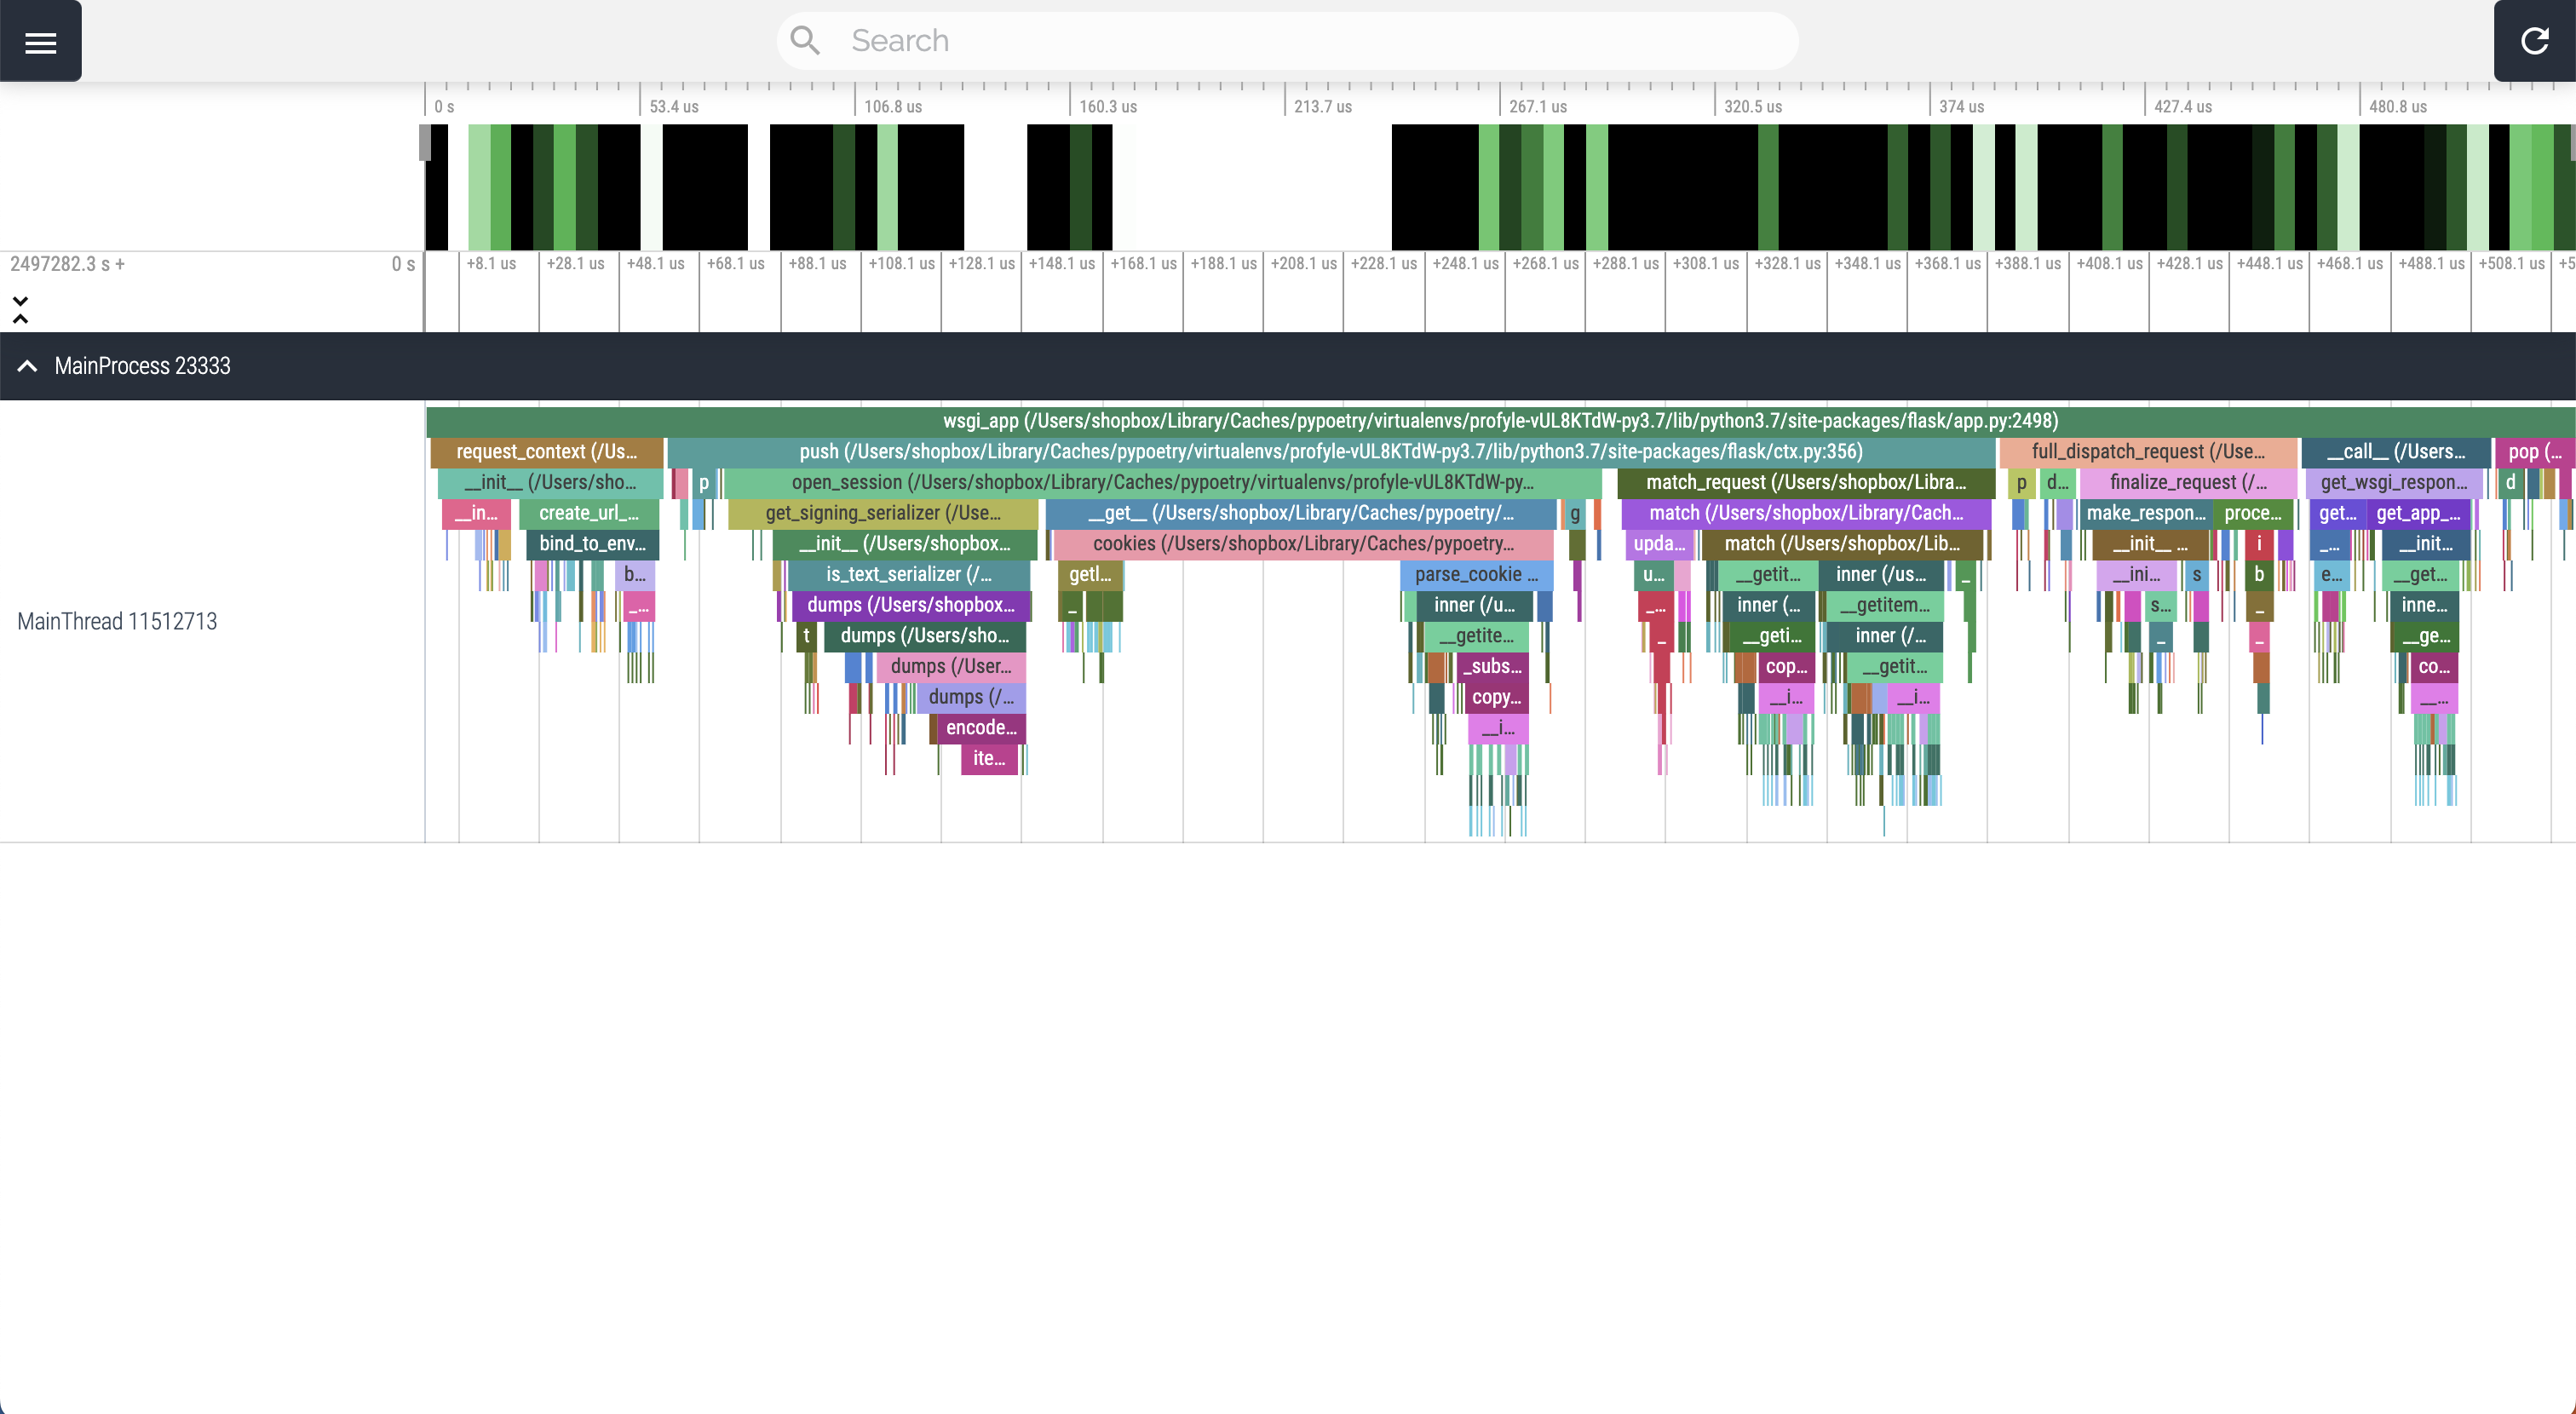
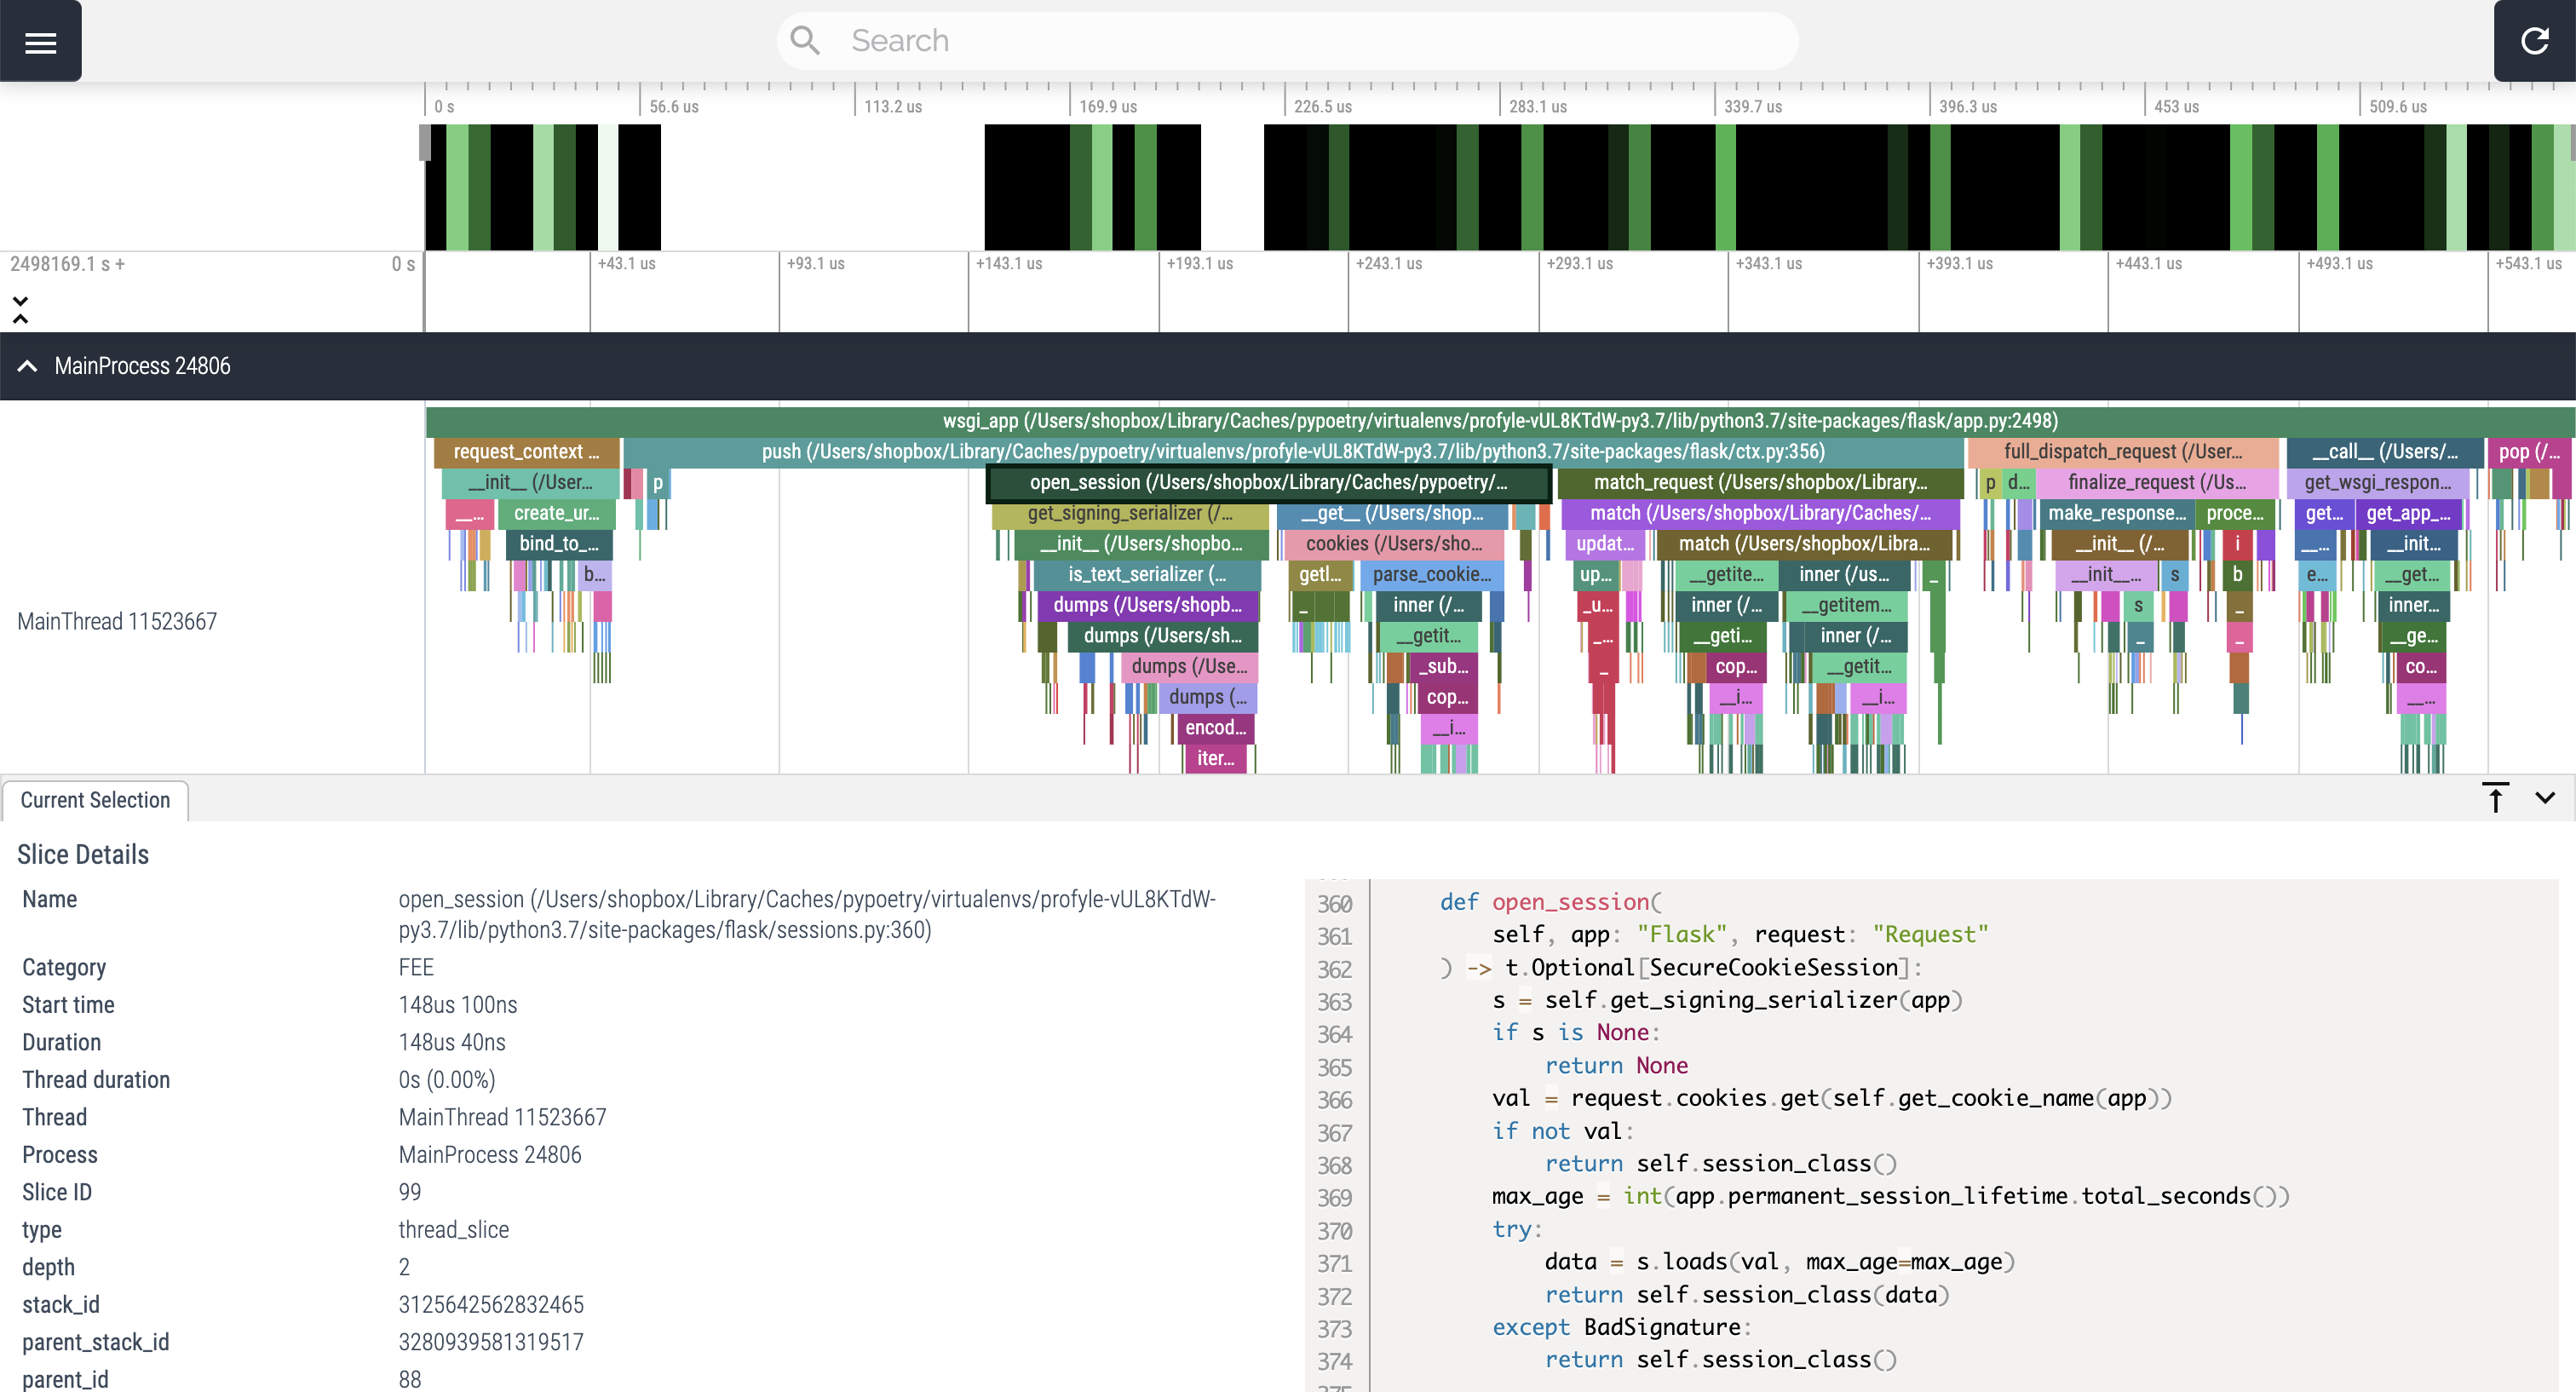
profyle start opens a web UI listing your traces with their main finding; open one to
explore it in Perfetto, with source code, arguments and return values.
$ profyle start
INFO:     Uvicorn running on http://127.0.0.1:8000 (Press CTRL+C to quit)
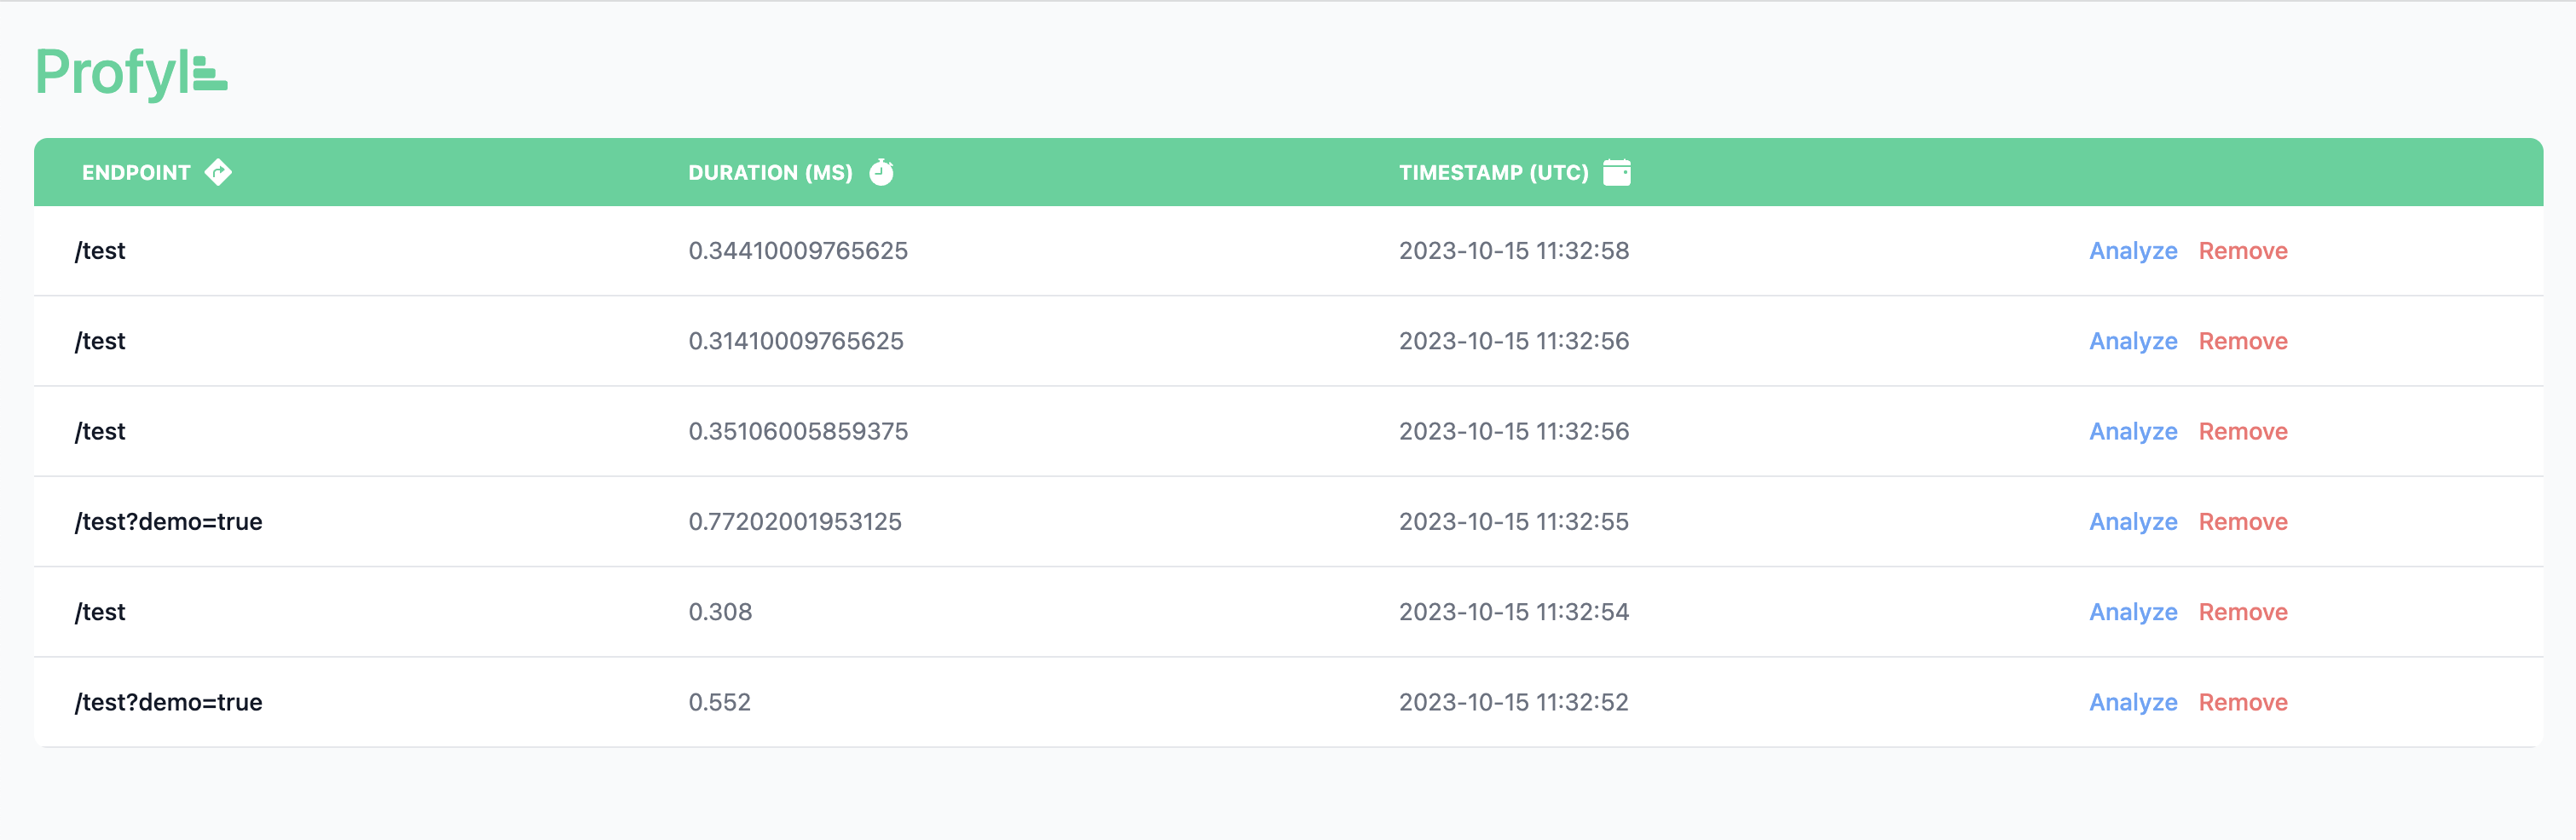
Profyle stands on the shoulders of giants: VizTracer and Perfetto. Traces include threads and async code.
How Claude works with your traces
The skill makes Claude:
- run
doctorand, if needed, start your app withprofyle run; - take a warm baseline by replaying the request (
replay_request); - read the trace digest: critical path per thread, top self time, your own code, I/O
wait and repeated calls from the same caller (N+1 candidates), each with
file:line. A traced request easily holds 100k+ VizTracer events; the digest is a few KB; - drill into the suspicious functions and read your code;
- fix it, replay the request and
compare_tracesbefore/after, checking that the status code and the response body did not change; - report root cause, change and measured improvement.
| MCP tool | |
|---|---|
doctor |
Checks the trace database, recorded requests and that the app is running |
slowest_endpoints |
Endpoints ranked by p95, with the main finding of a typical trace |
list_traces |
Recorded traces with their main finding, filterable by name and duration |
analyze_trace |
Bottleneck digest of a trace |
get_call_details |
Callers, callees, slowest calls with args and return values |
get_function_source |
Source of a function as it was when traced |
replay_request |
Send the traced request again, return the new traces |
compare_traces |
Before/after deltas, plus status and response body verdict |
Digests are precomputed
Each trace's digest and a one-line main finding (e.g. repeated: list_orders → get_customer ×100 (83%)) are stored next to it. They are computed outside your app's
request path: by a separate console process when console is on, by the MCP server in
the background, or by any analysis. Listings in the MCP tools and in the web UI show the
finding, and analyzing a trace again is instant.
Same speed-up, same data
Each trace keeps a fingerprint of the response body, never the body itself: a hash of the
canonical body and, for JSON, a hash of its structure (keys, value types, list lengths).
Replays and compare_traces report the body as identical, same structure, values
differ (e.g. timestamps) or DIFFERENT, so a "fix" that returns less data is caught.
Every integration records it, for bodies up to 2 MB.
Replay safety
- Profyle stores the request behind each trace (method, path, headers, body up to 64 KB,
response status).
Authorization,Cookie, API key and CSRF headers are stored as[redacted]unlesscapture_secretsis on; pass credentials when replaying instead (-Hin the CLI,headersin the MCP tool). - Only local hosts are replayed unless
replay_allow_remoteis on. POST/PUT/PATCH/DELETEare only replayed with explicit permission (--allow-unsafe/allow_unsafe_method); the skill asks you first.
Trace database
Traces are stored in <project>/.profyle/profile.db, where <project> is the closest
parent of the working directory with a pyproject.toml, setup.py, manage.py,
requirements.txt or .git. The app, the CLI and the MCP server all find the same
file. Set PROFYLE_DB=/path/to/profile.db to use another location.
Versions before 0.4 stored traces inside the installed package; profyle doctor warns if
it still finds traces there.
CLI commands
| Command | What it does |
|---|---|
profyle init |
Set up Claude Code for the project: the MCP server in .mcp.json (other servers are kept) and the fix-slow-endpoint skill. Running it again updates them. |
profyle run <command> |
Run the command that starts your app, with tracing and no code changes |
profyle doctor |
Check that traces are recorded, can be replayed, and the app is running |
profyle analyze [id] |
Print the bottleneck digest of a trace (the newest one by default) |
profyle replay <id> |
Send the request of a trace again and report the new traces |
profyle start |
Browse the traces in the web UI (--port, --host; default 127.0.0.1 on a free port) |
profyle info |
Where the traces are stored and how much space they use |
profyle clean |
Delete all traces |
profyle uninstall |
Remove Profyle from the project (see below) |
profyle mcp |
Run the MCP server over stdio (Claude Code starts it for you) |
profyle replay options:
| Option | Default | Description |
|---|---|---|
--times N |
1 | Number of replays (up to 10) |
--base-url URL |
recorded host | Where the app listens, e.g. http://127.0.0.1:8000 |
-H, --header 'Name: value' |
Extra header, repeatable, e.g. 'Authorization: Bearer x' |
|
--allow-unsafe |
Allow POST/PUT/PATCH/DELETE |
$ profyle doctor
✓ Database /home/me/shop/.profyle/profile.db (project root found from the working directory): 12 traces, newest #12 GET /orders at 2026-10-03 21:55:30 UTC.
• App: FastAPI traced via `profyle run` (pid 4242, running; Profyle 0.4.0, Python 3.12.11).
• Configuration: enabled = True (default); pattern = None (default); ...
✓ Requests are recorded, so they can be replayed.
✓ The app is running at http://127.0.0.1:8000.
• Replay: replay_allow_remote = False (default).

Ready.
Uninstall
profyle uninstall removes the profyle entry from .mcp.json (other servers are
kept), the skill, and the traces in .profyle/. It asks before deleting traces: pass
--yes to skip the question or --keep-traces to keep them. Then remove the package:
$ profyle uninstall
Delete all traces in /home/me/shop/.profyle? [y/N] y
Removing Profyle from /home/me/shop
  .mcp.json                                     removed
  .claude/skills/fix-slow-endpoint              removed
  .profyle                                      removed
$ pip uninstall profyle     # or `uv remove profyle`, which also removes its dependencies
If you installed the Claude Code plugin instead of running profyle init:
claude plugin uninstall profyle.
Limitations
- One request is traced at a time per process (see What gets traced).
- Tracing adds about 1 µs per function call: functions called very often look slower than they are untraced. Waits (sleep, network, database) are measured accurately.
- A WSGI response body that is never read (some test clients) keeps its trace open until the next traced request or until the process exits.
- VizTracer 1.1.1 has two thread-safety bugs that can crash the process. Profyle works
around both, but one remains possible on Python 3.12+ when another thread is inside a
slow
__repr__(for example one that queries a database) at the moment a trace ends. Details in docs/ROADMAP.md.
Contributing
Contributions are welcome! See CONTRIBUTING.md for the development setup and guidelines, and CHANGELOG.md for what changed in each release. Please report security issues privately as described in SECURITY.md.
License
Profyle is released under the MIT License.
1 maintainer

Metadata
1 maintainer
Release files for profyle 0.4.0
For a detailed explanation of source distributions (sdists) and built distributions (wheels), please see the package formats documentation.
Source distribution (sdist)
| File | Size | Uploaded | |
|---|---|---|---|
| profyle-0.4.0.tar.gz | 358.1 kB | Details |
Built distribution (wheel)
| File | Interpreter | ABI | Platform | Reset |
|---|---|---|---|---|
| profyle-0.4.0-py3-none-any.whl | Python 3 | none | any | Details |
Total release size: 548.1 kB
Release files / profyle-0.4.0.tar.gz
| Download URL | profyle-0.4.0.tar.gz |
|---|---|
| Size | 358.1 kB |
| Tags | Source |
|
SHA-256 checksum How to use checksums |
d6feb50467c93a688371d8436a1ee4ad2d899f60fd6162924cac697888cd54c1
|
|
BLAKE2b-256 checksum How to use checksums |
67fa86522763ee405abc48042ed2bfe77b8a24044b0514c4d8d31b7ff4cb922a
|
| Upload date | |
|
Uploaded using Trusted Publishing? What is trusted publishing? |
Yes |
| Uploaded via |
twine/7.0.0 CPython/3.13.14
|
Provenance
Provenance describes where a file came from. On PyPI, provenance is shared via attestations, which provide a verifiable record of the build or publishing details. View details, limitations and caveats.


PyPI Publish Attestation
PyPI verified that this artifact, at this checksum, originated from the publisher listed below.
Signed by GitHub Actions, verified by PyPI on Oct 5, 2026.
Transparency logRelease files / profyle-0.4.0-py3-none-any.whl
| Download URL | profyle-0.4.0-py3-none-any.whl |
|---|---|
| Size | 190.0 kB |
| Tags | Python 3 |
|
SHA-256 checksum How to use checksums |
0a06d9b4a1fdc5f2260b1af45942d3edc165fa7f0da52ffebcd8652ae803fac1
|
|
BLAKE2b-256 checksum How to use checksums |
f8d913f27ad7bfb96a7fcd915da2b1411c2ac1188a6e0ccecd070a47a13490f7
|
| Upload date | |
|
Uploaded using Trusted Publishing? What is trusted publishing? |
Yes |
| Uploaded via |
twine/7.0.0 CPython/3.13.14
|
Provenance
Provenance describes where a file came from. On PyPI, provenance is shared via attestations, which provide a verifiable record of the build or publishing details. View details, limitations and caveats.
PyPI Publish Attestation
PyPI verified that this artifact, at this checksum, originated from the publisher listed below.
Signed by GitHub Actions, verified by PyPI on Oct 5, 2026.
Transparency log













