Prometheus metrics exporter for NETGEAR switches of the Smart Managed Plus series.
Project description
prosafe_exporter_python
Open metrics exporter for NETGEAR switches of the Smart Managed Plus series to provide data to databases such as Prometheus or InfluxDB.
What is the purpose?
NETGEAR switches of the Smart Managed Plus series do not provide a standards conform interface for providing statistics of traffic and other information. There is no support for monitoring protocols such as SNMP. Still these switches are deployed in large numbers in professional and private environments where monitoring of the switches is highly desired. A common solution for monitoring is to store the data in a Prometheus database and visualize and alert with tools such as Grafana. prosafe_exporter_python provides a tool that colelcts the data from the switches webinterface and provides it using the OpenMetrics format that can be directly used in Prometheus or Influx scrape jobs.
Exported Metrics
| metric | description | labels |
|---|---|---|
| prosafe_switch_info | Information about the switch exposed as labels | hostname, product_name, switch_name, serial_number, mac_adresse, bootloader_version, firmware_version, dhcp_mode, ip_adresse, subnetmask, gateway_adresse |
| prosafe_receive_bytes_total | Incoming transfer in bytes | hostname, port |
| prosafe_transmit_bytes_total | Outgoing transfer in bytes | hostname, port |
| prosafe_error_packets_total | Transfer error in packets | hostname, port |
| prosafe_link_speed | Link speed in Mbps | hostname, port |
| prosafe_max_mtu* | Maximum MTU | hostname, port |
* not available in all firmware versions
Usage
Setup a config.yml
global:
  retrieve_interval: 20.0
  retries: 10
  host: "0.0.0.0"
  port: 9493
switches:
  - hostname: "192.168.0.100"
    password: "password123"
  - hostname: "192.168.0.200"
    password: "password123"
Run with:
prosafe_exporter path/to/your/config.yml
In prometheus configure a scrape job, e.g. like this:
scrape_configs:
 - job_name: 'prosafe_switches'
    static_configs:
      - targets:
        - "prosafe_exporter:9493"
    metrics_path: /probe
    scrape_interval: 60s
In InfluxDB configure a scrape job like this: Influx scrape configuration
Docker
prosafe_exporter is also available as a stand-alone docker container from DockerHub
Query Example for Grafana
Outgoing data rate of port 1 on 192.168.0.123 is below.
rate(prosafe_transmit_bytes_total{instance="192.168.0.123", port="1"}[1m])
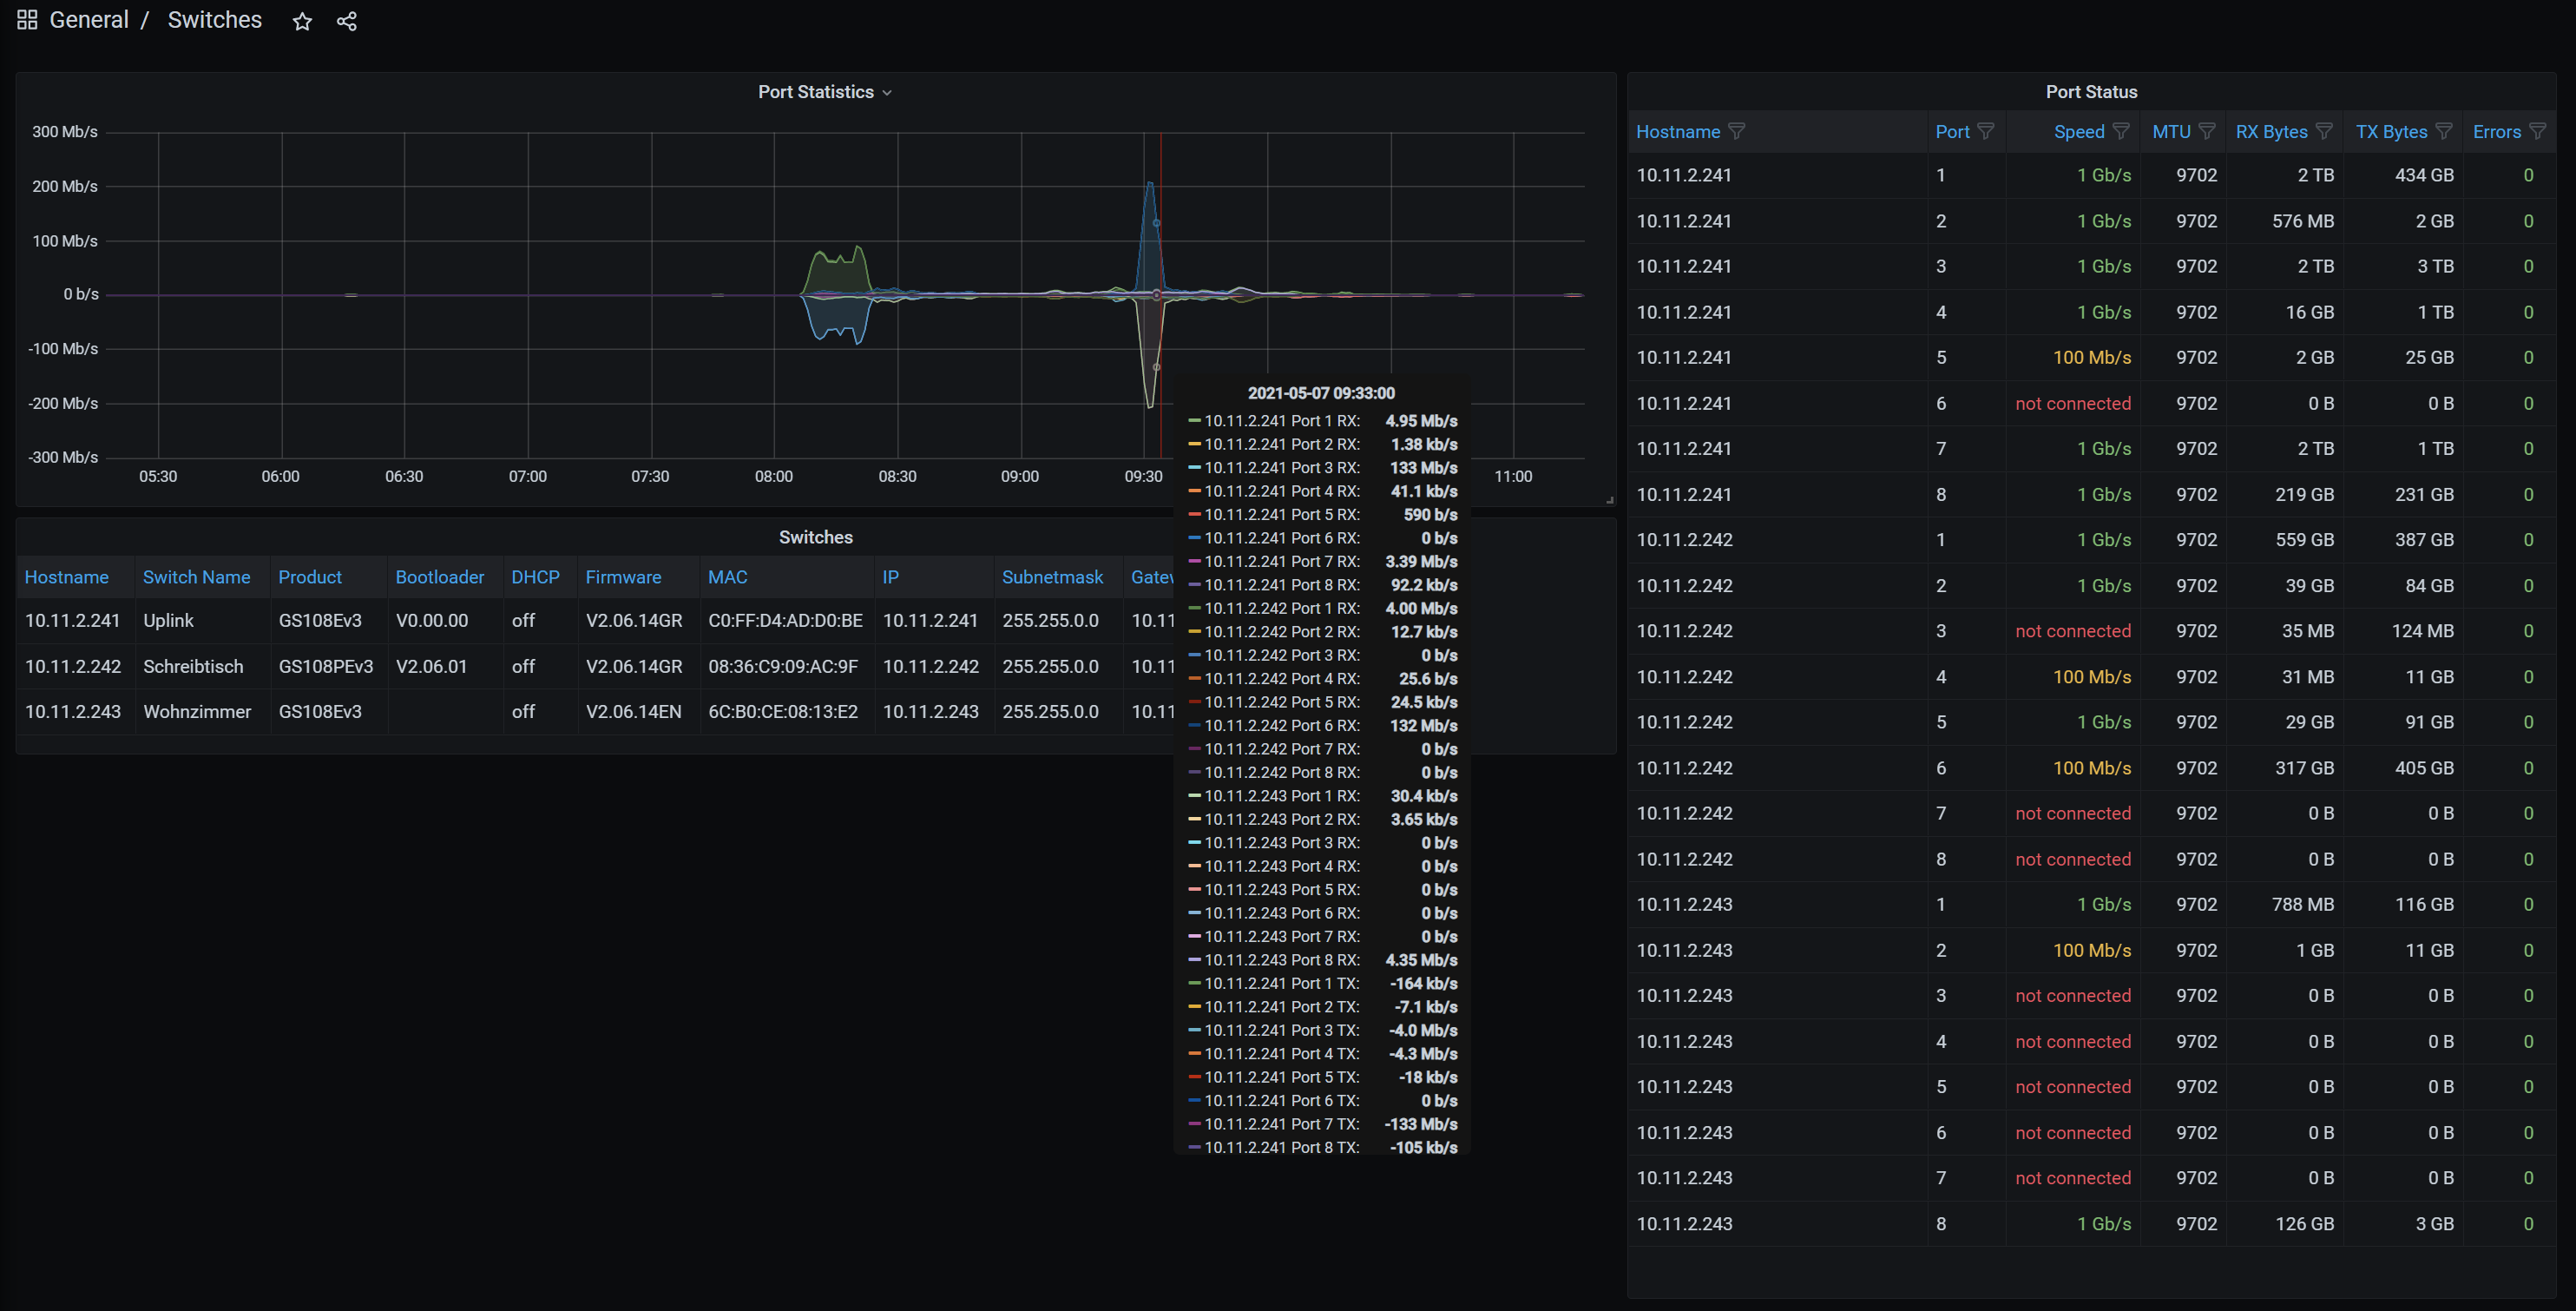
Grafana Screenshot
This is how the data could look like in Grafana with an example configuration:
Tested Switches
The following Switches are continously tested with real hardware:
- GS108Ev3
- GS108PEv3
Other Devices can be regression tested with prerecorded datasets. If you want to contribute with data from a switch not listed, please contact me or open an issue.
Tested Firmware
- V2.06.14GR
- V2.06.14EN
- V2.06.03EN
If you want to contribute with data from a switch not listed here, please contact me or open an issue.
Reporting Issues
Please feel free to open an issue at GitHub Issue page to report problems you found.
Known Issues
- May not work with older firmware, not all firmware versions are tested
- Does not work with Japanese firmware
Credits
Inspired by dalance/prosafe_exporter that is providing the same functionality using the ProSAFE Plus utility instead of the switches webinterface
Project details
Download files
Download the file for your platform. If you're not sure which to choose, learn more about installing packages.
Source Distribution
Built Distribution
Filter files by name, interpreter, ABI, and platform.
If you're not sure about the file name format, learn more about wheel file names.
Copy a direct link to the current filters
File details
Details for the file prosafe_exporter-0.4.7.tar.gz.
File metadata
- Download URL: prosafe_exporter-0.4.7.tar.gz
- Upload date:
- Size: 12.8 kB
- Tags: Source
- Uploaded using Trusted Publishing? No
- Uploaded via: twine/3.7.1 importlib_metadata/4.10.0 pkginfo/1.8.2 requests/2.26.0 requests-toolbelt/0.9.1 tqdm/4.62.3 CPython/3.10.1
File hashes
| Algorithm | Hash digest | |
|---|---|---|
| SHA256 |
47be607f0e1c51bc904ff39ecec9621b316f9e5f33bedbe165a6fefaae02df1c
|
|
| MD5 |
df28c98e6ccd39dae90ff8118607d647
|
|
| BLAKE2b-256 |
4312c30250b3b3c807a35bf6ee363acd0dfbbb39cc4d093644473ac171ec3f32
|
File details
Details for the file prosafe_exporter-0.4.7-py3-none-any.whl.
File metadata
- Download URL: prosafe_exporter-0.4.7-py3-none-any.whl
- Upload date:
- Size: 10.2 kB
- Tags: Python 3
- Uploaded using Trusted Publishing? No
- Uploaded via: twine/3.7.1 importlib_metadata/4.10.0 pkginfo/1.8.2 requests/2.26.0 requests-toolbelt/0.9.1 tqdm/4.62.3 CPython/3.10.1
File hashes
| Algorithm | Hash digest | |
|---|---|---|
| SHA256 |
5458fa5e5804f48f0bbb549c1e3ea2c41de14d7ad0564b60f3a395d0acebff18
|
|
| MD5 |
4e60a709e6ebbaa724521e792a790a65
|
|
| BLAKE2b-256 |
e370a08de1fbee635dec766b2e27f518b6d5e8e03f264de5aef877ffc3ee1f99
|


