
The QA agent for your vibe-coded app. Apache-2.0 MCP server.
Verified details
These details have been verified by PyPIProject links
GitHub Statistics
Maintainers

Project description
prufa-mcp — the QA agent for your vibe-coded app
Vibe-coded apps ship faster than anyone can review them. In June 2026 we audited 49 fresh Show HN launches — 38 had a critical bug on day one: a broken signup, a silent console error, analytics that never fired, a consent banner that did nothing.
Prufa is the agent that catches those before your users do. Point it at a URL and it audits the things humans skip when they're moving fast — broken flows, JS console errors, missing tracking, consent violations, security headers, mobile tap targets, accessibility — and hands back machine-verified findings, graded A–F. This repo is the open-source MCP server that wires that audit straight into your coding agent.
30-second demo
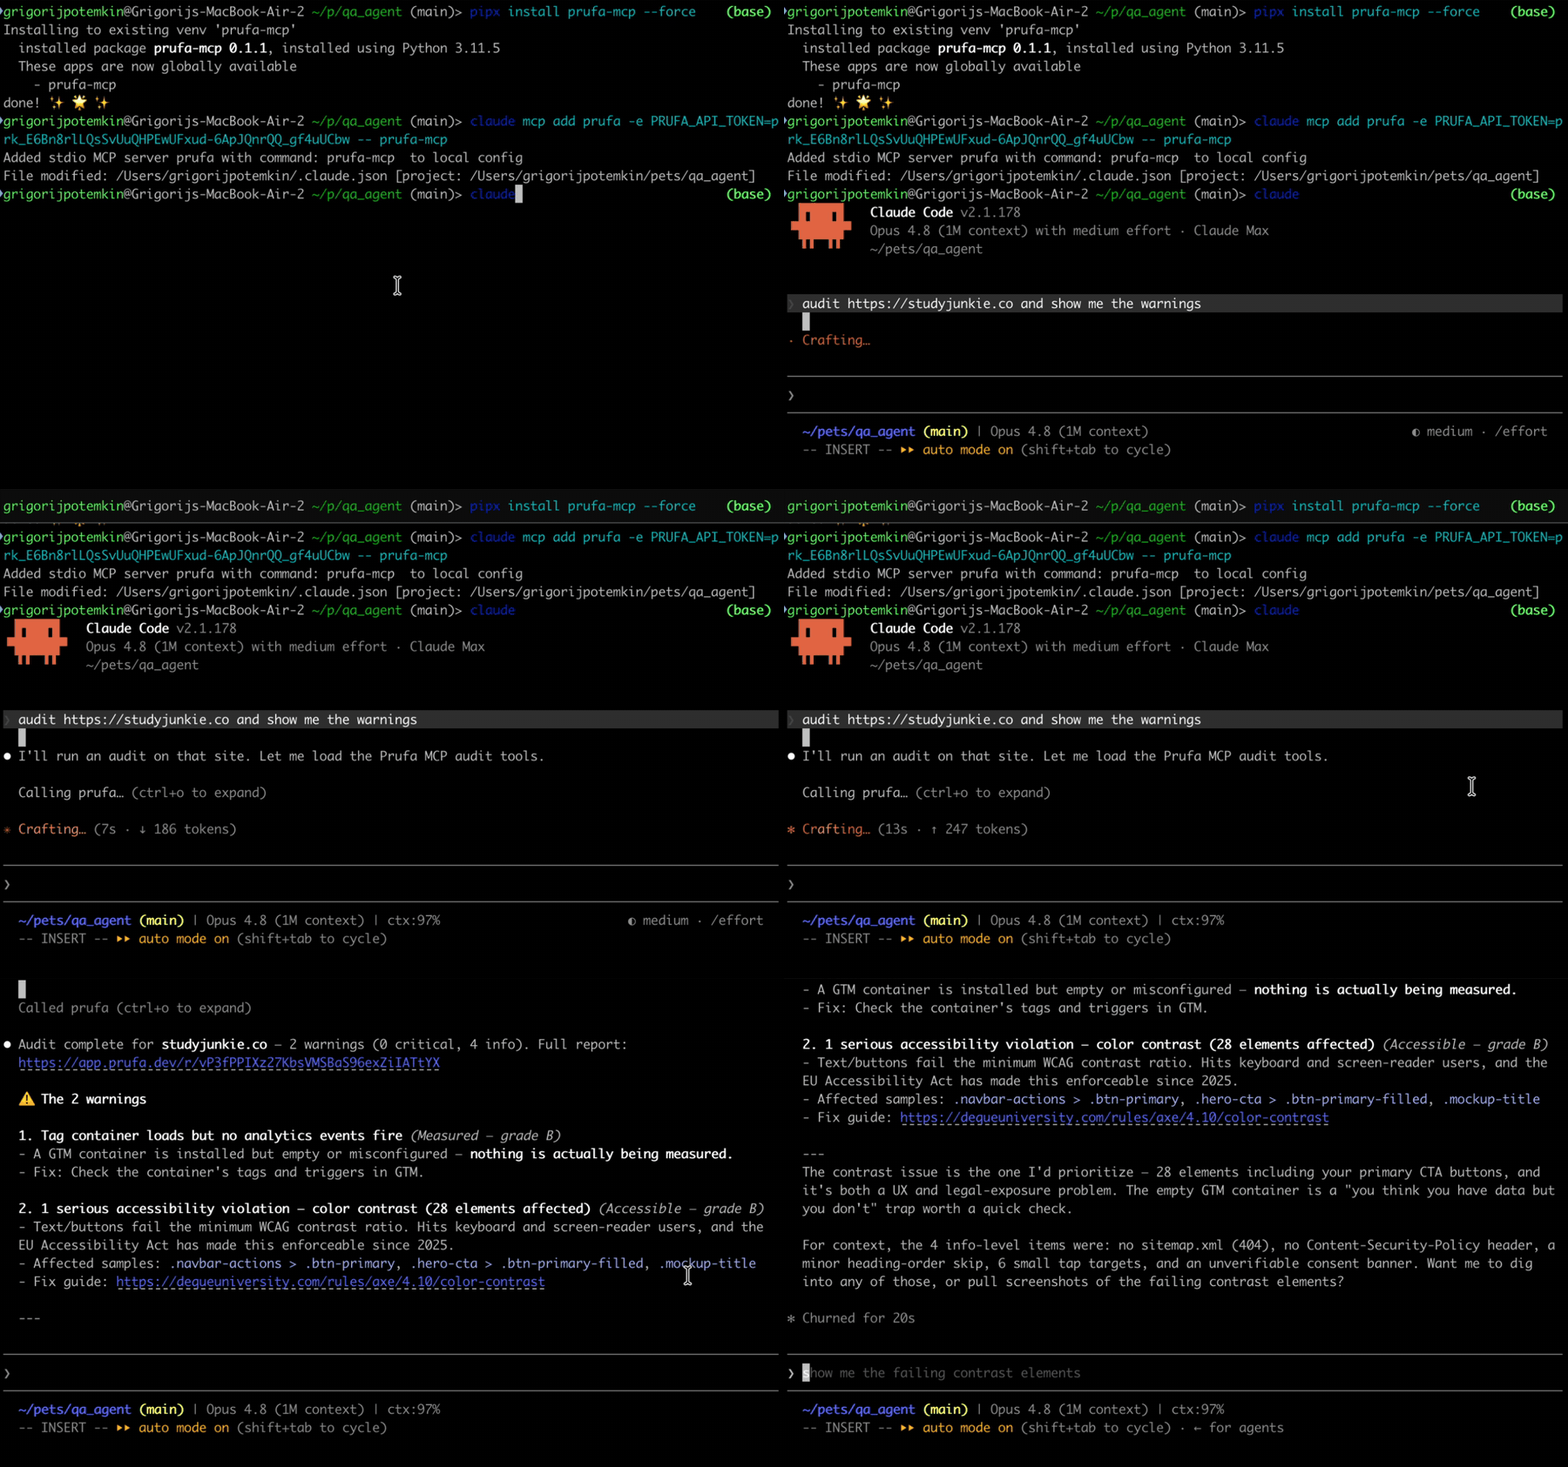
What an audit gives you
Ask your agent to audit https://yourapp.com and prufa_run_audit returns one
JSON report. Findings are grouped into graded sections, each finding carries a
severity, the impact (why it matters), and a fix hint. Real output,
trimmed:
{
  "url": "https://yourapp.com",
  "headline": "2 warnings found",
  "counts": { "critical": 0, "warning": 2, "info": 5 },
  "sections": [
    { "label": "Works",     "grade": "C", "counts": { "warning": 2, "info": 1 } },
    { "label": "Fast",      "grade": "A" },
    { "label": "Found",     "grade": "A" },
    { "label": "Compliant", "grade": "A" }
  ],
  "check_results": [
    {
      "check_id": "ux",
      "findings": [{
        "severity": "warning",
        "title": "2 javascript console error(s) during page load",
        "impact": "Errors at load time often mean broken features visitors never report.",
        "evidence": { "count": 2, "sample": [
          "Access to XMLHttpRequest at 'https://api.fontshare.com/...' blocked by CORS policy",
          "Failed to load resource: net::ERR_FAILED"
        ]}
      }]
    },
    {
      "check_id": "mobile",
      "findings": [{
        "severity": "warning",
        "title": "13 tap target(s) smaller than 24px",
        "impact": "Fingers are not cursors — undersized buttons mean mis-taps on exactly the elements you want pressed.",
        "fix_hint": "Give interactive elements at least 24x24px of hit area (WCAG 2.5.8)."
      }]
    },
    {
      "check_id": "security",
      "findings": [{
        "severity": "info",
        "title": "no Content-Security-Policy header",
        "impact": "Without a CSP, one injected script owns the page — and every third-party tag you load is trusted completely.",
        "fix_hint": "Start with a report-only CSP and tighten from real violation reports."
      }]
    }
  ],
  "report_url": "/r/G82RpzTi_zn-o71_XoMLCprP7uvCQP87"
}
report_url is a shareable HTML version of the same report. The full payload
also includes tracking, consent, seo/aeo, a11y, forms, and detected
user flows — see the OSS surface below.
Install
The package is on PyPI. Install it
globally with pipx (recommended — isolated venv, exposes the prufa-mcp
binary on your PATH) or into a project venv with pip:
# Recommended — global install, isolated venv
pipx install prufa-mcp

# Or, into your project venv
pip install prufa-mcp

# Pin a specific version with ==, e.g. pipx install prufa-mcp==0.1.3

# Verify the binary is on PATH
which prufa-mcp
# Should print something like: /Users/you/.local/bin/prufa-mcp
You also need a free Prufa API key. The first audit is free, no card required.
- Sign in at prufa.dev (Google OAuth)
- Create an API key from the dashboard
Wire into your agent
The MCP server runs as a stdio subprocess, spawned by your agent on first use.
The cleanest way to register it is claude mcp add (Claude Code's built-in
command — it writes the config to ~/.claude.json correctly, which the
~/.claude/mcp.json path does NOT).
Claude Code (recommended path)
# Get the absolute path of the binary (use whatever `which prufa-mcp` returned)
PRUFA_BIN=$(which prufa-mcp)

# Add the MCP server. The token stays out of your shell history.
read -s -p "Prufa API token: " PRUFA_TOKEN && echo
claude mcp add \
  --scope user \
  --env "PRUFA_API_TOKEN=$PRUFA_TOKEN" \
  prufa \
  -- "$PRUFA_BIN"
Restart Claude Code (config is read at startup), then verify:
/mcp
You should see prufa listed as Connected, with prufa_run_audit and
prufa_get_report as available tools.
Cursor / Cline / Continue (hand-edit .mcp.json)
In your project root or in ~/.config/Claude/ etc.:
{
  "mcpServers": {
    "prufa": {
      "command": "/Users/you/.local/bin/prufa-mcp",
      "env": {
        "PRUFA_API_TOKEN": "your-prufa-api-key"
      }
    }
  }
}
Restart the host app. The command path must be the absolute binary path
(not ~, not $()) — those don't expand in MCP config.
Prefer config files to env vars? Drop your token in
~/.config/prufa/mcp.jsoninstead — see ADVANCED.md.
Use it
In your agent:
> audit https://my-vibe-coded-app.com and show me the criticals
> run prufa on my staging deploy
> fetch the report for the audit I just ran
prufa_run_audit with wait=true (the default) blocks until the audit
completes and returns the JSON report directly — typically 25–60s for a public
page. If you set wait=false, the call returns immediately with the queued
state plus a share_token you can poll with prufa_get_report.
What you get (the OSS surface)
| Tool | What it does |
|---|---|
prufa_run_audit(url, wait=true) |
Triggers a public-page audit, polls until done, returns findings JSON. The wait flag is honored — it actually blocks. |
prufa_get_report(report_id) |
Fetches a report. report_id is EITHER the run UUID (from prufa_run_audit's run_id field) OR the share_token (the slug from /r/<token> in the audit creation report_url). The slug is what you'll see most often — use that. |
Beyond the snapshot
A free audit is a snapshot — it looks at your app once. The hosted product turns that into something that walks your flows and watches for regressions:
- Deep QA flows — describe a journey in plain language ("log in, add to cart, check out"); Prufa compiles it to a reviewable spec and runs it end-to-end in a real browser, asserting every step.
- Monitors — re-run any audit or flow on a schedule and get alerted the moment a grade drops or a flow breaks.
- Slack alerts, workspaces, billing, gremlin runs — ~22 more tools (the MCP surface is 24 tools total; 2 ship here, the rest are hosted).
The audit already detects your flows for you (the flows check in every report).
Turn them on at prufa.dev — free audits look, monitors walk.
Examples
Three runnable scripts in examples/:
examples/nextjs-app/— audit a deployed Next.js appexamples/vite-spa/— audit a Vite SPA (focuses on client-side routing audits)examples/stripe-checkout/— audit a Stripe-checkout page (payment-flow verification)
Each is a copy-pasteable demo:
export PRUFA_API_TOKEN=...
python examples/nextjs-app/audit.py https://your-nextjs-app.com
GitHub Action
Fail a PR when Prufa finds a critical regression:
# .github/workflows/prufa-scan.yml
name: Prufa scan
on: [pull_request]
jobs:
  audit:
    runs-on: ubuntu-latest
    steps:
      - uses: actions/checkout@v4
      - uses: actions/setup-python@v5
        with:
          python-version: "3.11"
      - run: pip install prufa-mcp
      - name: Run audit
        env:
          PRUFA_API_TOKEN: ${{ secrets.PRUFA_API_TOKEN }}
        run: |
          python -c "
          import asyncio, sys
          from prufa_mcp.audit import run_audit
          report = asyncio.run(run_audit(url='${{ secrets.STAGING_URL }}', wait=True))
          print(report.get('headline', 'audit complete'))
          criticals = report.get('counts', {}).get('critical', 0)
          if criticals:
              print(f'::error::Prufa found {criticals} critical finding(s)', file=sys.stderr)
              sys.exit(1)
          "
See examples/prufa-scan.yml for the full template.
License
Apache-2.0. See LICENSE. Contributions welcome — see CONTRIBUTING.md.
Project details
Verified details
These details have been verified by PyPIProject links
GitHub Statistics
Maintainers
Release history Release notifications | RSS feed


Download files
Download the file for your platform. If you're not sure which to choose, learn more about installing packages.
Source Distribution
Built Distribution
Filter files by name, interpreter, ABI, and platform.
If you're not sure about the file name format, learn more about wheel file names.
Copy a direct link to the current filters
File details
Details for the file prufa_mcp-0.1.5.tar.gz.
File metadata
- Download URL: prufa_mcp-0.1.5.tar.gz
- Upload date:
- Size: 22.1 kB
- Tags: Source
- Uploaded using Trusted Publishing? Yes
- Uploaded via: twine/6.1.0 CPython/3.13.12
File hashes
| Algorithm | Hash digest | |
|---|---|---|
| SHA256 |
848628b1cbcc28b0f31f47da35c92871ad71d78e54d342638bab7a2f9586bcc9
|
|
| MD5 |
533f3b377ec62da575cc2cd866e7712e
|
|
| BLAKE2b-256 |
bab6facdc11c665c0995ba6675ea0f4e75236e3b8ac7713c8d4dbe4f18f66195
|
Provenance
The following attestation bundles were made for prufa_mcp-0.1.5.tar.gz:
Publisher:
publish.yml on prufa-dev/prufa-mcp
-
Statement:
-
Statement type:
https://in-toto.io/Statement/v1 -
Predicate type:
https://docs.pypi.org/attestations/publish/v1 -
Subject name:
prufa_mcp-0.1.5.tar.gz -
Subject digest:
848628b1cbcc28b0f31f47da35c92871ad71d78e54d342638bab7a2f9586bcc9 - Sigstore transparency entry: 1842057640
- Sigstore integration time:
-
Permalink:
prufa-dev/prufa-mcp@b54cc03bc8fc27b25314de9fa38077dcfdc94d54 -
Branch / Tag:
refs/tags/v0.1.5 - Owner: https://github.com/prufa-dev
-
Access:
public
-
Token Issuer:
https://token.actions.githubusercontent.com -
Runner Environment:
github-hosted -
Publication workflow:
publish.yml@b54cc03bc8fc27b25314de9fa38077dcfdc94d54 -
Trigger Event:
push
-
Statement type:
File details
Details for the file prufa_mcp-0.1.5-py3-none-any.whl.
File metadata
- Download URL: prufa_mcp-0.1.5-py3-none-any.whl
- Upload date:
- Size: 16.0 kB
- Tags: Python 3
- Uploaded using Trusted Publishing? Yes
- Uploaded via: twine/6.1.0 CPython/3.13.12
File hashes
| Algorithm | Hash digest | |
|---|---|---|
| SHA256 |
4b9d4616563578d8ca6d7e7ed87eb9c5ddec8a3a8e93644555f6fe2f8d8410e0
|
|
| MD5 |
f122c4244099a0699ccfc2b0eddab992
|
|
| BLAKE2b-256 |
06f5f421bc4acd677d7b9d39ad0a0661c7aed6fdb80400642ecf9f4c64d1aaae
|
Provenance
The following attestation bundles were made for prufa_mcp-0.1.5-py3-none-any.whl:
Publisher:
publish.yml on prufa-dev/prufa-mcp
-
Statement:
-
Statement type:
https://in-toto.io/Statement/v1 -
Predicate type:
https://docs.pypi.org/attestations/publish/v1 -
Subject name:
prufa_mcp-0.1.5-py3-none-any.whl -
Subject digest:
4b9d4616563578d8ca6d7e7ed87eb9c5ddec8a3a8e93644555f6fe2f8d8410e0 - Sigstore transparency entry: 1842057812
- Sigstore integration time:
-
Permalink:
prufa-dev/prufa-mcp@b54cc03bc8fc27b25314de9fa38077dcfdc94d54 -
Branch / Tag:
refs/tags/v0.1.5 - Owner: https://github.com/prufa-dev
-
Access:
public
-
Token Issuer:
https://token.actions.githubusercontent.com -
Runner Environment:
github-hosted -
Publication workflow:
publish.yml@b54cc03bc8fc27b25314de9fa38077dcfdc94d54 -
Trigger Event:
push
-
Statement type:






