
 Lucidum
Lucidum is a local browser workbench for exploring CSV and Parquet data, visualising KPIs using interactive charts and maps, and building GLM and GBM models.
It is designed for data scientists who want an interactive view of their data and models without first building a dashboard. DuckDB reads the data efficiently and FastAPI serves the application locally.
Lucidum's approach reflects actuarial pricing workflows, including the development of regression models for claim frequency, average claim cost, conversion, retention, and market price. The same tools remain useful for broader tabular data science.
Lucidum uses glum for GLM training and LightGBM for GBM training. Both libraries were chosen for speed: glum provides high-performance, scalable generalised linear models, while LightGBM is optimised for efficient gradient-boosted tree training on large tabular datasets.
Capabilities
| Use Lucidum to | Tool |
|---|---|
 Inspect, search, sort, and copy source rows Inspect, search, sort, and copy source rows |
Dataset Viewer |
 Maintain reusable feature, KPI, and filter definitions Maintain reusable feature, KPI, and filter definitions |
Specifications |
 Understand distributions, ranges, missings, and common values Understand distributions, ranges, missings, and common values |
Column Profile |
 Explore grouped metrics across one or two features Explore grouped metrics across one or two features |
Line and Bar |
 Examine the distribution of a numeric response Examine the distribution of a numeric response |
Histogram |
 Explore geographic patterns in UK postcode data Explore geographic patterns in UK postcode data |
UK Mapping |
 Fit and review generalised linear models Fit and review generalised linear models |
GLM |
 Fit, evaluate, and explain boosted tree models Fit, evaluate, and explain boosted tree models |
GBM |
Install and launch
Lucidum requires Python 3.13 or newer. For a user-level lucidum command,
pipx is the recommended installation method. It installs Lucidum and its
dependencies in a dedicated virtual environment, avoiding conflicts with
other Python projects or system packages. The lucidum command is
still available on your PATH, so you can launch it from any terminal:
pipx install --python python3.13 py-lucidum
Launch the bundled synthetic motor dataset:
lucidum --demo --open
Or open your own data:
lucidum path/to/my_data.parquet --open
lucidum path/to/my_data.csv --open
lucidum path/to/monthly_parquets/ --open
The terminal prints the local URL if --open is omitted. Stop the server with
Ctrl+C.
Add modelling tools
GLM and GBM are optional so that non-modelling workflows stay lightweight. Choose the extras you need when installing:
pipx install --python python3.13 "py-lucidum[glm]"
pipx install --python python3.13 "py-lucidum[gbm]"
pipx install --python python3.13 "py-lucidum[glm,gbm]"
Then request the modelling tools alongside Line and Bar:
lucidum path/to/my_data.parquet --tools line-bar,glm --open
lucidum path/to/my_data.parquet --tools line-bar,glm,gbm --open
Use --tools all to load every available tool after installing the required
extras. On macOS, LightGBM may also require brew install libomp.
Plain pip, virtual environments, source checkouts, Windows installation,
upgrades, version pinning, and the full launch reference are covered in the
User Guide.
Working with your data
Lucidum accepts:
- A single CSV file.
- A single Parquet file. Parquet is recommended for normal use.
- A folder of direct-child Parquet files with identical column names and DuckDB types. The files are queried as one dataset; nested folders and non-Parquet files are ignored.
Folder inputs support the exploration tools but not GLM or GBM. Modelling artefacts must be tied to one source file, so use a single CSV or Parquet file when enabling either modelling tool.
The default tools are Line and Bar, Dataset Viewer, Column Profile, Histogram, UK
Mapping, and Specifications. Use --tools to choose and order the tabs shown in the
app:
lucidum path/to/my_data.parquet --tools dataset-viewer,column-profile,line-bar
By default, Lucidum runs on your own computer and protects the browser session with
an access token. To view the same analysis from another device on your local network,
launch with --host 0.0.0.0; keep the token enabled unless access is controlled in
another way.
The application and UK map geometry are included in the Lucidum installation. Blank maps work offline, while the other map backgrounds fetch tiles from their named providers.
Sidebar
Use the sidebar to move between Lucidum's tools. Numbered badges show saved models available in the modelling tools.
Collapse or expand the sidebar using the sidebar toggle in the page header. You can also toggle it by clicking the icon for the currently selected tool again.
 |
Lucidum — opens this README on GitHub. |
 |
Dataset Viewer |
 |
Specifications |
 |
Column Profile |
 |
Line and Bar |
 |
Histogram |
 |
UK Mapping |
 |
GLM |
 |
GBM |
 Dataset Viewer
Use Dataset Viewer when you need to inspect the rows behind a chart, filter, or map.
- Browse a fast, filtered preview in a sortable table.
- Search across the preview, select rows or columns, and copy cells or CSV data.
- Transpose the preview when a wide dataset is easier to read vertically.
- Search, reorder, resize, sort, and pin columns.
- Save the current table layout and filter as a Dataset view favourite.
The displayed preview is capped at 100 rows; filtering and the other analytical tools continue to work against the dataset rather than only the preview.
 Specifications
Specifications uses three simple CSV files to tailor Lucidum to your dataset and make everyday analysis quicker and easier. Edit them on Lucidum's Specifications screen, or outside Lucidum with a text editor or spreadsheet application such as Excel.
- Filter Specification (default
filter_spec.csv) gives names and themes to reusable DuckDB filter expressions. - KPI Specification (default
kpi_spec.csv) defines named Numerator and Denominator combinations together with their display format and decimal places. - Feature Specification (default
feature_spec.csv) organises features into groups and can define modelling scenarios, interaction groups, chart bases, GLM tabulation grids, and defaults for reproducible external reports.
These filenames are defaults rather than requirements. Use --filters, --kpis,
and --features to select differently named files when launching Lucidum.
Lucidum validates changes against the current dataset and the expected CSV format. If a file does not exist, the Specifications screen provides a starter draft; after a valid file is saved, the corresponding controls refresh without restarting the application.
 Column Profile
Use Column Profile to learn the shape and quality of an unfamiliar dataset before choosing features or metrics.
- Review data types, missing values, distinct counts, ranges, and common values.
- Inspect numeric and date distributions or categorical value counts.
- Open large datasets quickly with a preview summary, then request exact all-row profiling when needed.
- Copy a feature name from the column table.
Columns that DuckDB cannot read are reported as skipped instead of breaking the normal feature selectors.
 Line and Bar
Line and Bar is the main tool for assessing model predictions against observed results, or simply exploring a KPI interactively across one or two features.
Set the Numerator and Denominator in the sidebar, either from the dropdowns at the top or by choosing a saved KPI in the KPIs section.
- Plot Actual and up to two Expected series, including active GLM and GBM predictions.
- Analyse one feature with line and bar charts, or two features with continuous surfaces, continuous-by-factor lines, and factor-by-factor heatmaps.
- Group numeric features with fixed bands or quantiles, bucket dates by calendar period, treat numeric or date features as factors, and control missing values and low-weight tails independently.
- Apply sorting, response transforms, sigma bars, empty date periods, and heatmap labels where they are meaningful.
- Overlay GLM partial dependence or GBM SHAP ribbons for compatible active models.
- Inspect the grouped data in a searchable, paginated table and save the complete analysis as a Line/Bar view favourite.
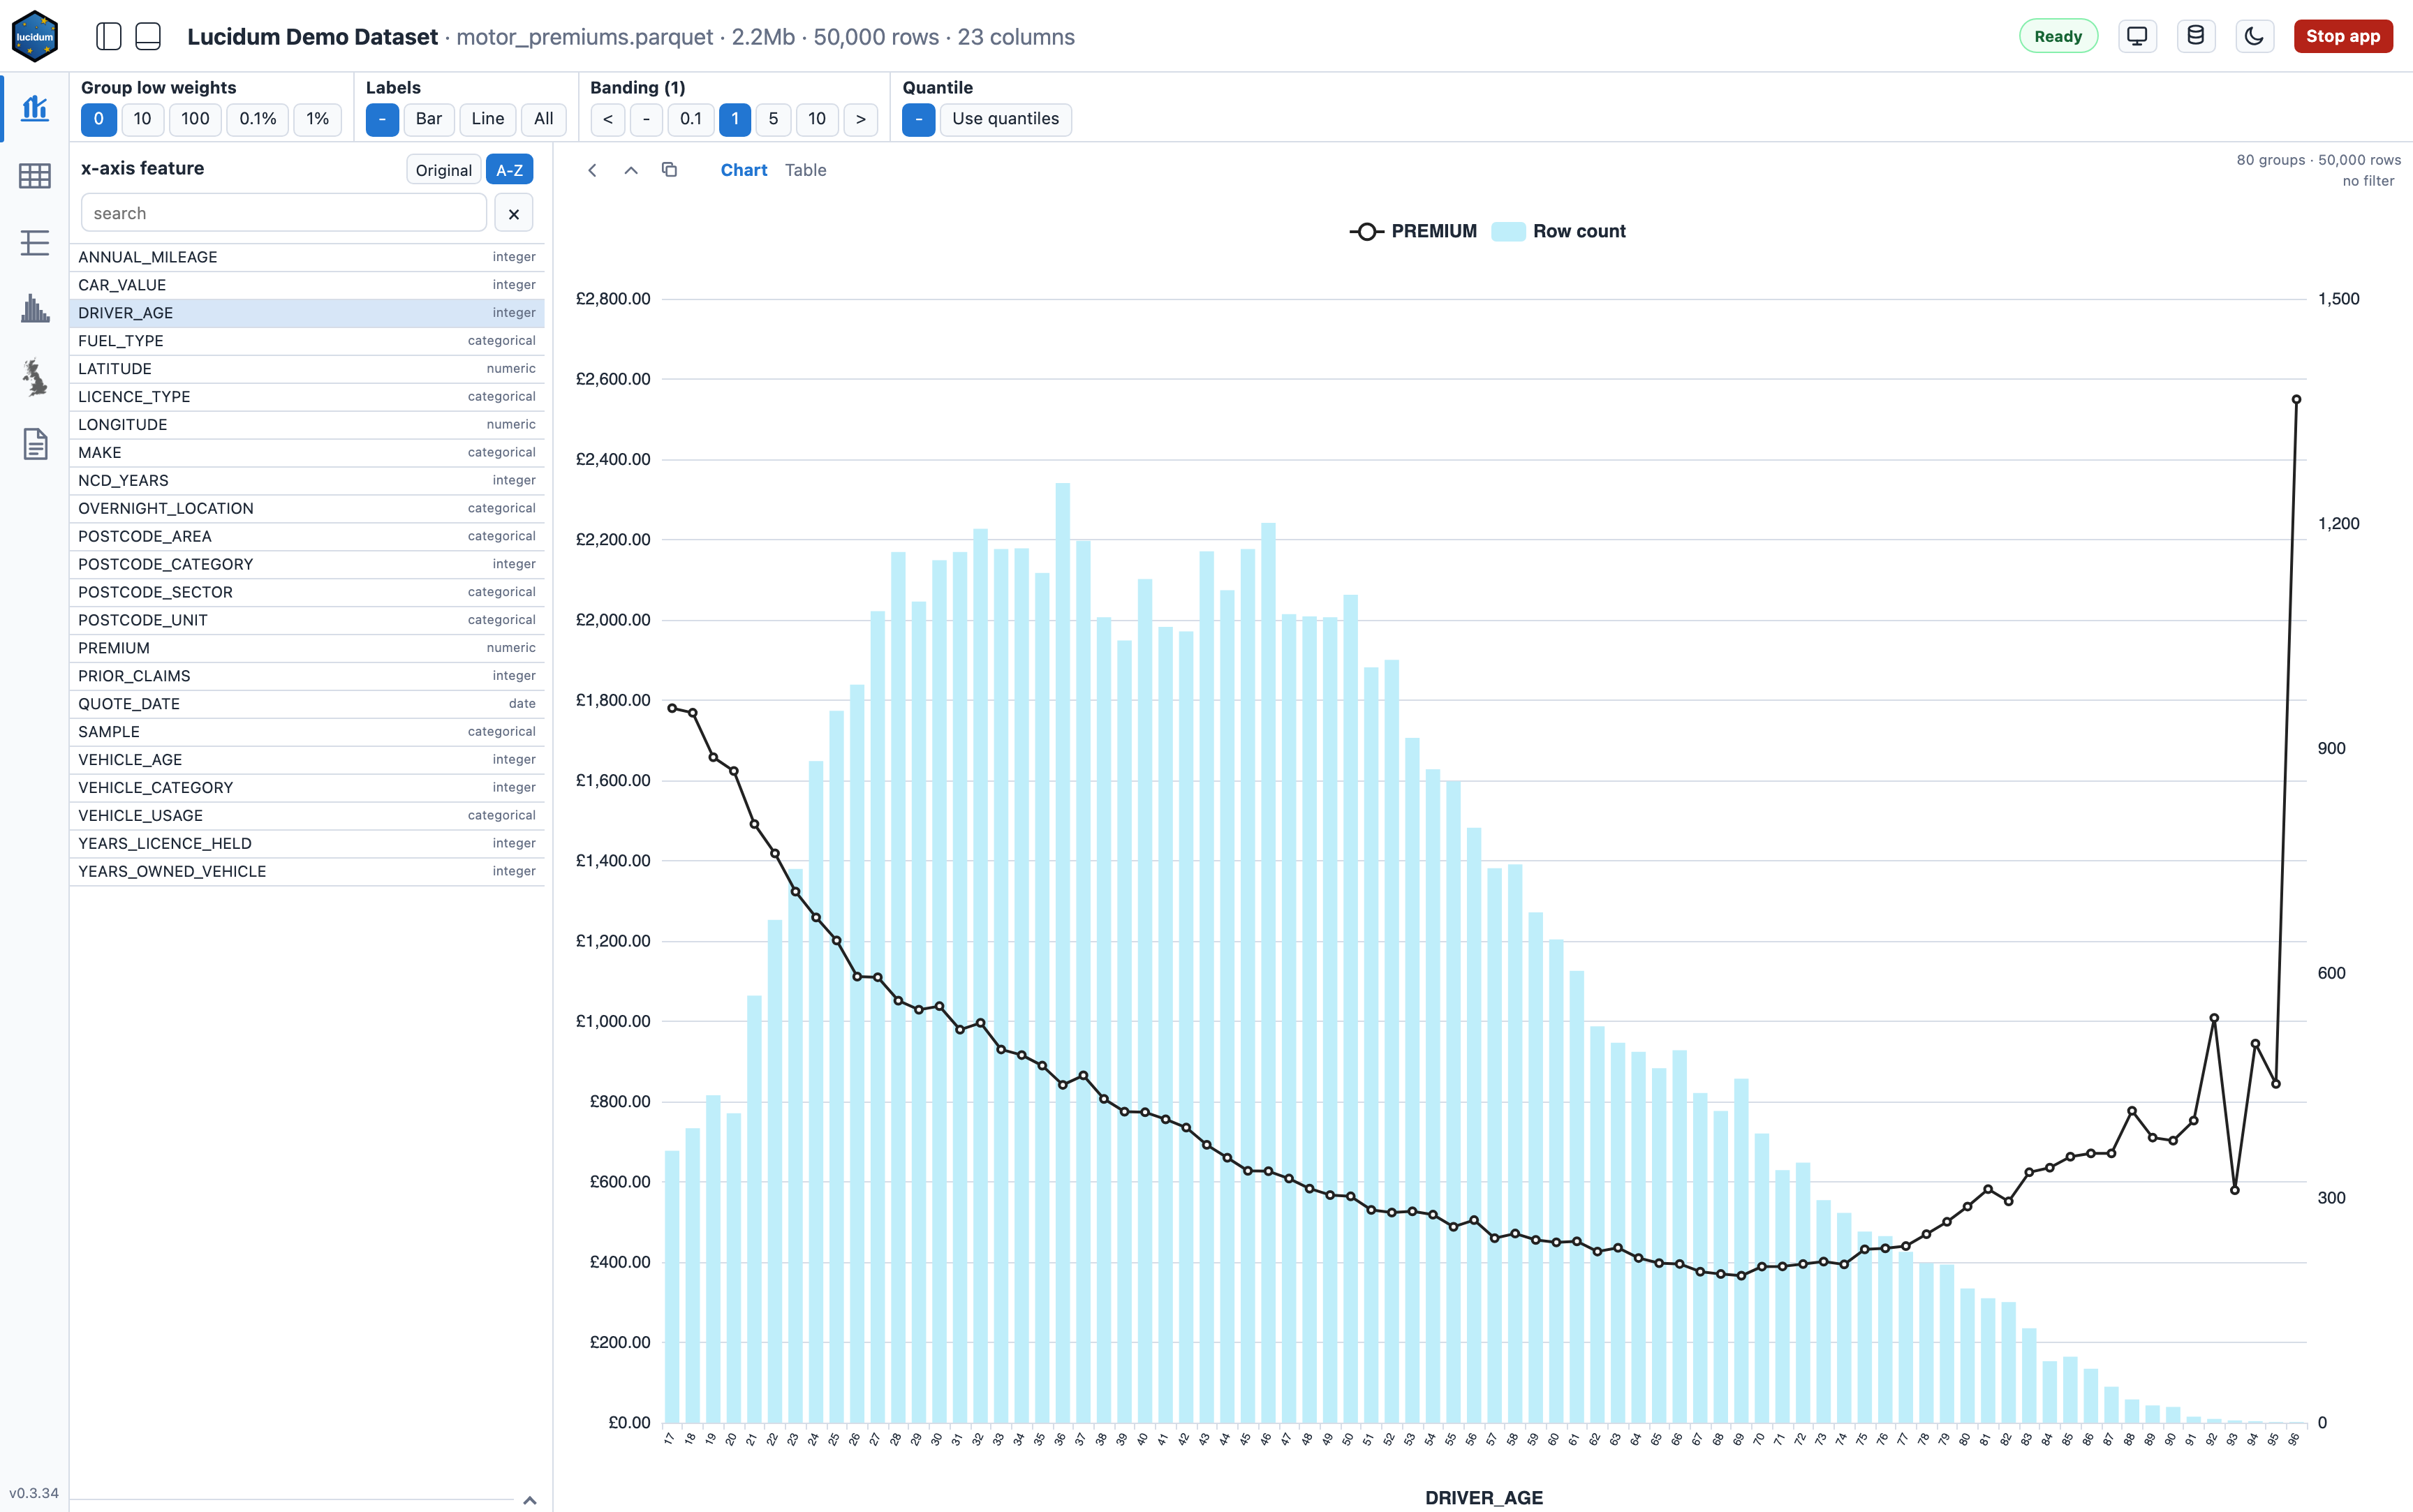
A Denominator turns the response into Numerator / Denominator; choosing Average
row value analyses the Numerator directly. Volume remains available alongside the
response so small groups are visible rather than silently over-interpreted.
The detailed chart modes, grouping rules, limits, model compatibility warnings, and table behaviour are described in the Line and Bar guide.
 Histogram
Use Histogram to understand the distribution of the selected Numerator or
Numerator / Denominator.
- Choose a bin count or an explicit bin width in the source units.
- Switch between counts and probability, or show a cumulative distribution.
- Use a log axis and optional mean or median reference lines.
- Display values above bins and review summary metrics beside the chart.
- Use a fast 100,000-row sample or calculate exact all-row bins.
- Save the settings and filter as a Histogram view favourite.
 UK Mapping
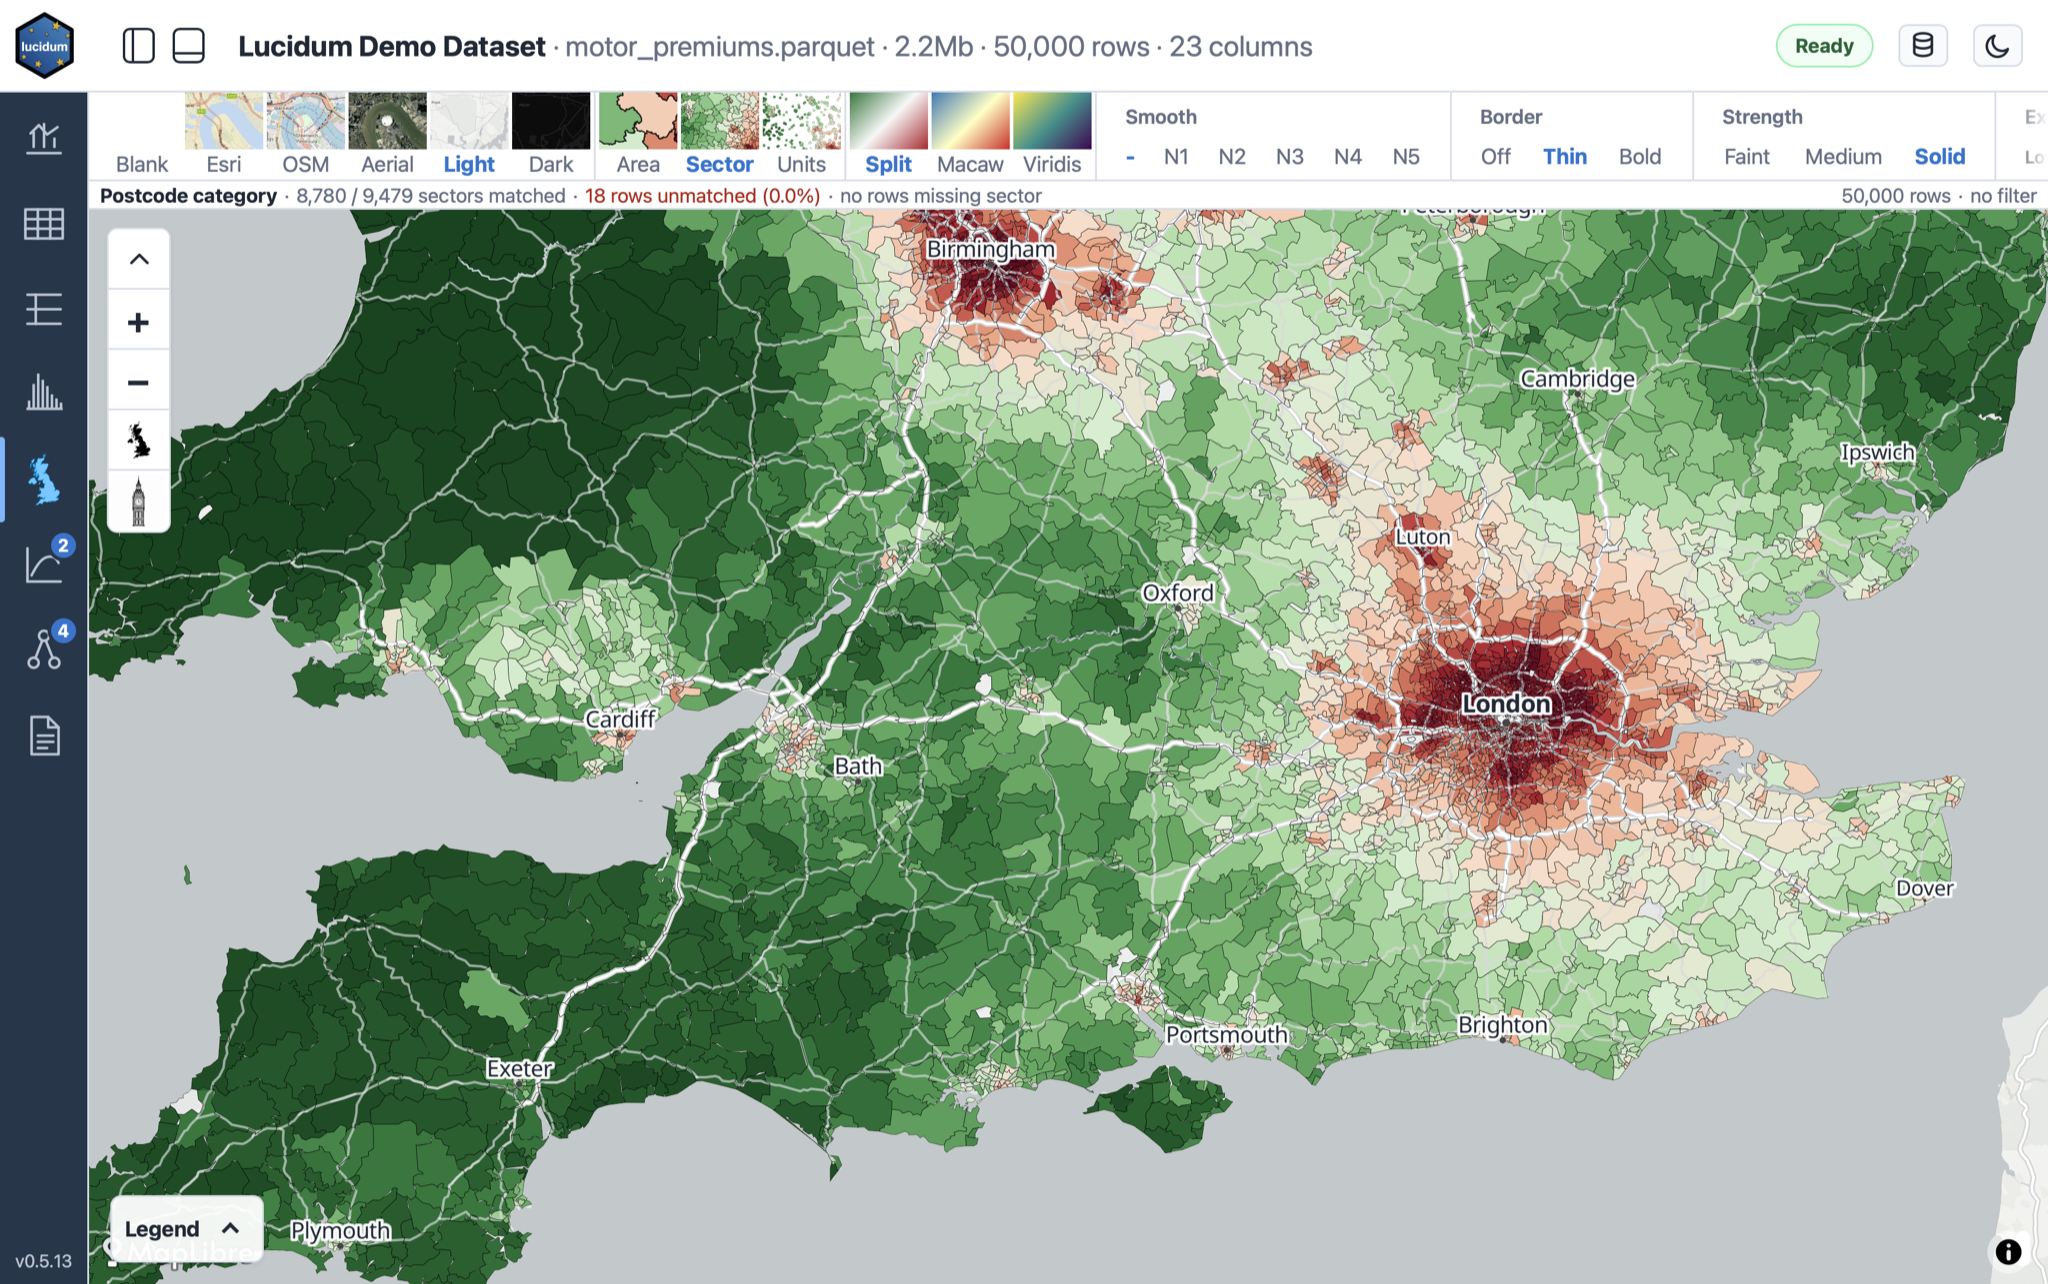
Lucidum uses MapLibre GL and WebGL-accelerated rendering to keep maps fast and responsive as you pan, zoom, and explore results.
Use UK Mapping to find geographic patterns in metrics, model predictions, or SHAP outputs.
- Map postcode areas and sectors with bundled geometry.
- Plot postcode units when unit, latitude, and longitude columns are available.
- Choose blank, street, aerial, light, or dark backgrounds and several analytical palettes.
- Smooth neighbouring sectors, control polygon outlines and area labels, or adjust point size for dense unit maps.
- Save the active sector metric and filter as a Parquet containing raw values and all five smoothing levels.
- Search for postcodes and turn a selected map region into a global filter.
- Save the map presentation, metric, filter, and camera as a Map view favourite.
Lucidum reports blank and unmatched postcode rows separately so the map does not hide missing geometry behind apparently complete results.
Sector Parquet saves are standalone artifacts under
.lucidum/datasets/<slug>/<signature>/uk_map/sector_smoothing/. Repeating the same
metric/filter save atomically replaces the same file; changing the specification
creates a separate file.
 GLM
GLM
GLM provides an optional glum workflow for fitting interpretable generalised
linear models against the active Numerator and Denominator.
- Write Formulaic formulas with common transforms, splines, categorical terms, interactions, comments, and explicit offsets.
- Fit normal, Poisson, Gamma, Tweedie, binomial, inverse Gaussian, and negative binomial models.
- Choose unregularised fitting, automatic regularisation, or manual ridge/lasso mix
settings, and fit all rows or the physical
SAMPLE = trainingrows. - Review sortable coefficients, model diagnostics, feature importance, and saved models.
- Build rating-table tabulations, rebase them without changing row-level scores, plot them, and export them to XLSX.
- Use active predictions, prediction rates, tabulated predictions, and partial dependence overlays in Line and Bar.
GLM models are saved in the current dataset workspace and can be reactivated in a later session against the same dataset version.
 GBM
GBM
GBM provides an optional LightGBM workflow for fitting, evaluating, and explaining boosted tree models.
- Select features and parameters, use saved feature scenarios, apply monotonicity, and define main-effect, pairwise, or grouped interaction constraints.
- Train a single configuration or deterministic parameter grid; use an existing
SAMPLEcolumn or create a reusable 60/20/20 split. - Choose normal LightGBM training or staged EBM mode, and optionally initialise from a numeric source or fitted GLM prediction.
- Follow live training metrics, compare completed models, inspect saved parameters, and view individual trees.
- Save SHAP rows and explore one- or two-feature SHAP plots, Stacked SHAP, feature importance, and interaction-group contributions.
- Export saved tabulations and use active predictions, prediction rates, and SHAP outputs in Line and Bar or UK Mapping.
GBM models and diagnostics are persistent. Activating a saved model refreshes its features, parameters, evaluation, trees, explanations, and shared model outputs.
Saved work and persistence
Lucidum saves trained models and favourite views so they remain available in later sessions. Each type of saved work is stored differently:
- GLM and GBM models are saved with their diagnostics and reusable outputs in a
.lucidum/sidecar folder beside the source.parquetor.csvfile. Each dataset version has a separate workspace inside it; reopening the same version makes those models available again. - Favourites save selected metrics, filters, and tool settings. They are associated with the dataset path, so they can survive replacement of the file at that location.
- Specification files are ordinary CSV inputs rather than saved analyses. They tailor Lucidum's filters, KPIs, feature groups, and modelling choices to the dataset.
Lucidum identifies each version of a source dataset separately. If the source file changes, Lucidum creates a new workspace; models from the earlier version remain on disk but are not automatically attached to the changed data.
The User Guide describes favourite and model storage and specification behaviour in detail.
Python usage
The browser app can also be started from Python:
import py_lucidum

url = py_lucidum.serve(
    "path/to/my_data.parquet",
    port=8000,
    open_browser=True,
)
In notebook-style runtimes such as Positron or Jupyter, serve() starts the server
in the background and returns its URL. In a normal Python shell, it blocks until the
server is stopped.
Lucidum also exposes chart/report writers, GLM tabulation functions, and a standalone postcode-sector smoother and LightGBM interaction-group extractor. For example:
from py_lucidum import smooth_postcode_sectors

output = smooth_postcode_sectors(
    "motor.parquet",
    "local/premium_training_smoothing.parquet",
    postcode_sector="POSTCODE_SECTOR",
    numerator="PREMIUM",
    filter="SAMPLE = 'training'",
)
Omitting denominator calculates average row value. The output contains the raw
numerator and denominator sums, unsmoothed, smooth_n1 through smooth_n5, and
the corresponding pooled numerator_n1 through numerator_n5 and
denominator_n1 through denominator_n5 sums.
See examples/postcode_sector_smoothing_demo.py for the complete demo workflow and
Python usage in the User Guide
for the full contract and other public entry points.
python examples/postcode_sector_smoothing_demo.py
External models and reports
From a source checkout, install the dependencies used by both example workflows:
python -m pip install -e ".[glm,gbm,examples]"
For a client machine with an existing workflow folder, upgrade Lucidum and refresh the maintained Python scripts without copying them by hand:
pipx upgrade py-lucidum
lucidum --sync-examples /path/to/client/examples
The sync creates or overwrites only the six numbered workflow scripts and four
Python helpers. It does not change client YAML, formulas, specifications, data, or
other files. Add --dry-run to preview the result without writing files.
The examples/ folder contains parallel three-step GLM and GBM workflows that:
- Train and score a model outside the Lucidum application.
- Create interactive, static-data Actual-versus-Expected or SHAP HTML reports.
- Create model summaries and, for GLM, tabulations and an XLSX workbook.
The saved results can remain independent of Lucidum or be copied into the matching dataset workspace for review in the application without retraining.
See Build models outside Lucidum, then report or view them for the complete workflows and YAML reference.
Documentation
- User Guide — detailed installation, launch, tool, modelling, and persistence behaviour.
- External models and reports — three-step GLM and GBM workflows.
- Model operations monitor — timing, CPU, memory, and diagnostic guidance.
- Development notes — architecture, behaviour contracts, testing, and releases.
Lucidum is open source under the MIT License.
1 maintainer

Metadata
1 maintainer
Release files for py-lucidum 0.5.21
For a detailed explanation of source distributions (sdists) and built distributions (wheels), please see the package formats documentation.
Source distribution (sdist)
| File | Size | Uploaded | |
|---|---|---|---|
| py_lucidum-0.5.21.tar.gz | 22.2 MB | Details |
Built distribution (wheel)
| File | Interpreter | ABI | Platform | Reset |
|---|---|---|---|---|
| py_lucidum-0.5.21-py3-none-any.whl | Python 3 | none | any | Details |
Total release size: 34.5 MB
Release files / py_lucidum-0.5.21.tar.gz
| Download URL | py_lucidum-0.5.21.tar.gz |
|---|---|
| Size | 22.2 MB |
| Tags | Source |
|
SHA-256 checksum How to use checksums |
e21e5487ff8d6f01149b7757f99e55e023d4866c375656bc36d828db8dac013c
|
|
BLAKE2b-256 checksum How to use checksums |
d1127877c59e6c0feccefc5b49db638d91f4a1b827c33c59740017bbd590b44d
|
| Upload date | |
|
Uploaded using Trusted Publishing? What is trusted publishing? |
Yes |
| Uploaded via |
twine/7.0.0 CPython/3.13.14
|
Provenance
Provenance describes where a file came from. On PyPI, provenance is shared via attestations, which provide a verifiable record of the build or publishing details. View details, limitations and caveats.


PyPI Publish Attestation
PyPI verified that this artifact, at this checksum, originated from the publisher listed below.
Signed by GitHub Actions, verified by PyPI on Aug 20, 2026.
Transparency logRelease files / py_lucidum-0.5.21-py3-none-any.whl
| Download URL | py_lucidum-0.5.21-py3-none-any.whl |
|---|---|
| Size | 12.3 MB |
| Tags | Python 3 |
|
SHA-256 checksum How to use checksums |
c125bae494fd162dd45fe3c50b84b8190381f8bc363a21f8ff27467c546c0aa5
|
|
BLAKE2b-256 checksum How to use checksums |
d6a3efe0a7359e5733ecb37d6a3bd8fe8dd34e366b8247db892321e64027b9d2
|
| Upload date | |
|
Uploaded using Trusted Publishing? What is trusted publishing? |
Yes |
| Uploaded via |
twine/7.0.0 CPython/3.13.14
|
Provenance
Provenance describes where a file came from. On PyPI, provenance is shared via attestations, which provide a verifiable record of the build or publishing details. View details, limitations and caveats.
PyPI Publish Attestation
PyPI verified that this artifact, at this checksum, originated from the publisher listed below.
Signed by GitHub Actions, verified by PyPI on Aug 20, 2026.
Transparency log













