
pyFlightPlotter


Interactive, configurable and three-dimensional flight data plotting, with little boilerplate.
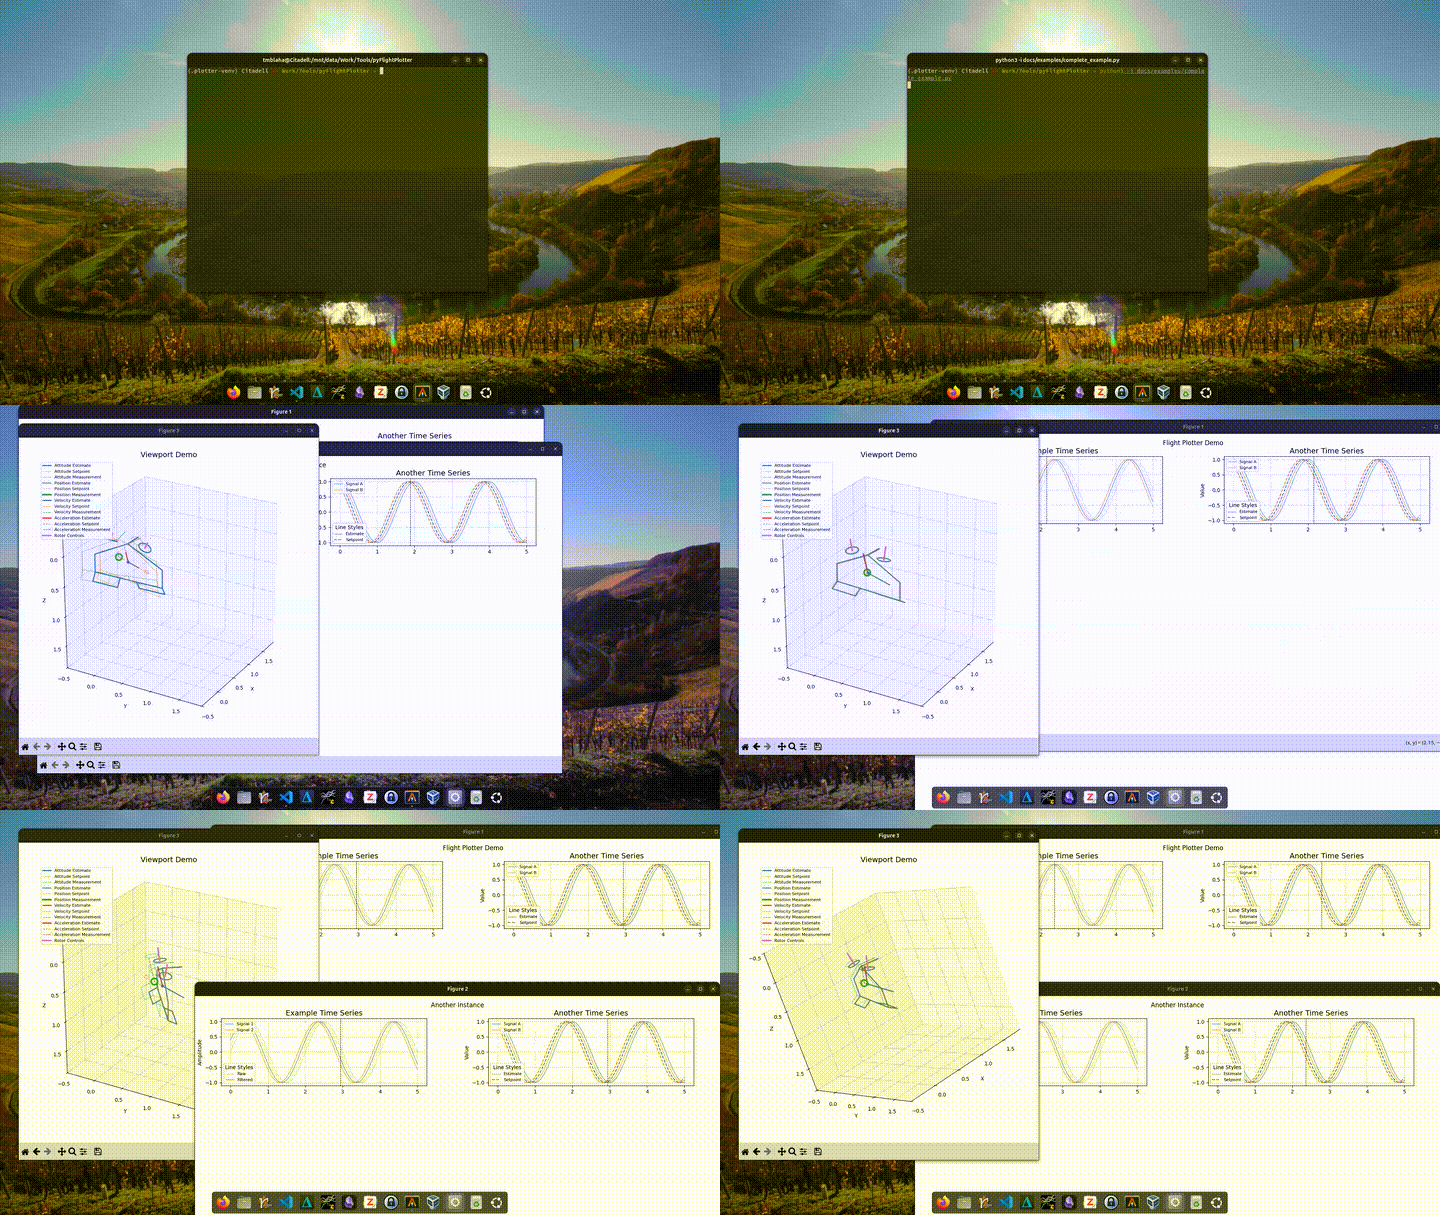
Hover over a time-series plot and every connected window follows along: the cursor moves in sync in all time-series axes, and a 3D viewport shows the vehicle's attitude, position, velocity, acceleration and actuator state at that moment. You can also sync an onboard or external video to the log.
Features
- 3D viewport showing estimates, setpoints and measurements of
- attitude (quaternions)
- position, velocity and acceleration
- rotor force commands
- control surface deflections
- Time-series plotting in a configurable grid layout.
_plot_timeseries()takes several line styles (light / solid / dashed / true value) and keeps colours consistent across series. - A synchronized vertical cursor across all time-series axes, even when they're spread over several figures. The 3D viewport updates on mouse hover.
- Playback: press Space to play or pause the log in real time.
- Video sync (
VideoViewport): show an MP4 next to the log, with an adjustable time offset. - Craft builder: the
Craft3Dclass hasaddRotorandaddSurfacemethods to define a vehicle quickly.- single-axis surface tilt
- dual-axis rotor tilt
- presets included:
Quadrotor,Tailsitter
Installation
pip install pyFlightPlotter
With video support (VideoViewport, which needs OpenCV):
pip install "pyFlightPlotter[video]"
The latest development version from GitHub:
pip install "pyFlightPlotter @ git+https://github.com/tudelft/pyFlightPlotter"
Requires Python 3.10 or newer. The dependencies are numpy, scipy and matplotlib. You also need an
interactive matplotlib backend (e.g. QtAgg or TkAgg).
Usage
You build a plotter by subclassing FlightPlotterBase and implementing _populate(), where you add the
subplots you want. BlittedCursor adds the synchronized cursor, and connect_viewport() links a 3D
Viewport (or a VideoViewport) to the mouse.
A minimal example (docs/examples/minimal_example.py):
import numpy as np

from pyFlightPlotter import FlightPlotterBase, BlittedCursor, Viewport, Quadrotor

class FlightPlotterMinimalExample(FlightPlotterBase):
    def __init__(self, time, data):
        self.data = data
        super().__init__(time, name="MWE")
        self.define_layout(nrows=1, ncols=1)
        self.plot()

    def _populate(self):
        self._plot_timeseries(
            self.fig.add_subplot(self.gs[0, 0]),
            light=None,
            solid=[self.data[2], self.data[3]],
            dashed=[self.data[0], self.data[1]],
            series_labels=["Signal 1", "Signal 2"],
            style_labels=[None, "Estimated", "Setpoint"],
            title="Example Time Series",
            ylabel="Amplitude",
        )

if __name__ == "__main__":
    t = np.linspace(0, 2, 101)
    data = [
        np.sin(2*np.pi*0.5*t), np.sin(2*np.pi*0.5*t + 0.2),
        np.cos(2*np.pi*0.5*t + 0.4), np.cos(2*np.pi*0.5*t + 0.6),
    ]

    fp = FlightPlotterMinimalExample(t, data)
    bc = BlittedCursor(fp.all_axes, sharex=True)

    vp = Viewport(craft=Quadrotor(),
                  time=np.array([0., 1., 2.]),
                  att=np.array([[1., 0., 0., 0.], [0.7, 0., 0., 0.7], [0., 0., 0., 1.]]),
                  # ... many more data can be passed here, but attitude is required
                  interpolation="linear",
                  follow=False,
                  title="Viewport Example",
                  )

    # connect mouse hover
    fp.connect_viewport(vp)
Run it with python -i so the windows stay open.
For a full example with several figures, a tailsitter, and position/velocity/actuator data, see
docs/examples/complete_example.py.
For an example of hooking pyFlightPlotter into your own log-data structure, see
indiflight.
Video synchronization
from pyFlightPlotter import VideoViewport

vv = VideoViewport(time=t, mp4_path="flight.mp4", offset_s=0.0)
fp.connect_viewport(vv)
The video time is data_time + offset. You can set the offset with the slider or text box in the video
window, or step one frame at a time with the arrow keys. You can also load a file from inside the window.
Controls
| Input | Action |
|---|---|
| Mouse hover over a time-series axis | Move the cursor; all connected viewports update |
| Space | Play / pause real-time playback |
| ← / → (video window) | Shift the video offset by one frame |
Conventions
Quaternions are scalar-first: [w, x, y, z]. Arrays are expected with time along the first axis, e.g.
Nx4 for attitude and Nx3 for position, velocity and acceleration. See the Viewport docstring for all
supported inputs.
Browser version (pyFlightPlotter.web)
The same plots in the browser, drawn with uPlot and three.js: fast enough
for long, high-rate logs, with a synchronized cursor and live values, zoom and pan, playback, a PSD of the visible
window per panel, PNG export, and a 3D view. Python supplies the signals, panels and 3D view; show() serves them
from a local server (127.0.0.1) and opens the browser. The ? button lists the mouse and keyboard controls. One of
them is Shift+Space (or Ctrl+Space), which replays from the pinned time: the pin
stays put while a dashed line plays. Space stops it, leaving the dashed line where it stopped, and plays again
from the pin, so one section can be played again and again, until you pin another time or press Esc.
from pyFlightPlotter import Tailsitter
from pyFlightPlotter.web import WebPlotter

wp = WebPlotter(t, name="Demo")
wp.add_signals({"pos[0]": x, "pos[1]": y, "pos[2]": z})          # dict or pandas DataFrame
wp.add_panel("Position", solid=["pos[0]", "pos[1]", "pos[2]"],   # as _plot_timeseries
             series_labels=["X", "Y", "Z"], style_labels=[None, "Estimate", None], ylabel="[m]")
wp.set_viewport(Tailsitter(), att=quat_wxyz, pos=pos_xyz)         # as Viewport
wp.add_event(5.0, "takeoff")
wp.show()
Column references in panels and the viewport are names, (name, scale) tuples, or arrays. add_signal(..., description="...")
(or data.descriptions in JS) explains a signal, e.g. a derived one, in tooltips and the signal picker. A complete example is in
docs/examples/web_example.py.
The JS part is a standalone ES module package (package.json at the repository root, sources in
pyFlightPlotter/web/static/flightplotter/), usable without Python:
import { FlightPlotter, Dataset, quadrotor } from "flightplotter";
import "flightplotter/style.css";
import "uplot/dist/uPlot.min.css";

const fp = new FlightPlotter(element, {
    data: { time, columns: { "pos[0]": Float32Array, ... }, events: [{ t, name, kind }] },
    panels: [{ title: "Position", ylabel: "[m]", styles: [null, "Estimate", null],
               series: [{ label: "X", solid: "pos[0]" }] }],
    viewport: { craft: quadrotor(), att: ["q0", "q1", "q2", "q3"], pos: ["pos[0]", "pos[1]", "pos[2]"] },
    editable: false,   // no editing, tabs only to switch, no layout import/export
    theme: "dark",
});
Layouts, tabs and windows
The data goes in once; the panels and the 3D view can change afterwards. With editable (the default) you can:
- add plots and signals, edit a panel (✎ or double-click its title: titles, y range, line styles, series with
"name * scale"), drag a panel by its header onto another (swap) or an empty cell (move), and remove it; - organise panels in tabs (+ to add, double-click to rename, × to close). Each tab can show the 3D view or not (the 3D button; on by default in the first tab only);
- pick the craft in the 3D view (from the host's
craftsoption) and set each rotor's spin and signals (Rotors…); - ⧉ opens a tab in its own window, which follows the main window's cursor, zoom and playback and returns
to the tab bar when closed. This needs a
popoutUrl: a page that loads the library and callsattachPopout()(the page served from Python does this itself); - export the layout as JSON, import one, or go back to the initial layout (Layout with its download, upload and ↺ buttons);
- save a single tab as a
.tab.jsonfile (the download button on the active tab) and add tabs from such files (the upload button next to +, several files at once; a whole layout file adds all its tabs). Tab files leave out the 3D view, which belongs to the layout, so a tab can move between setups with different crafts.
The layout file holds no data, and column references that a log lacks are skipped, so one layout works across logs:
{ "format": "flightplotter-layout", "version": 2,
  "tabs": [{ "name": "Attitude", "view": true,
             "panels": [{ "title": "Rates", "ylabel": "[rad/s]", "styles": [null, "Estimate", "Setpoint"],
                          "series": [{ "label": "roll", "solid": "gyro[0]", "dashed": ["gyroSp[0]", 1] }] }] }],
  "viewport": { "craft": { "body": [], "rotors": [], "surfaces": [] }, "att": ["q0", "q1", "q2", "q3"] } }
Version 1 files ({ "panels": [...], "viewport": ... }) still load, as one tab. From code: fp.getLayout(),
fp.setLayout(layout) (throws on a malformed layout, naming the entry), the layout option to start from a saved
layout, and onLayoutChange(layout) to persist the user's. In Python, wp.add_tab("Name", view=False) starts a tab
for the following add_panel calls, and wp.set_layout("layout.json") / wp.layout() read and write the same
format. A layout without a "viewport" key keeps the current 3D view; "viewport": null removes it.
A tab file is one entry of tabs with its own header:
{ "format": "flightplotter-tab", "version": 2, "name": "Attitude", "view": true, "panels": [ ... ] }
From code: tabToJSON(tab) / parseTab(x), fp.exportTab(tab) and fp.addTabs(tabs) (names already taken get a
(2) suffix). Importing a tab file with the layout's upload button adds it rather than replacing the layout. In Python,
wp.tab_layout("Name") returns one tab in this format and wp.add_tab_file("x.tab.json") appends it.
It needs uplot and three resolvable by the bundler; the page served from Python uses the copies in
pyFlightPlotter/web/static/vendor/ through an import map.
Development
git clone https://github.com/tudelft/pyFlightPlotter
cd pyFlightPlotter
pip install -e ".[video]"
python -i docs/examples/complete_example.py
License
GPL-3.0-or-later. See LICENSE.
1 maintainer

Metadata
1 maintainer
Release files for pyFlightPlotter 0.5.1
For a detailed explanation of source distributions (sdists) and built distributions (wheels), please see the package formats documentation.
Source distribution (sdist)
| File | Size | Uploaded | Provenance | Actions |
|---|---|---|---|---|
| pyflightplotter-0.5.1.tar.gz | 334.2 kB | Without provenance | Details for pyflightplotter-0.5.1.tar.gz |
Built distribution (wheel)
| File | Interpreter | ABI | Platform | Actions Reset |
|---|---|---|---|---|
| pyflightplotter-0.5.1-py3-none-any.whl | Python 3 | none | any | Details for pyflightplotter-0.5.1-py3-none-any.whl |
Total release size: 676.5 kB
Release files / pyflightplotter-0.5.1.tar.gz
| Download URL | pyflightplotter-0.5.1.tar.gz |
|---|---|
| Size | 334.2 kB |
| Tags | Source |
|
SHA-256 checksum How to use checksums |
11bf8295faa0b2d28605671c34cf61be2bd18e08eac7a39417db0ddb6a9f83c6
|
|
BLAKE2b-256 checksum How to use checksums |
92460a4f2d2be4b6ef672ce51ecc41a028c60153aacd4402bec78eb5f41e7e68
|
| Upload date | |
|
Uploaded using Trusted Publishing? What is trusted publishing? |
Yes |
| Uploaded via |
uv/0.13.9 {"installer":{"name":"uv","version":"0.13.9","subcommand":["publish"]},"python":null,"implementation":{"name":null,"version":null},"distro":{"name":"Ubuntu","version":"26.04","id":"resolute","libc":null},"system":{"name":null,"release":null},"cpu":null,"openssl_version":null,"setuptools_version":null,"rustc_version":null,"ci":true}
|
Release files / pyflightplotter-0.5.1-py3-none-any.whl
| Download URL | pyflightplotter-0.5.1-py3-none-any.whl |
|---|---|
| Size | 342.3 kB |
| Tags | Python 3 |
|
SHA-256 checksum How to use checksums |
3fb95b9a7b31fd93bfd7eca400f0180b050b9b0d9a52909ca48e3042b0707ab1
|
|
BLAKE2b-256 checksum How to use checksums |
0850c8066fda0d83d2a4e372c069dbaac371d8830231ec39df9e7b7704a10113
|
| Upload date | |
|
Uploaded using Trusted Publishing? What is trusted publishing? |
Yes |
| Uploaded via |
uv/0.13.9 {"installer":{"name":"uv","version":"0.13.9","subcommand":["publish"]},"python":null,"implementation":{"name":null,"version":null},"distro":{"name":"Ubuntu","version":"26.04","id":"resolute","libc":null},"system":{"name":null,"release":null},"cpu":null,"openssl_version":null,"setuptools_version":null,"rustc_version":null,"ci":true}
|
Security for pyFlightPlotter 0.5.1
Provenance
Provenance describes where a file came from. On PyPI, provenance is shared via attestations, which provide a verifiable record of the build or publishing details. View details, limitations and caveats.
No provenance found
None of the files in this release were uploaded with provenance metadata.
A note on package security
PyPI is a repository for distributing packages, not a service for auditing them. While third-party security researchers and our staff do their best to detect and remove malicious packages, PyPI cannot guarantee the quality, security or suitability of any given package.
To learn more about protecting yourself from malicious actors, visit our package security documentation.














