renders pyecharts as image


Project description


Introduction
pyecharts-snapshot renders the output of pyecharts as a png, jpeg, gif image or a pdf file at command line or in your code.
Usage
Get png:
$ snapshot render.htmlAnd you will get:
Get pdf:
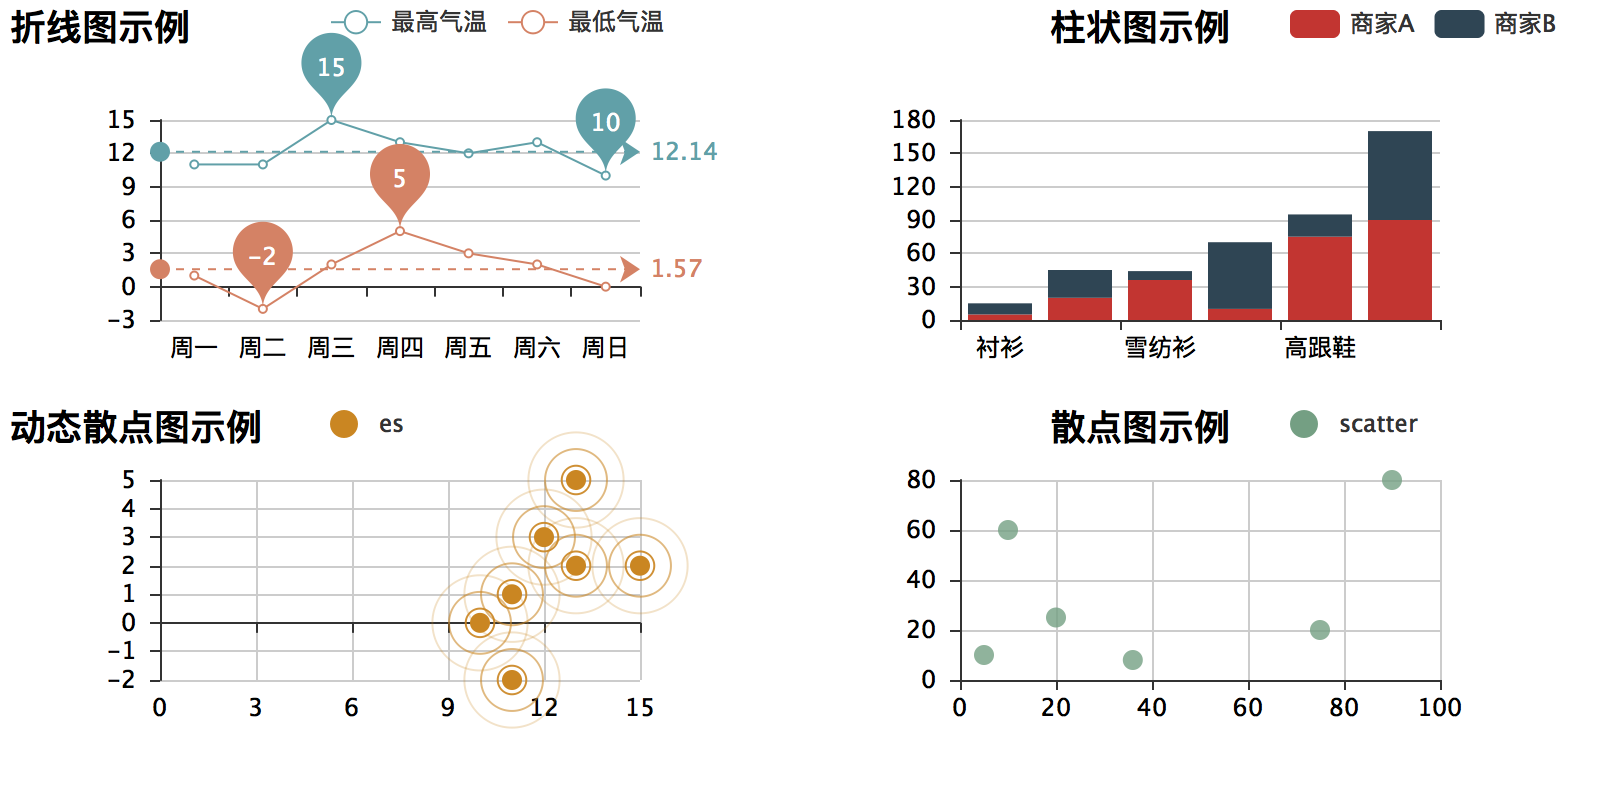
$ snapshot render.html pdfAnd you will get:
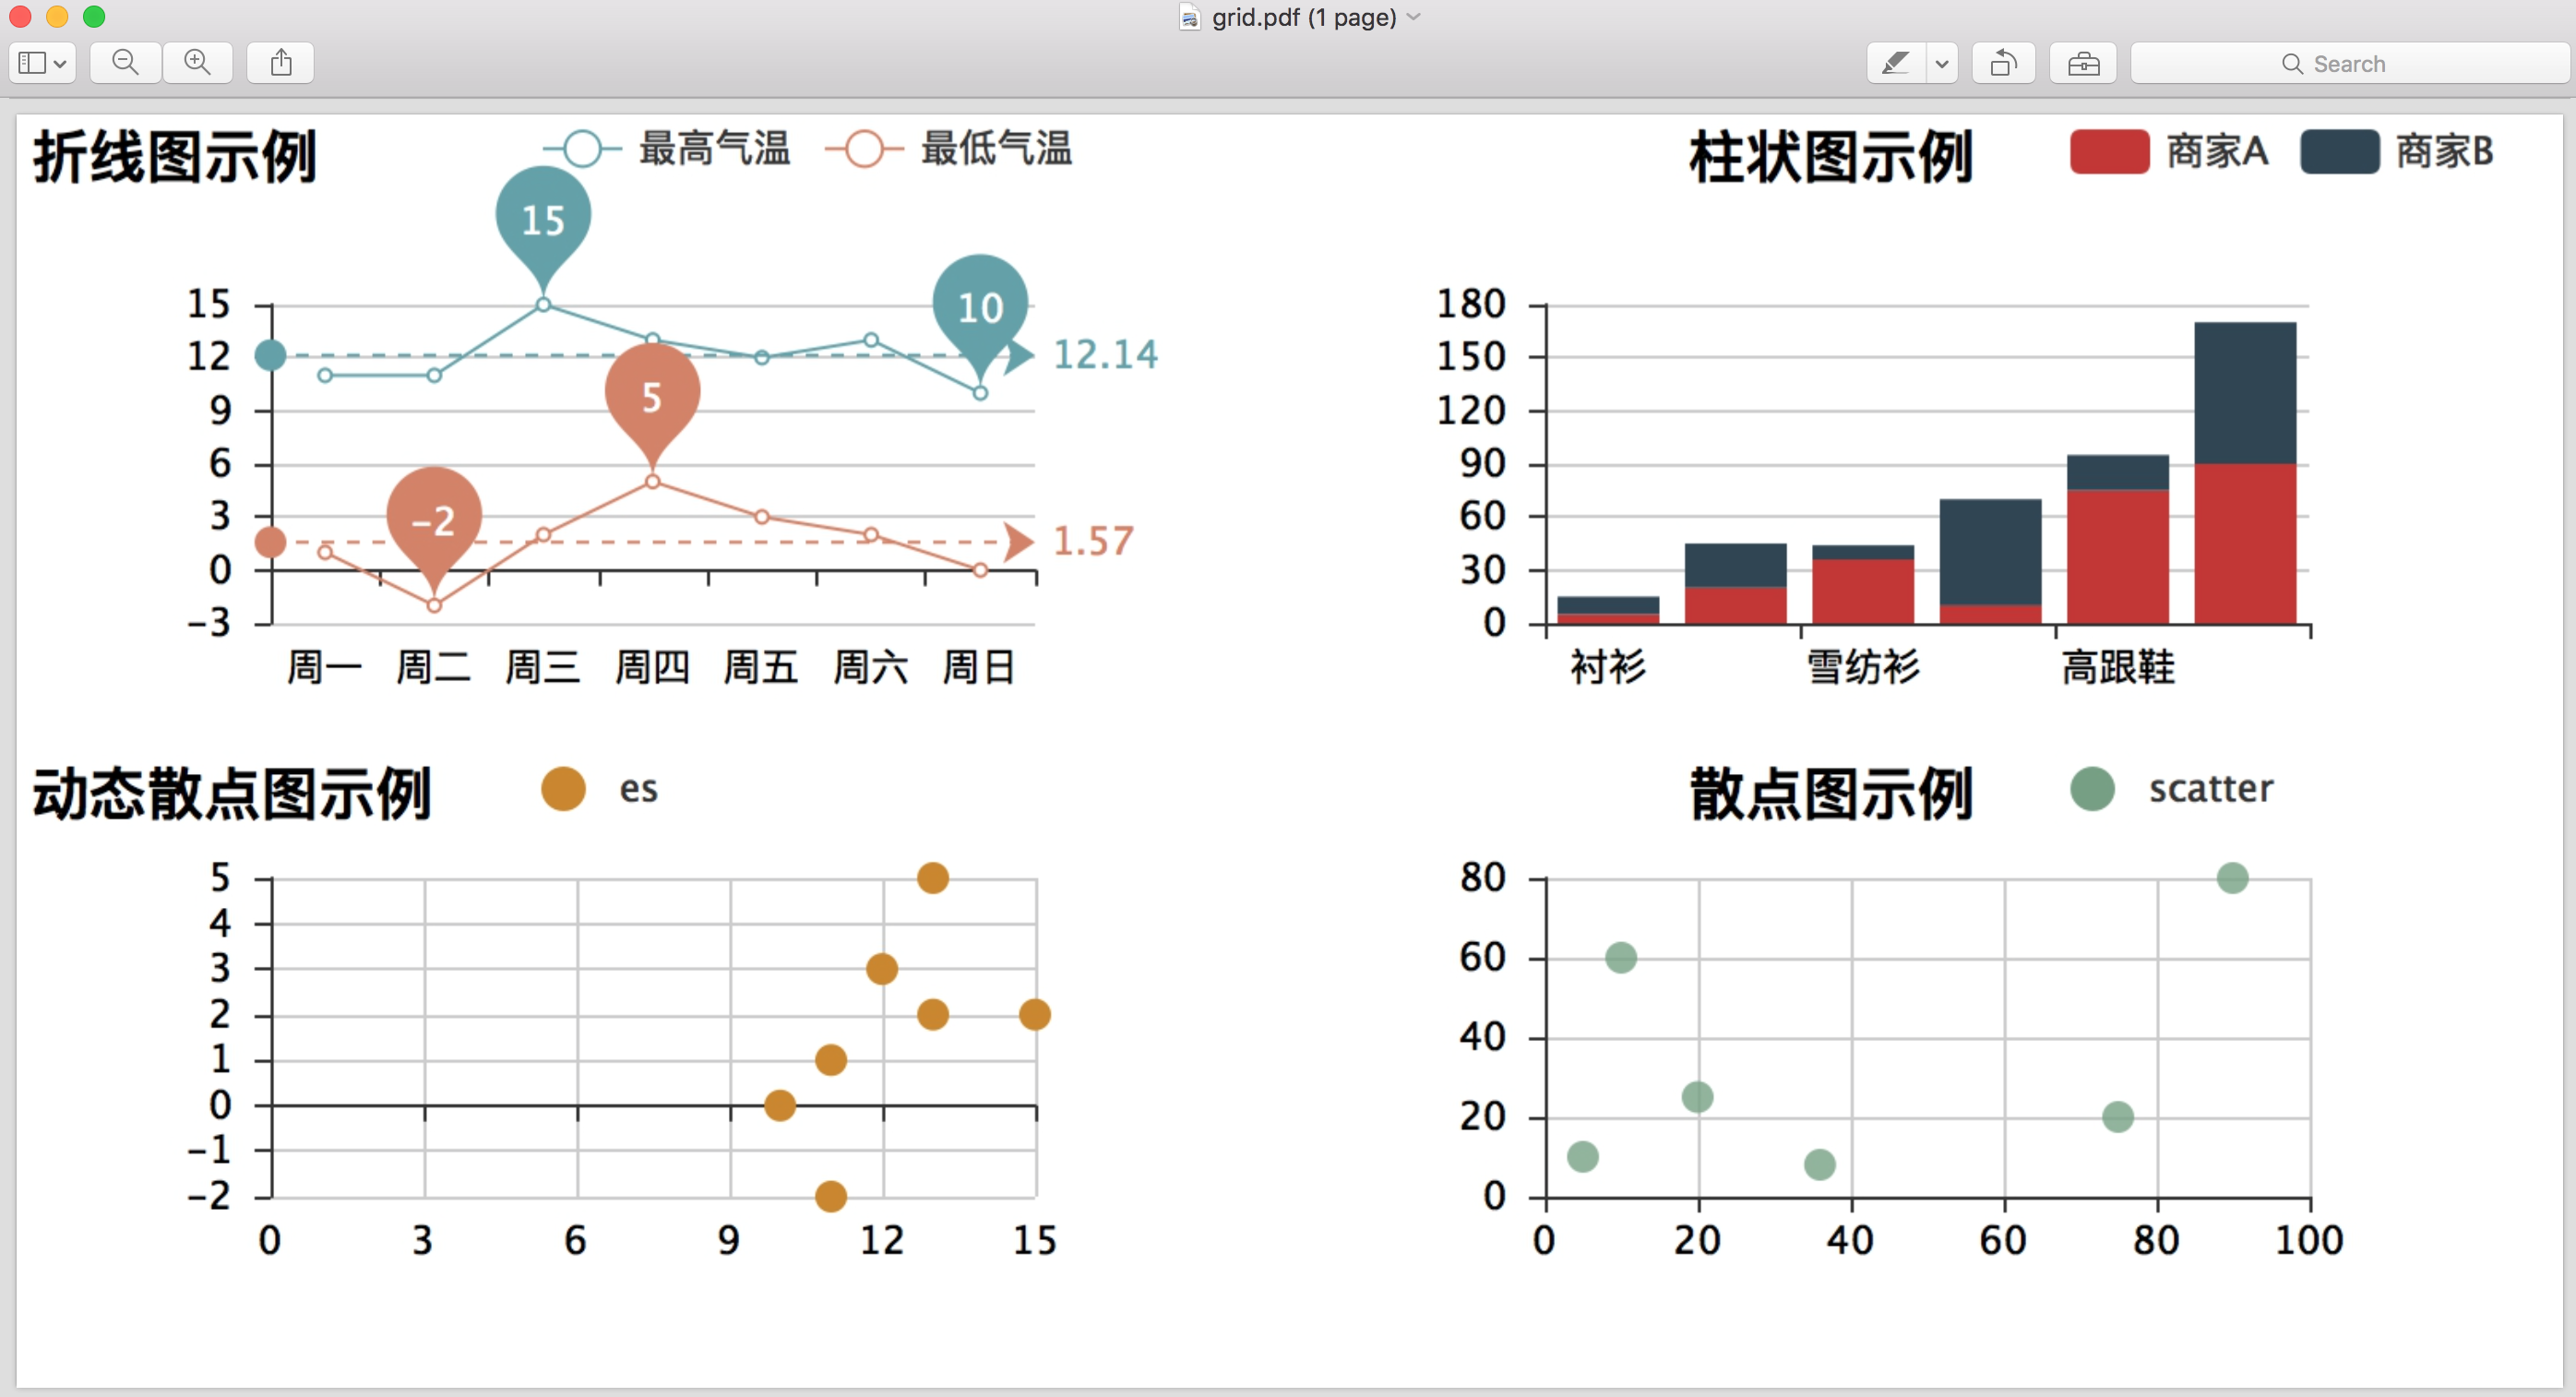
And here the code to generate it
Usage details
Command line options:
$ snapshot output.html [png|jpeg|gif|pdf] delay_in_seconds
where delay_in_seconds tells pyexcel-snapshots to take a snapshot after delay_in_seconds. It is needed only when your snapshot is partial because the chart animation takes long than 0.5 second(default).
Programmatical usage is simple:
...
from pyecharts_snapshot.main import make_a_snapshot

...
somechart.render()
make_a_snapshot('render.html', 'cool_snapshot.png')
where delay as an optional parameter can be given to specify delay_in_seconds.
Example programs
Here’s a fully working example code to get a png image:
# coding=utf-8
from __future__ import unicode_literals
from pyecharts import Bar
from pyecharts_snapshot.main import make_a_snapshot
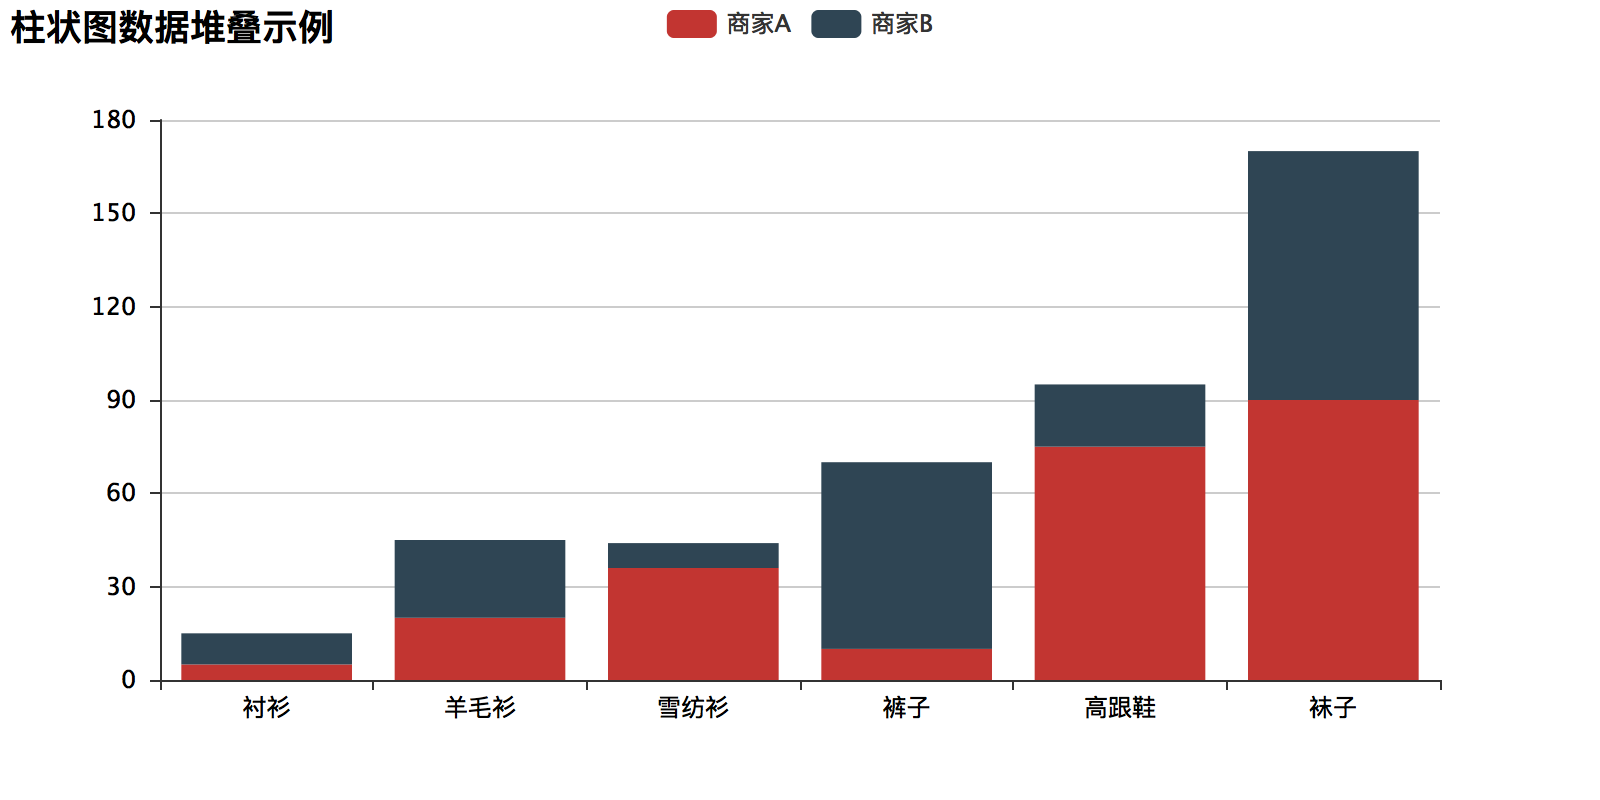
attr = ["衬衫", "羊毛衫", "雪纺衫", "裤子", "高跟鞋", "袜子"]
v1 = [5, 20, 36, 10, 75, 90]
v2 = [10, 25, 8, 60, 20, 80]
bar = Bar("柱状图数据堆叠示例")
bar.add("商家A", attr, v1, is_stack=True)
bar.add("商家B", attr, v2, is_stack=True)
bar.render()
make_a_snapshot('render.html', 'snapshot.png')Here is the snapshot:
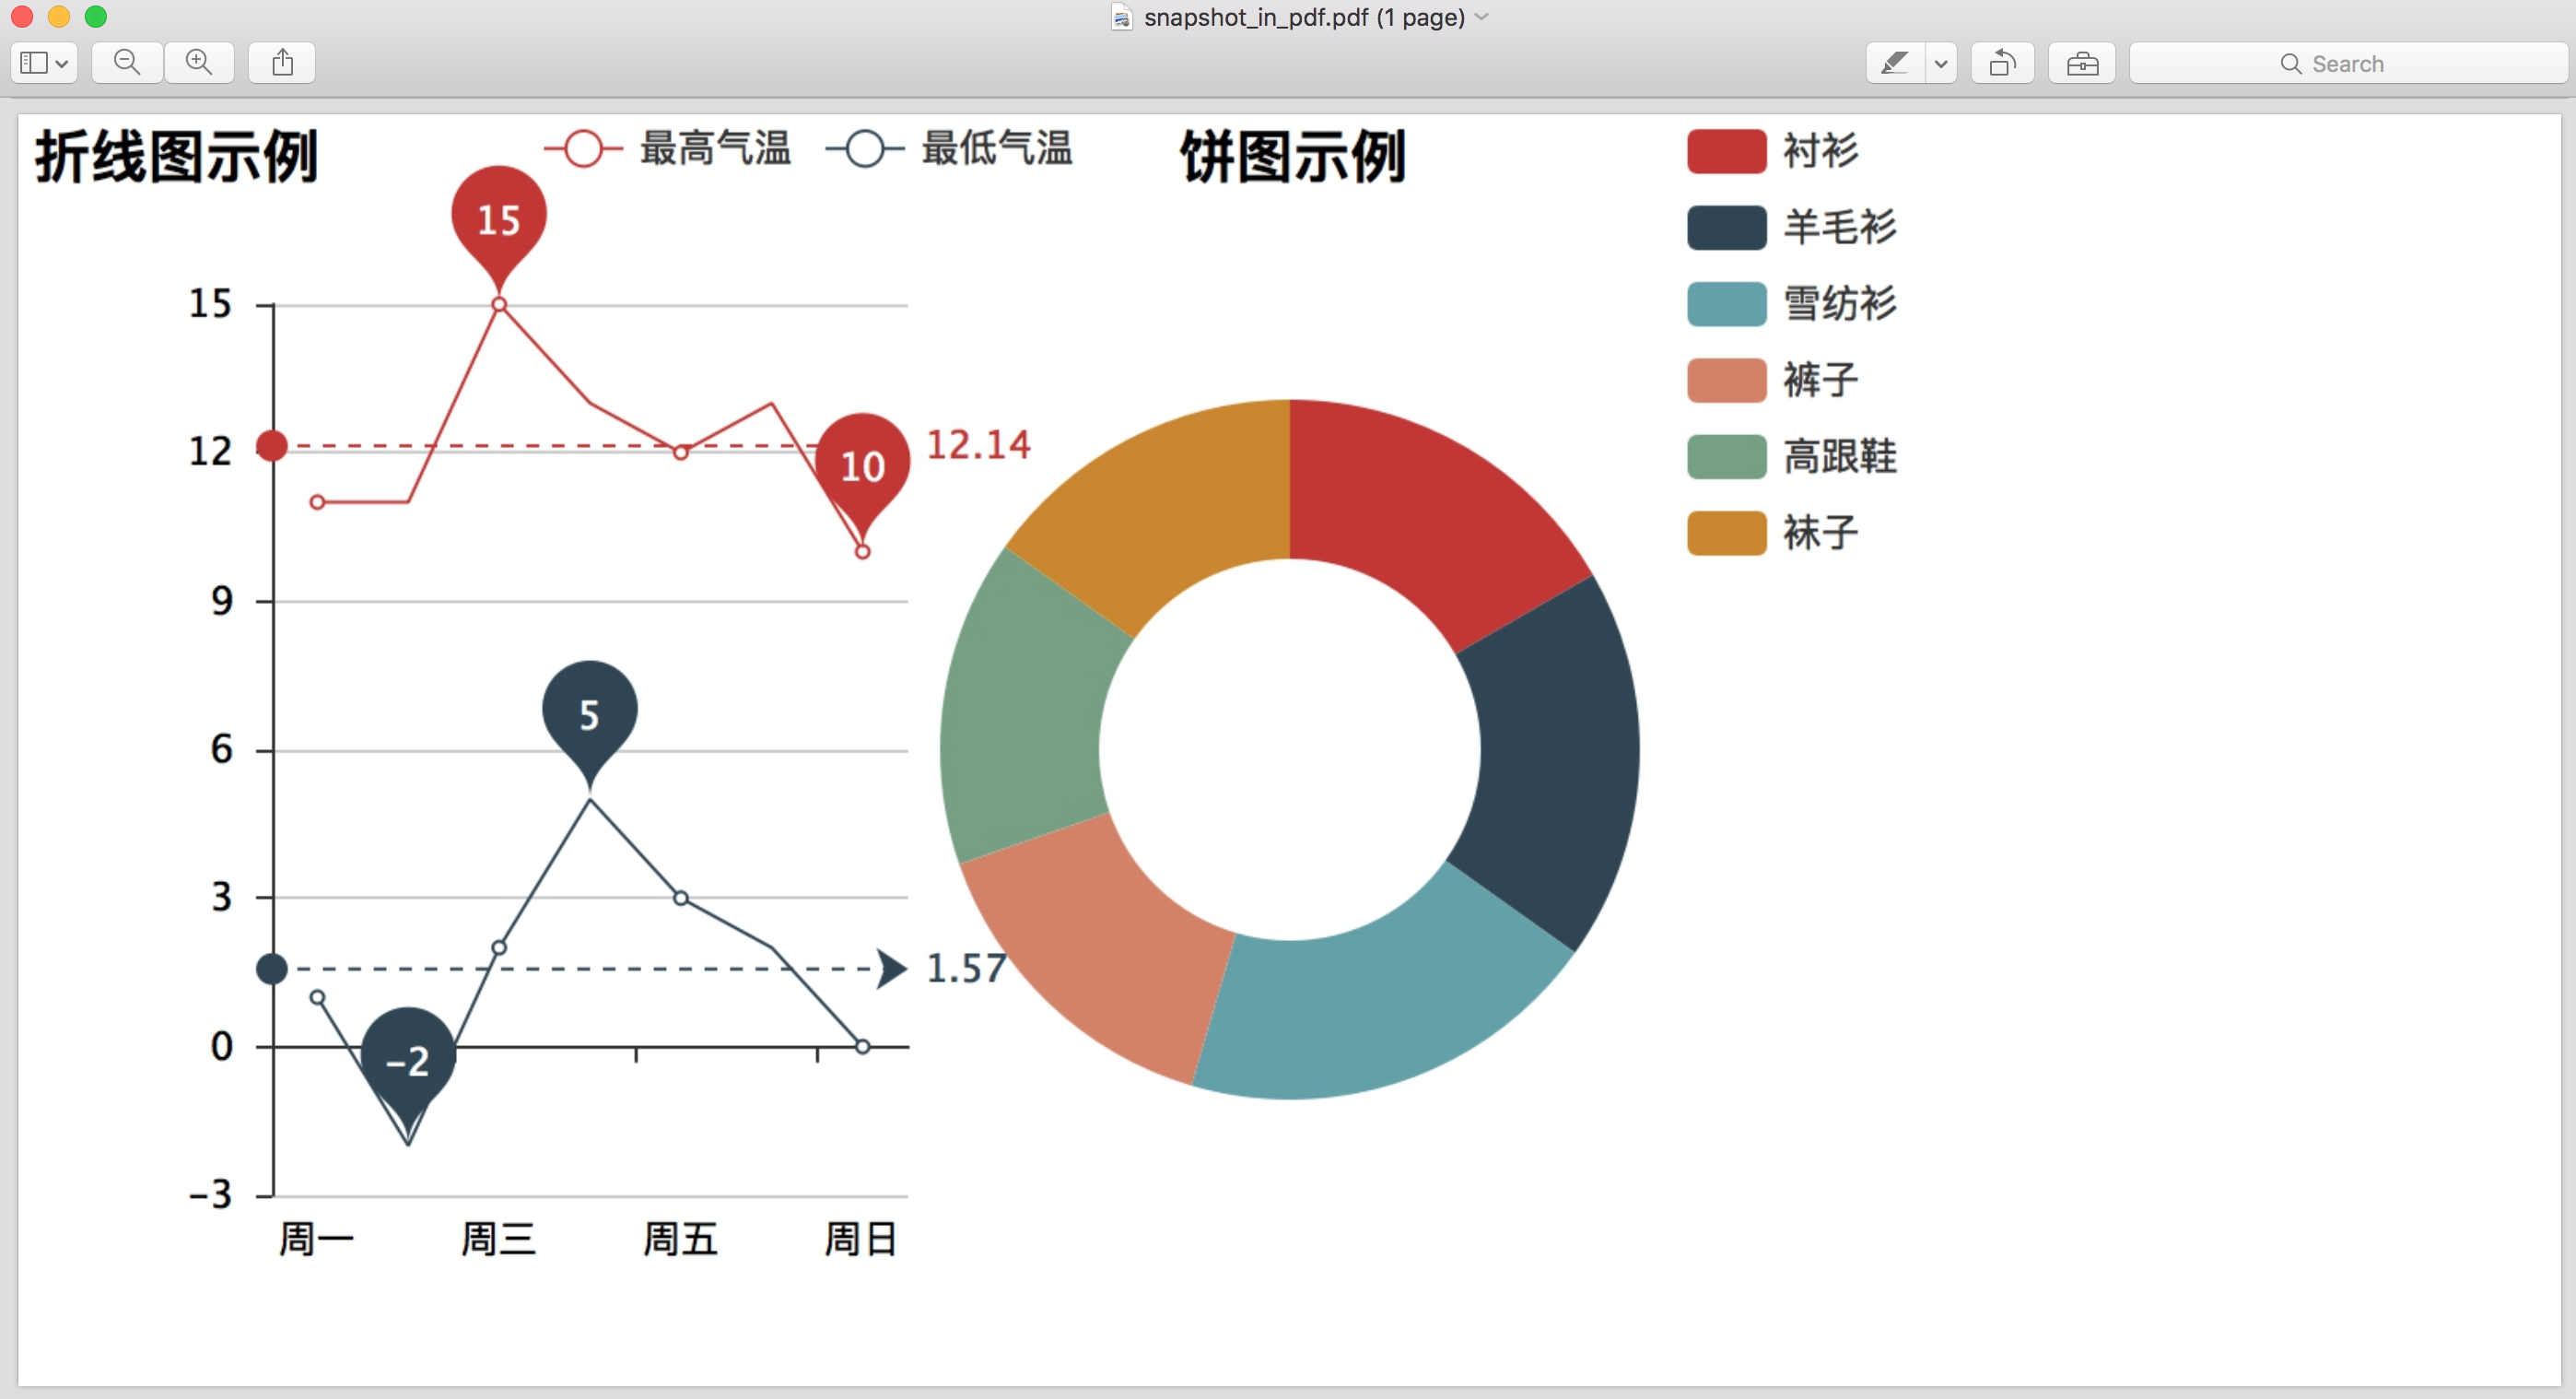
In order to get a pdf file, you can do the following instead:
# coding=utf-8
from __future__ import unicode_literals

from pyecharts import Line, Pie, Grid
from pyecharts_snapshot.main import make_a_snapshot

line = Line("折线图示例", width=1200)
attr = ['周一', '周二', '周三', '周四', '周五', '周六', '周日']
line.add("最高气温", attr, [11, 11, 15, 13, 12, 13, 10],
         mark_point=["max", "min"], mark_line=["average"])
line.add("最低气温", attr, [1, -2, 2, 5, 3, 2, 0], mark_point=["max", "min"],
         mark_line=["average"], legend_pos="20%")
attr = ["衬衫", "羊毛衫", "雪纺衫", "裤子", "高跟鞋", "袜子"]
v1 = [11, 12, 13, 10, 10, 10]
pie = Pie("饼图示例", title_pos="45%")
pie.add("", attr, v1, radius=[30, 55],
        legend_pos="65%", legend_orient='vertical')

grid = Grid()
grid.add(line, grid_right="65%")
grid.add(pie, grid_left="60%")
grid.render()
make_a_snapshot("render.html", 'snapshot.pdf')
Here is the snapshot in pdf:
Installation
Tools dependencies
Please install a node.js binary to your operating system. Simply download the tar ball, extract it and place its bin folder in your PATH.
Next, you will need to issue a magic command:
$ npm install -g phantomjs-prebuiltAt the end, please verify if it is there:
$ which phantomjsOn windows, please try:
C: > phantomjsIf you see it there, continue. Otherwise, start from the beginning, ask for help or thank you for your attention.
Package installation
You can install it via pip:
$ pip install pyecharts-snapshotor clone it and install it:
$ git clone http://github.com/chfw/pyecharts-snapshot.git
$ cd pyecharts-snapshot
$ python setup.py install
Test status
Fully tested on pypy, python 2.6, 2.7, 3.3, 3.4, 3.5 and 3.6.
Constraints
Only one image at a time. No 3D image support
Design Considerations
Ghost.Py: very hard to install on my own. Dropped
Puppeteer: too big to download. Dropped
Maintenance Instructions
install pyecharts-snapshot
make demo
take screenshots of grid.pdf and snapshot.pdf in examples folder
Contributors in alphabetical order
chfw Author
Change log
0.0.7 - 26.08.2017
Save the output of pyecharts to gif file
0.0.6 - 25.08.2017
Allow user to specify a custom delay period in seconds. Default is 0.5s
0.0.5 - 22.08.2017
Save the output of pyecharts to jpeg file
0.0.4 - 19.08.2017
Updated, #1,: Support windows platform.
0.0.3 - 19.08.2017
Remove download image arrow on the output file
0.0.2 - 18.08.2017
Save the output of pyecharts to pdf file
0.0.1 - 17.08.2017
Save the output of pyecharts to png file
Release history Release notifications | RSS feed


Download files
Download the file for your platform. If you're not sure which to choose, learn more about installing packages.
Source Distribution
Built Distribution
Filter files by name, interpreter, ABI, and platform.
If you're not sure about the file name format, learn more about wheel file names.
Copy a direct link to the current filters
File details
Details for the file pyecharts-snapshot-0.0.7.tar.gz.
File metadata
- Download URL: pyecharts-snapshot-0.0.7.tar.gz
- Upload date:
- Size: 6.5 kB
- Tags: Source
- Uploaded using Trusted Publishing? No
File hashes
| Algorithm | Hash digest | |
|---|---|---|
| SHA256 |
c45dd04bd24f60ee071cad410b59d3991529fb828b9eb6c46814ea5f083d7a19
|
|
| MD5 |
cd1b53dba10d306b0a58eb00173064d4
|
|
| BLAKE2b-256 |
80c8db013fc85ffb50f291d64482719482d50f35eed39df078757dab0b6de475
|
File details
Details for the file pyecharts_snapshot-0.0.7-py2.py3-none-any.whl.
File metadata
- Download URL: pyecharts_snapshot-0.0.7-py2.py3-none-any.whl
- Upload date:
- Size: 9.0 kB
- Tags: Python 2, Python 3
- Uploaded using Trusted Publishing? No
File hashes
| Algorithm | Hash digest | |
|---|---|---|
| SHA256 |
e9ee40f6f2fd48175d0acc0b5e0633646ebfd417c7c932134aab51e0722bb196
|
|
| MD5 |
30c526e3930bc57ad48c9dd9afd6b202
|
|
| BLAKE2b-256 |
1ebc4f405a7c704ded93f1b6ba12b482d5bf08f6492d896d6eb687f96ee8ccca
|


