pygwalker: Combining Jupyter Notebook with a Tableau-like UI

Project description
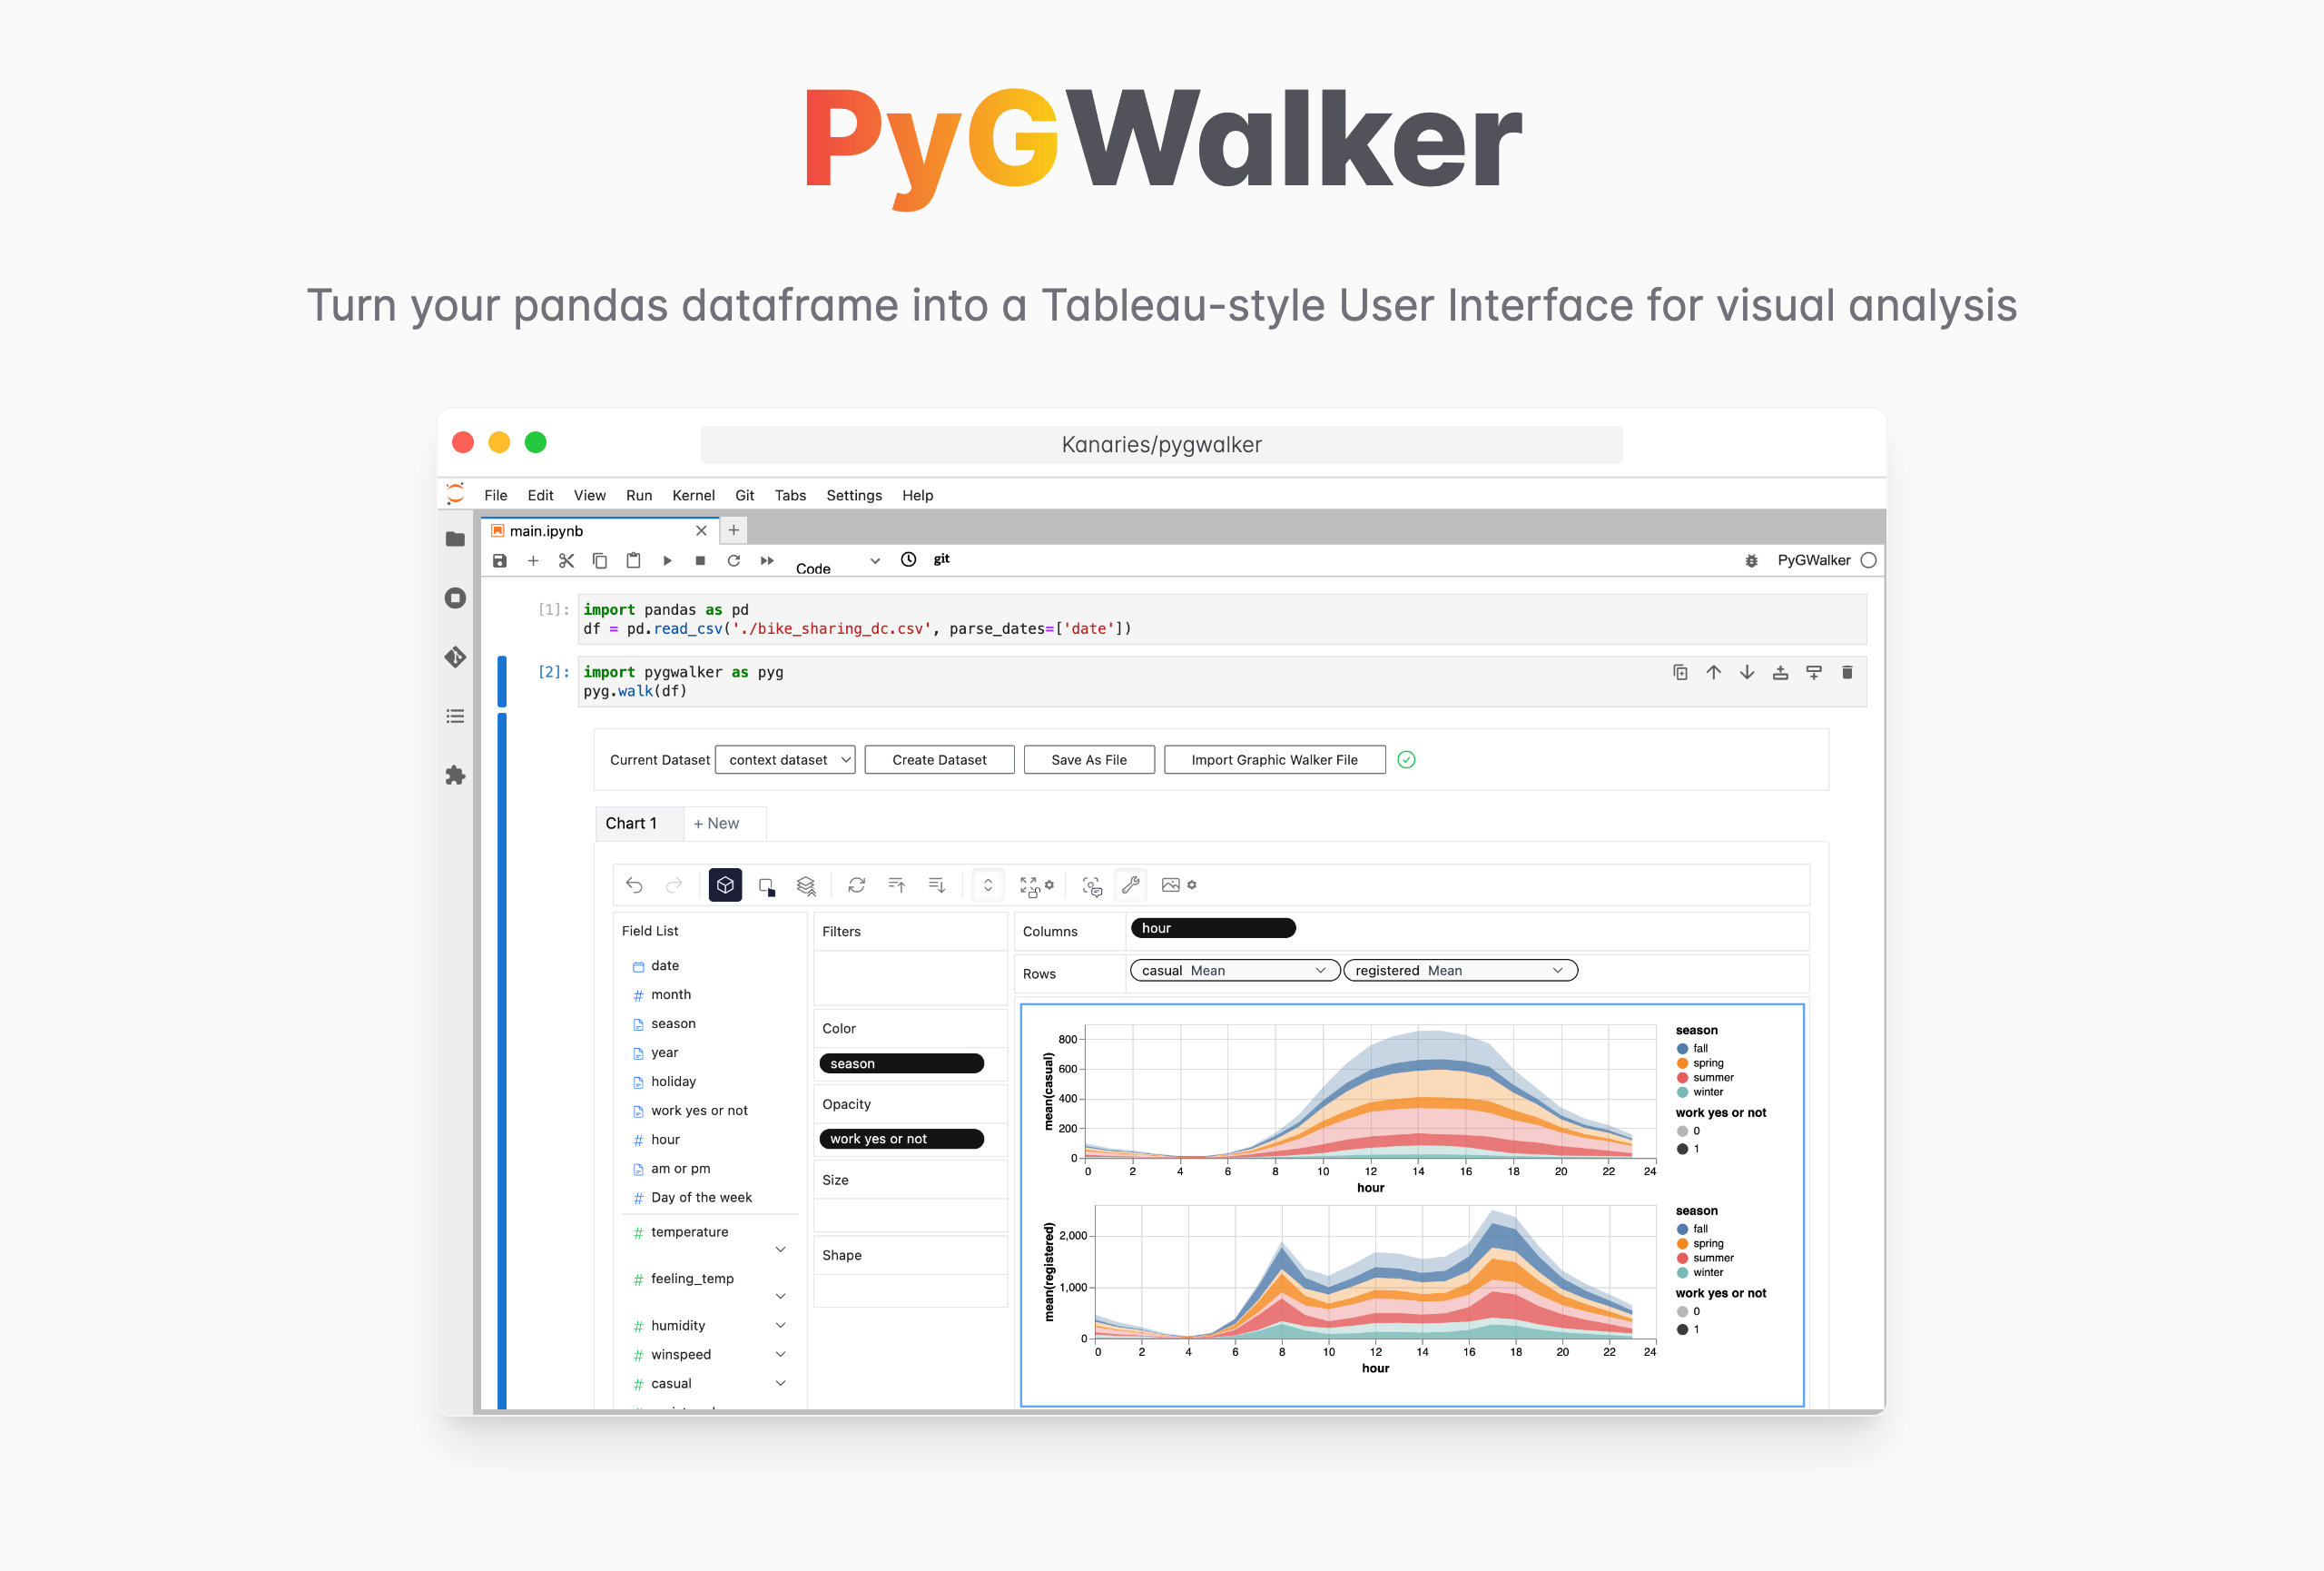
PyGWalker: A Python Library for Exploratory Data Analysis with Visualization


PyGWalker can simplify your Jupyter Notebook data analysis and data visualization workflow. By turning your pandas dataframe into a Tableau-style User Interface for visual exploration.
PyGWalker (pronounced like "Pig Walker", just for fun) is named as an abbreviation of "Python binding of Graphic Walker". It intergrates Jupyter Notebook (or other jupyter-based notebooks) with Graphic Walker, a different type of open-source alternative to Tableau. It allows data scientists to analyze data and visualize patterns with simple drag-and-drop operations.
Visit Google Colab, Kaggle Code, 
PyGWalker will add more support such as R in the future.
Getting Started
Tested Environments
- Jupyter Notebook
- Google Colab
- Kaggle Code
- Jupyter Lab (WIP: There're still some tiny CSS issues)
- Visual Studio Code
- ...feel free to raise an issue for more environments.
| Run in Kaggle | Run in Colab |
|---|---|
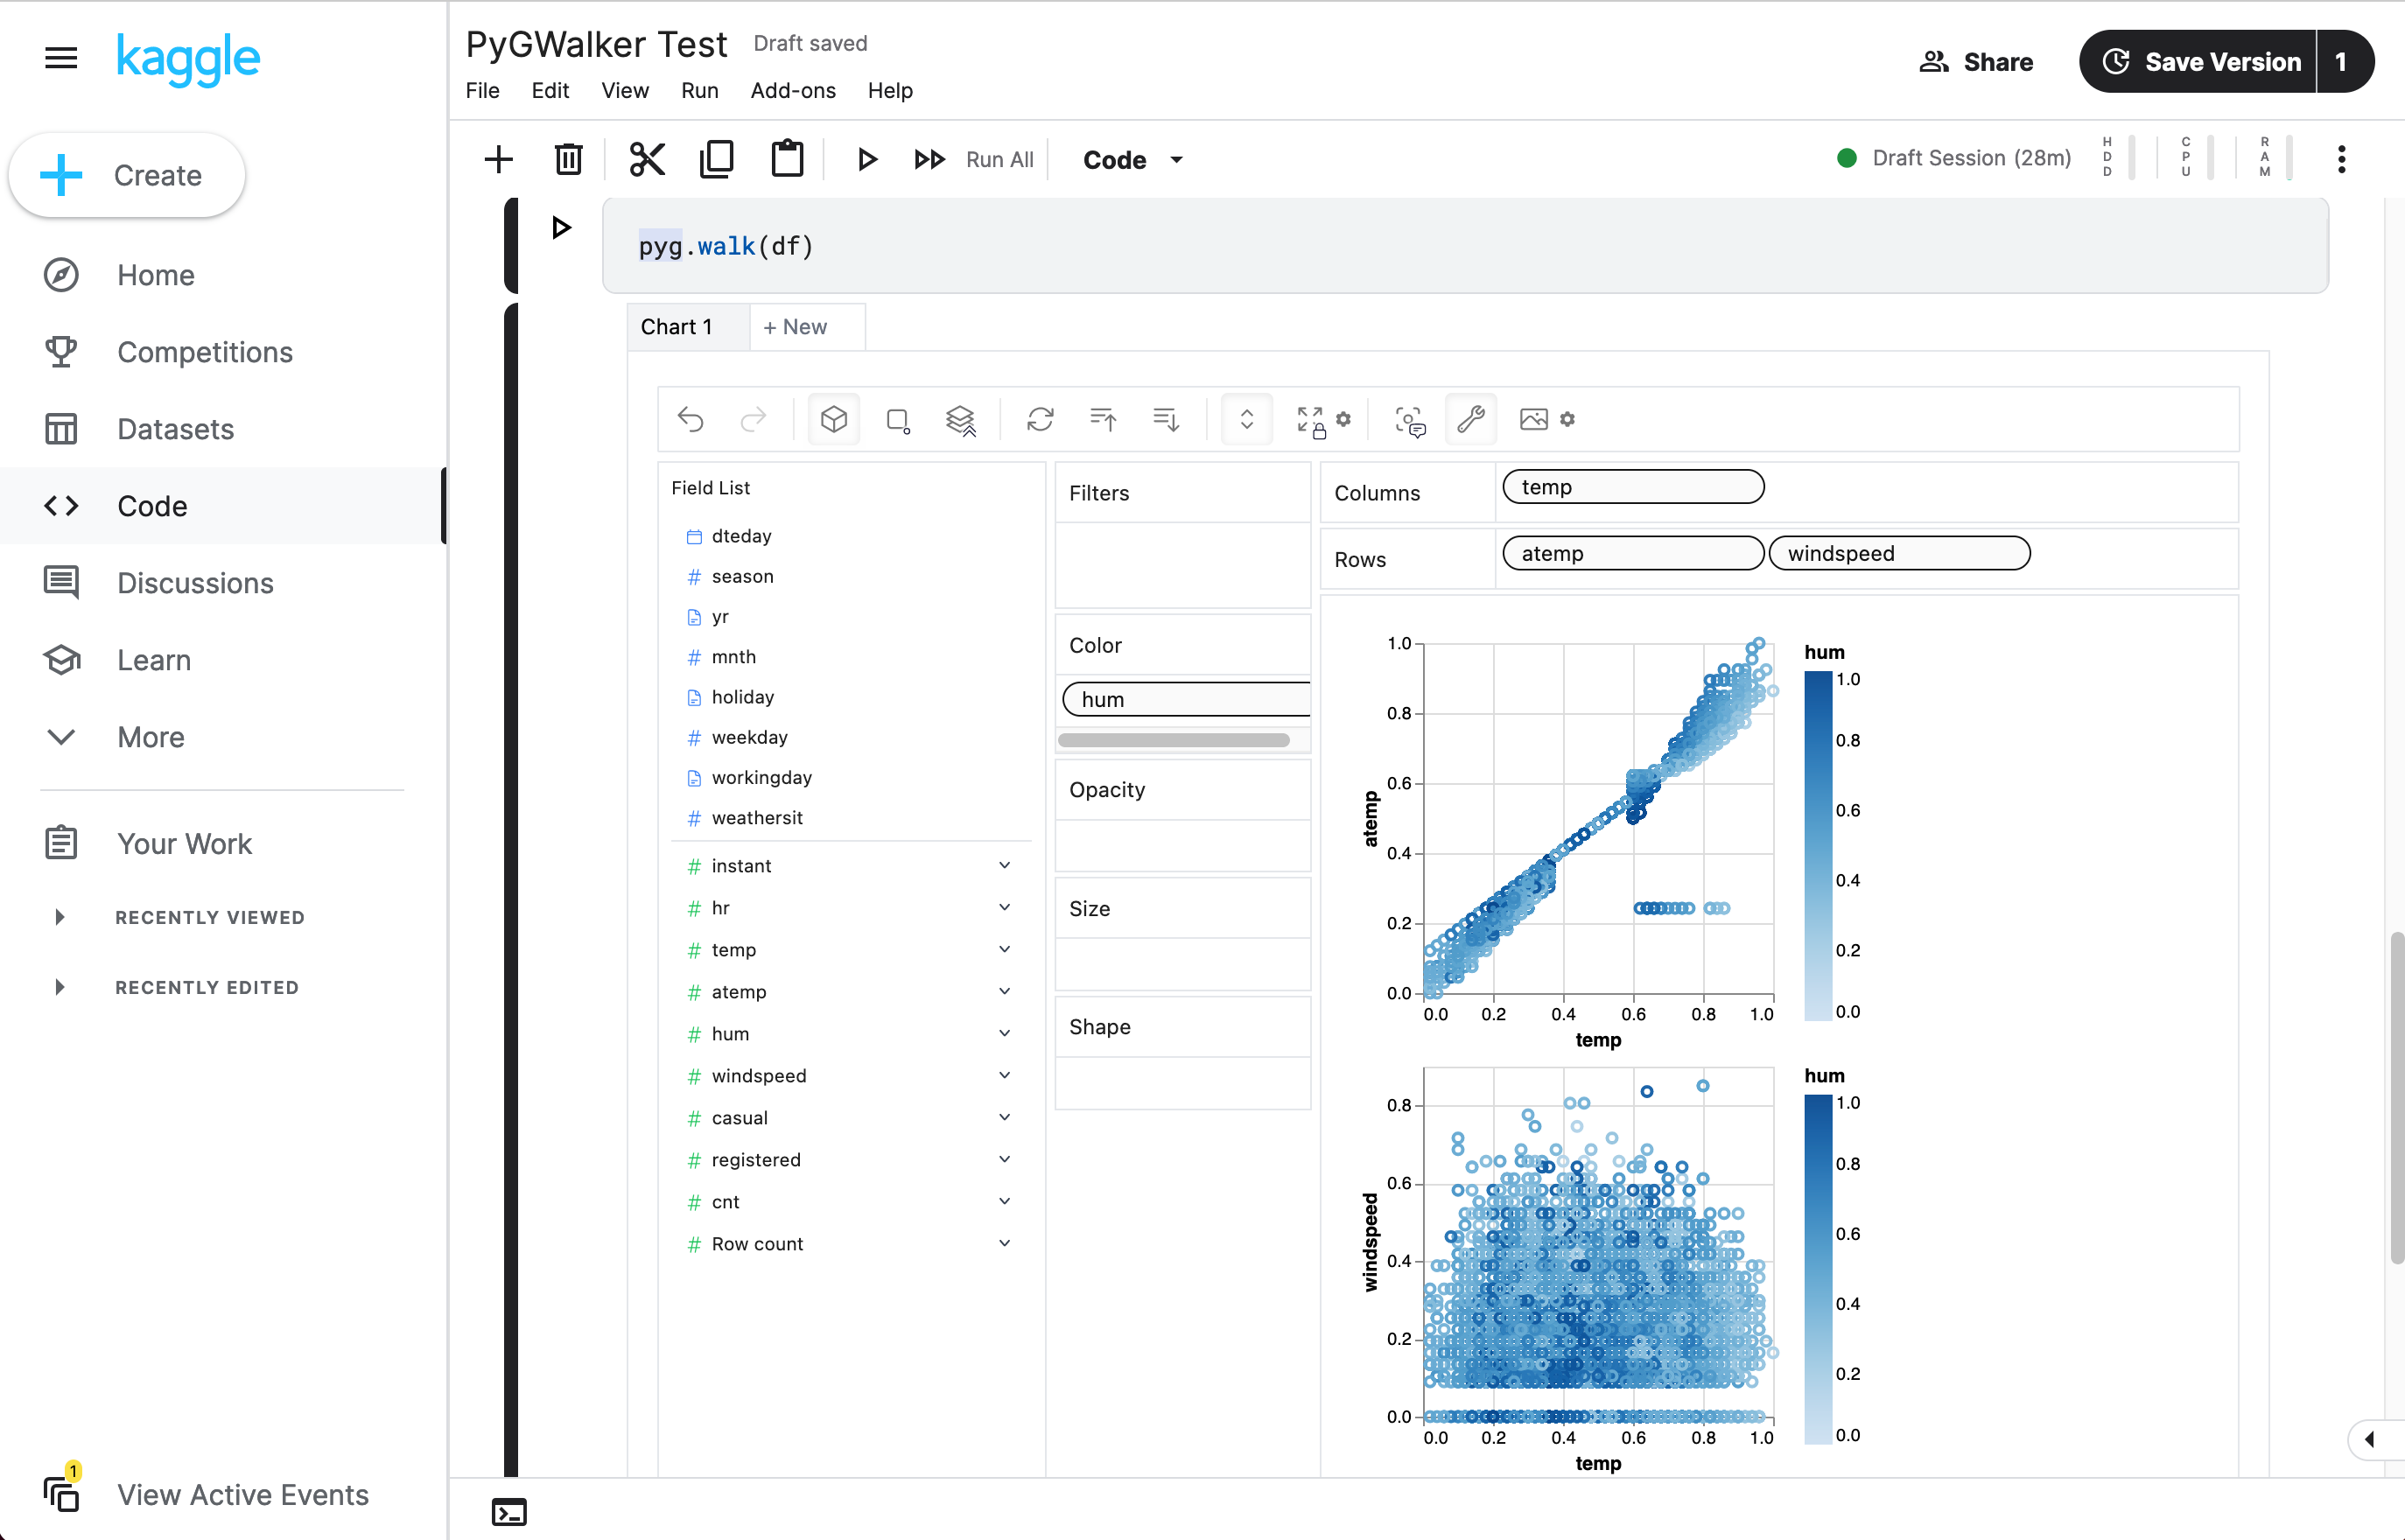
|
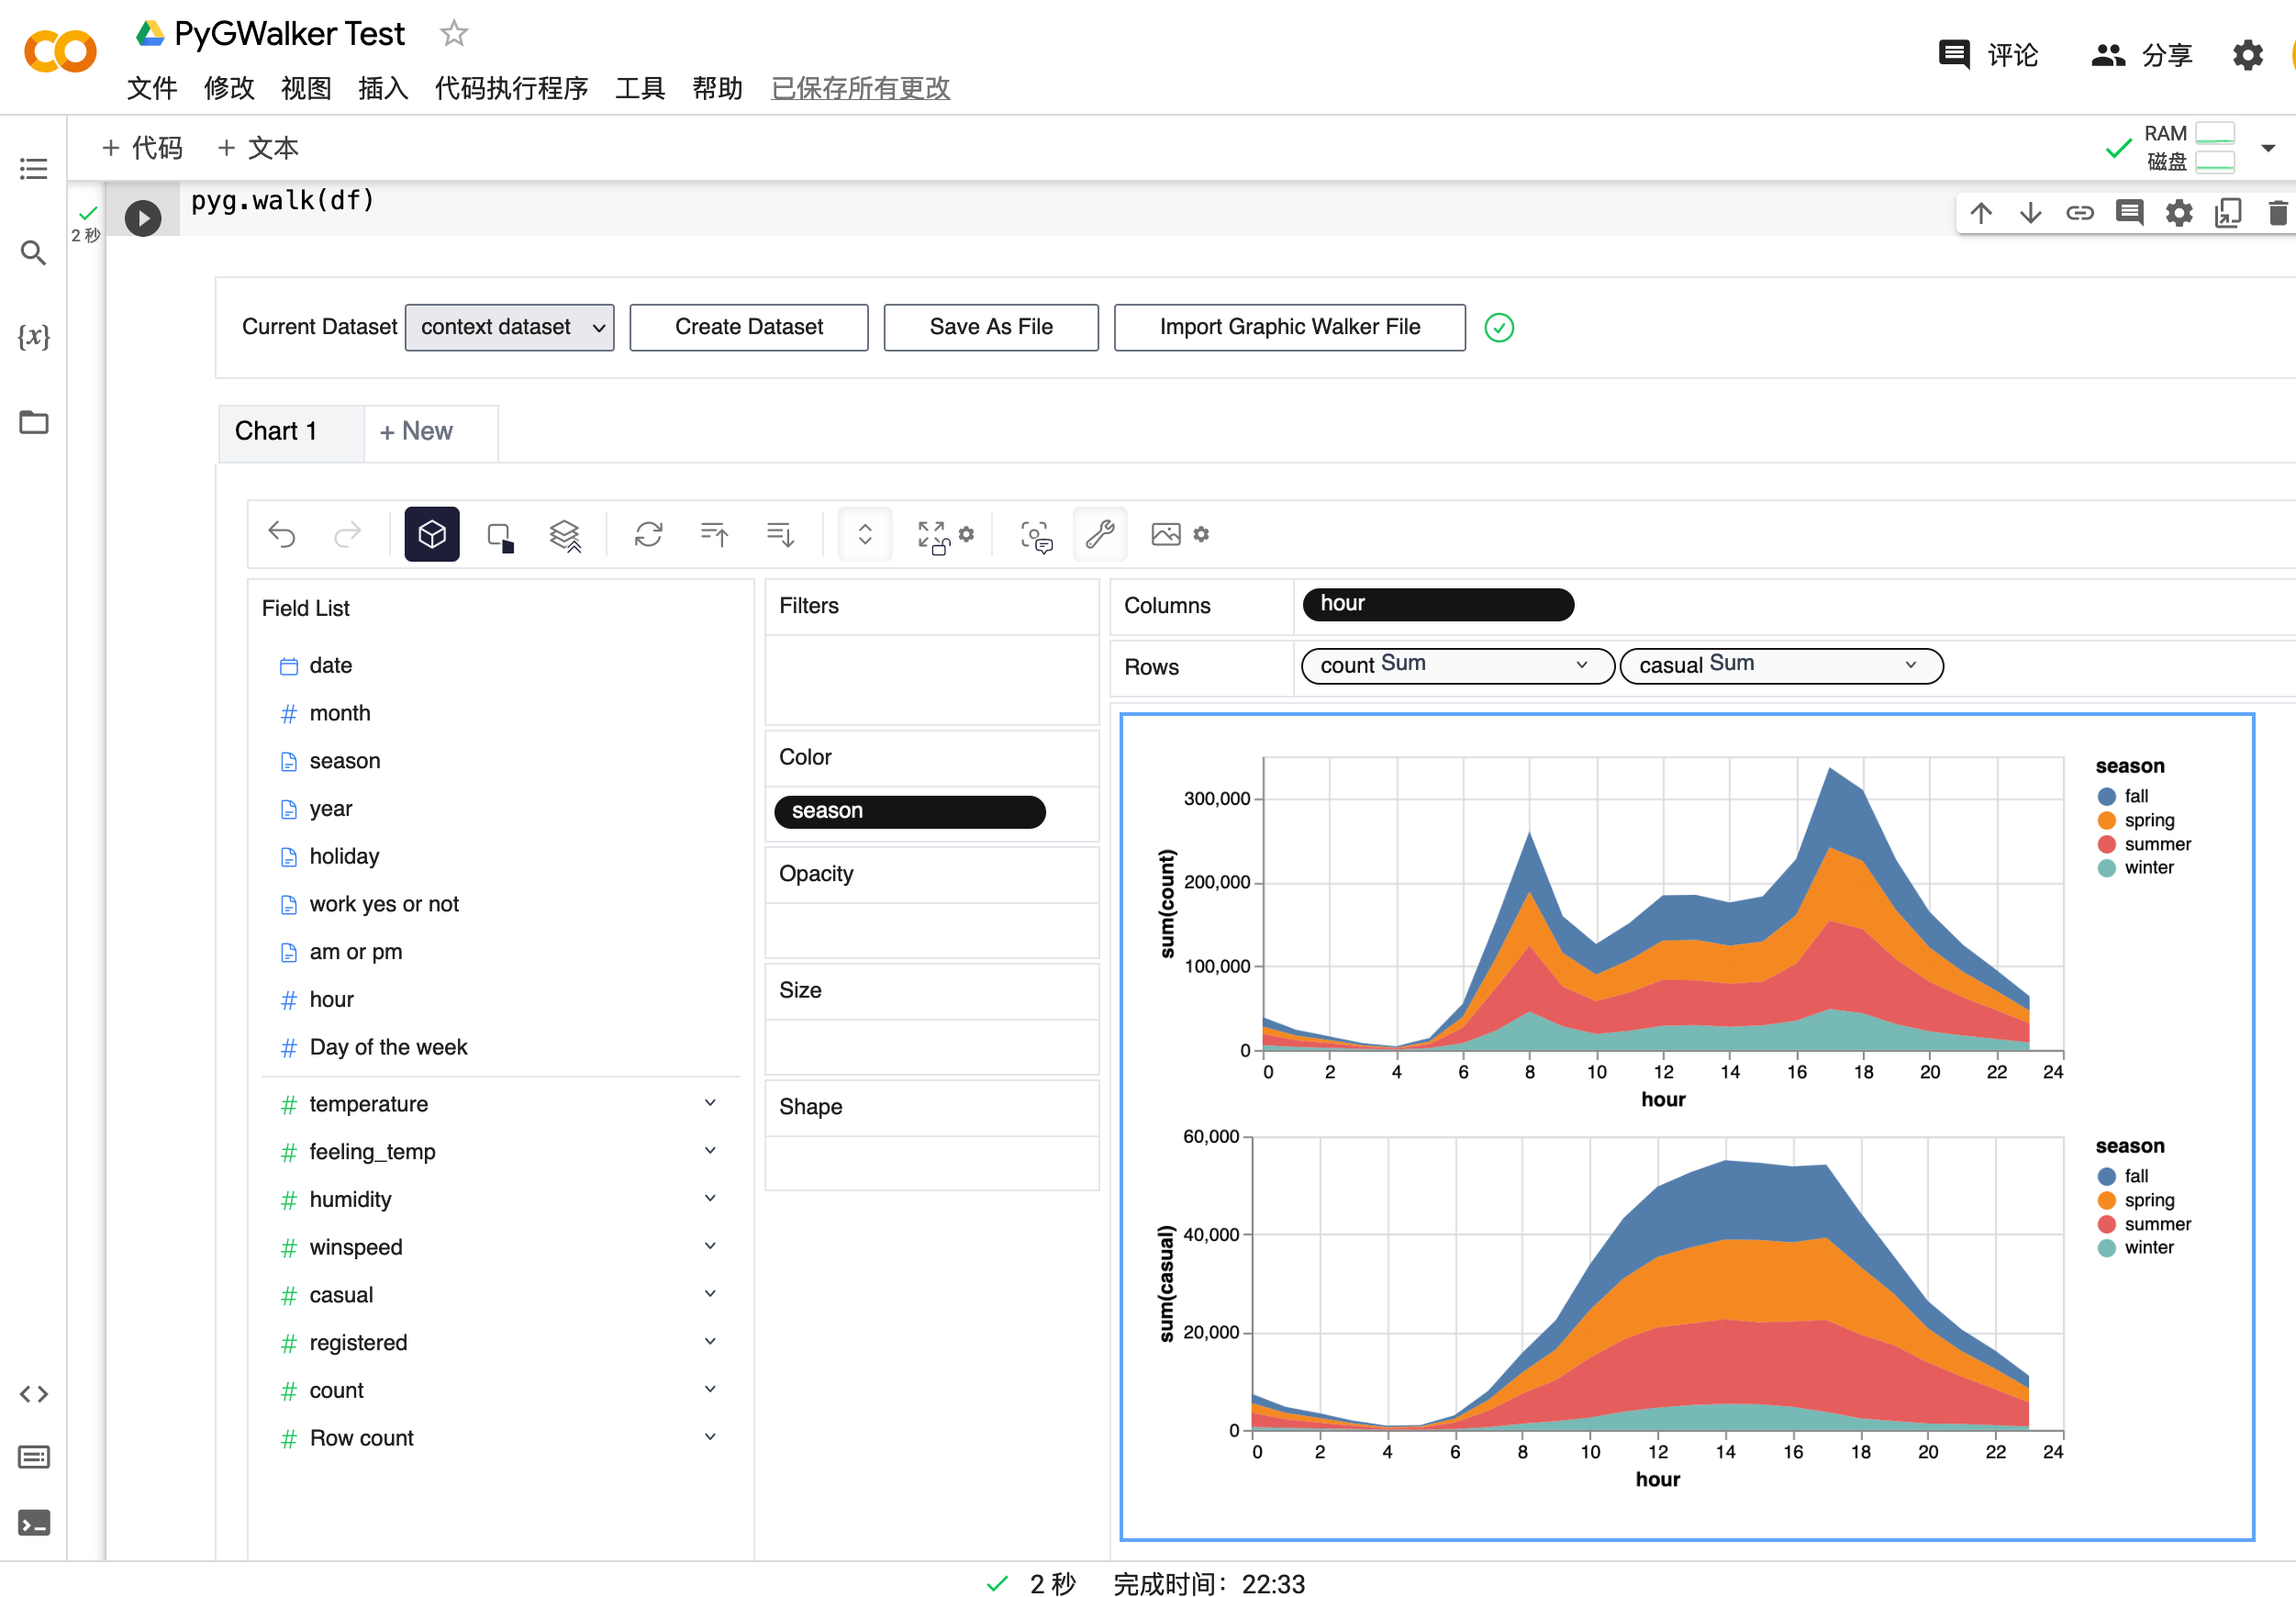
|
Setup pygwalker
Before using pygwalker, make sure to install the packages through the command line using pip.
pip install pygwalker
Use pygwalker in Jupyter Notebook
Import pygwalker and pandas to your Jupyter Notebook to get started.
import pandas as pd
import pygwalker as pyg
You can use pygwalker without changing your existing workflow. For example, you can call up Graphic Walker with the dataframe loaded in this way:
df = pd.read_csv('./bike_sharing_dc.csv', parse_dates=['date'])
gwalker = pyg.walk(df)
You can even try it online, simply visiting
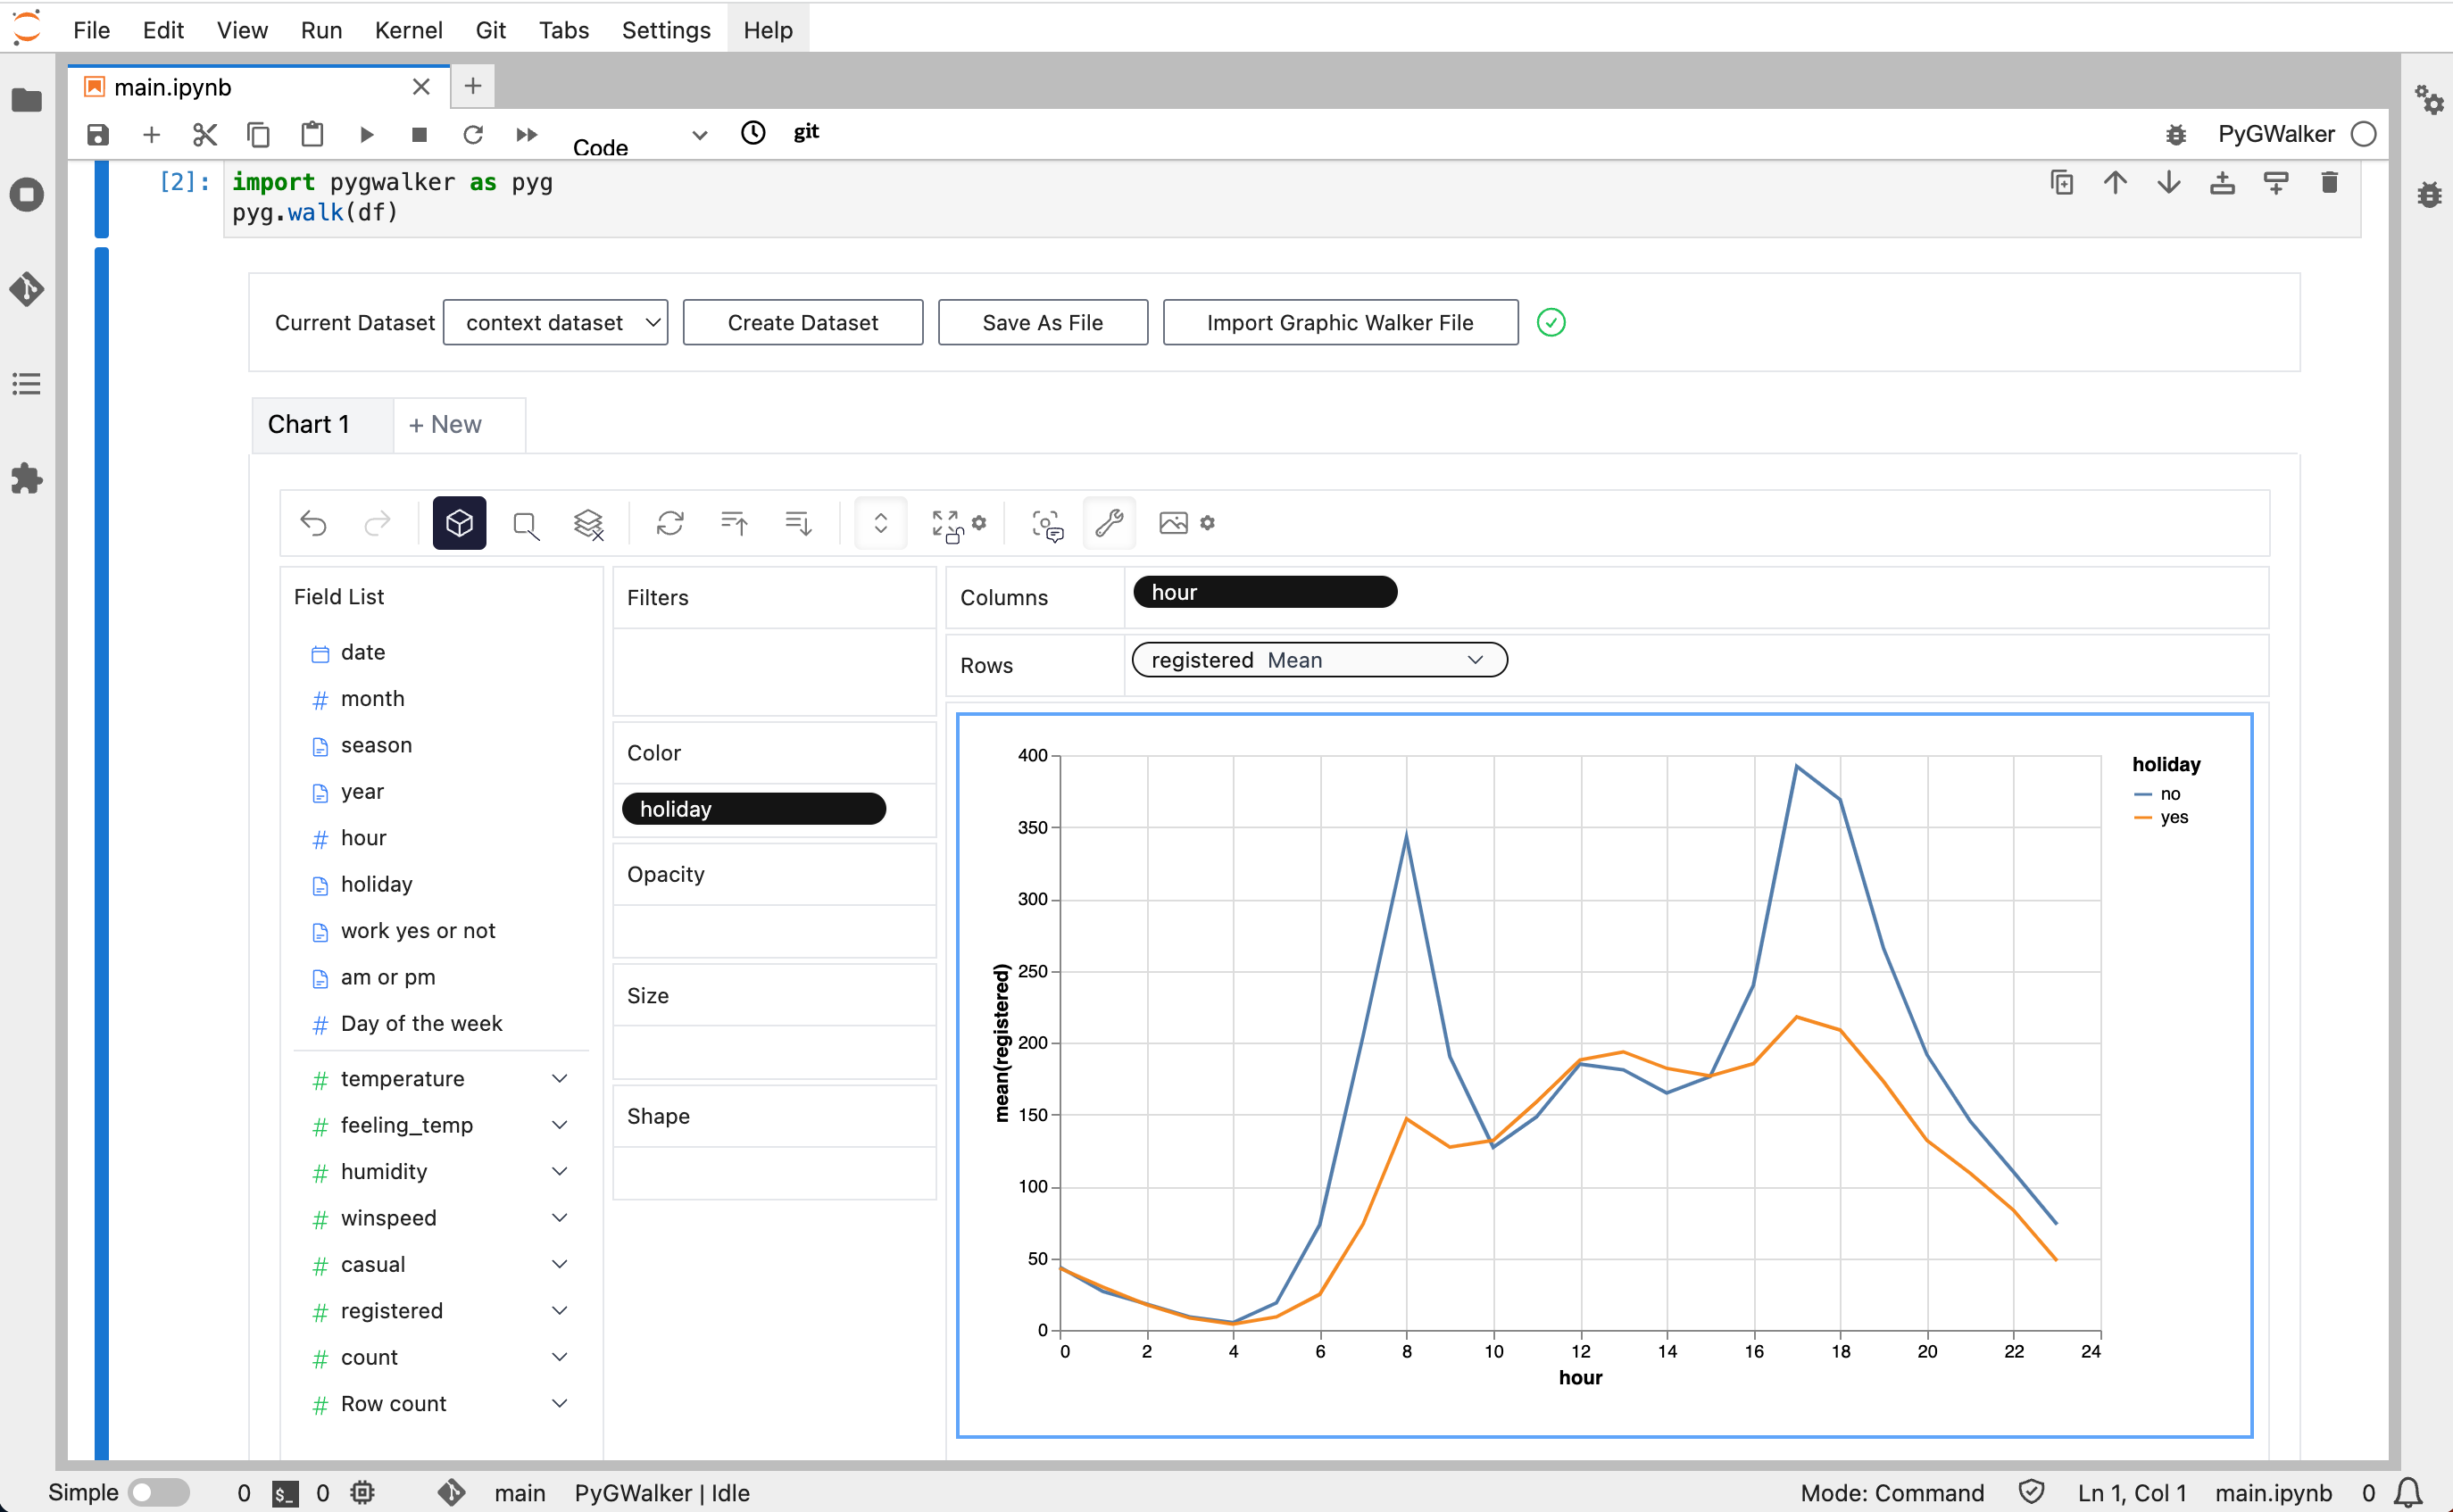
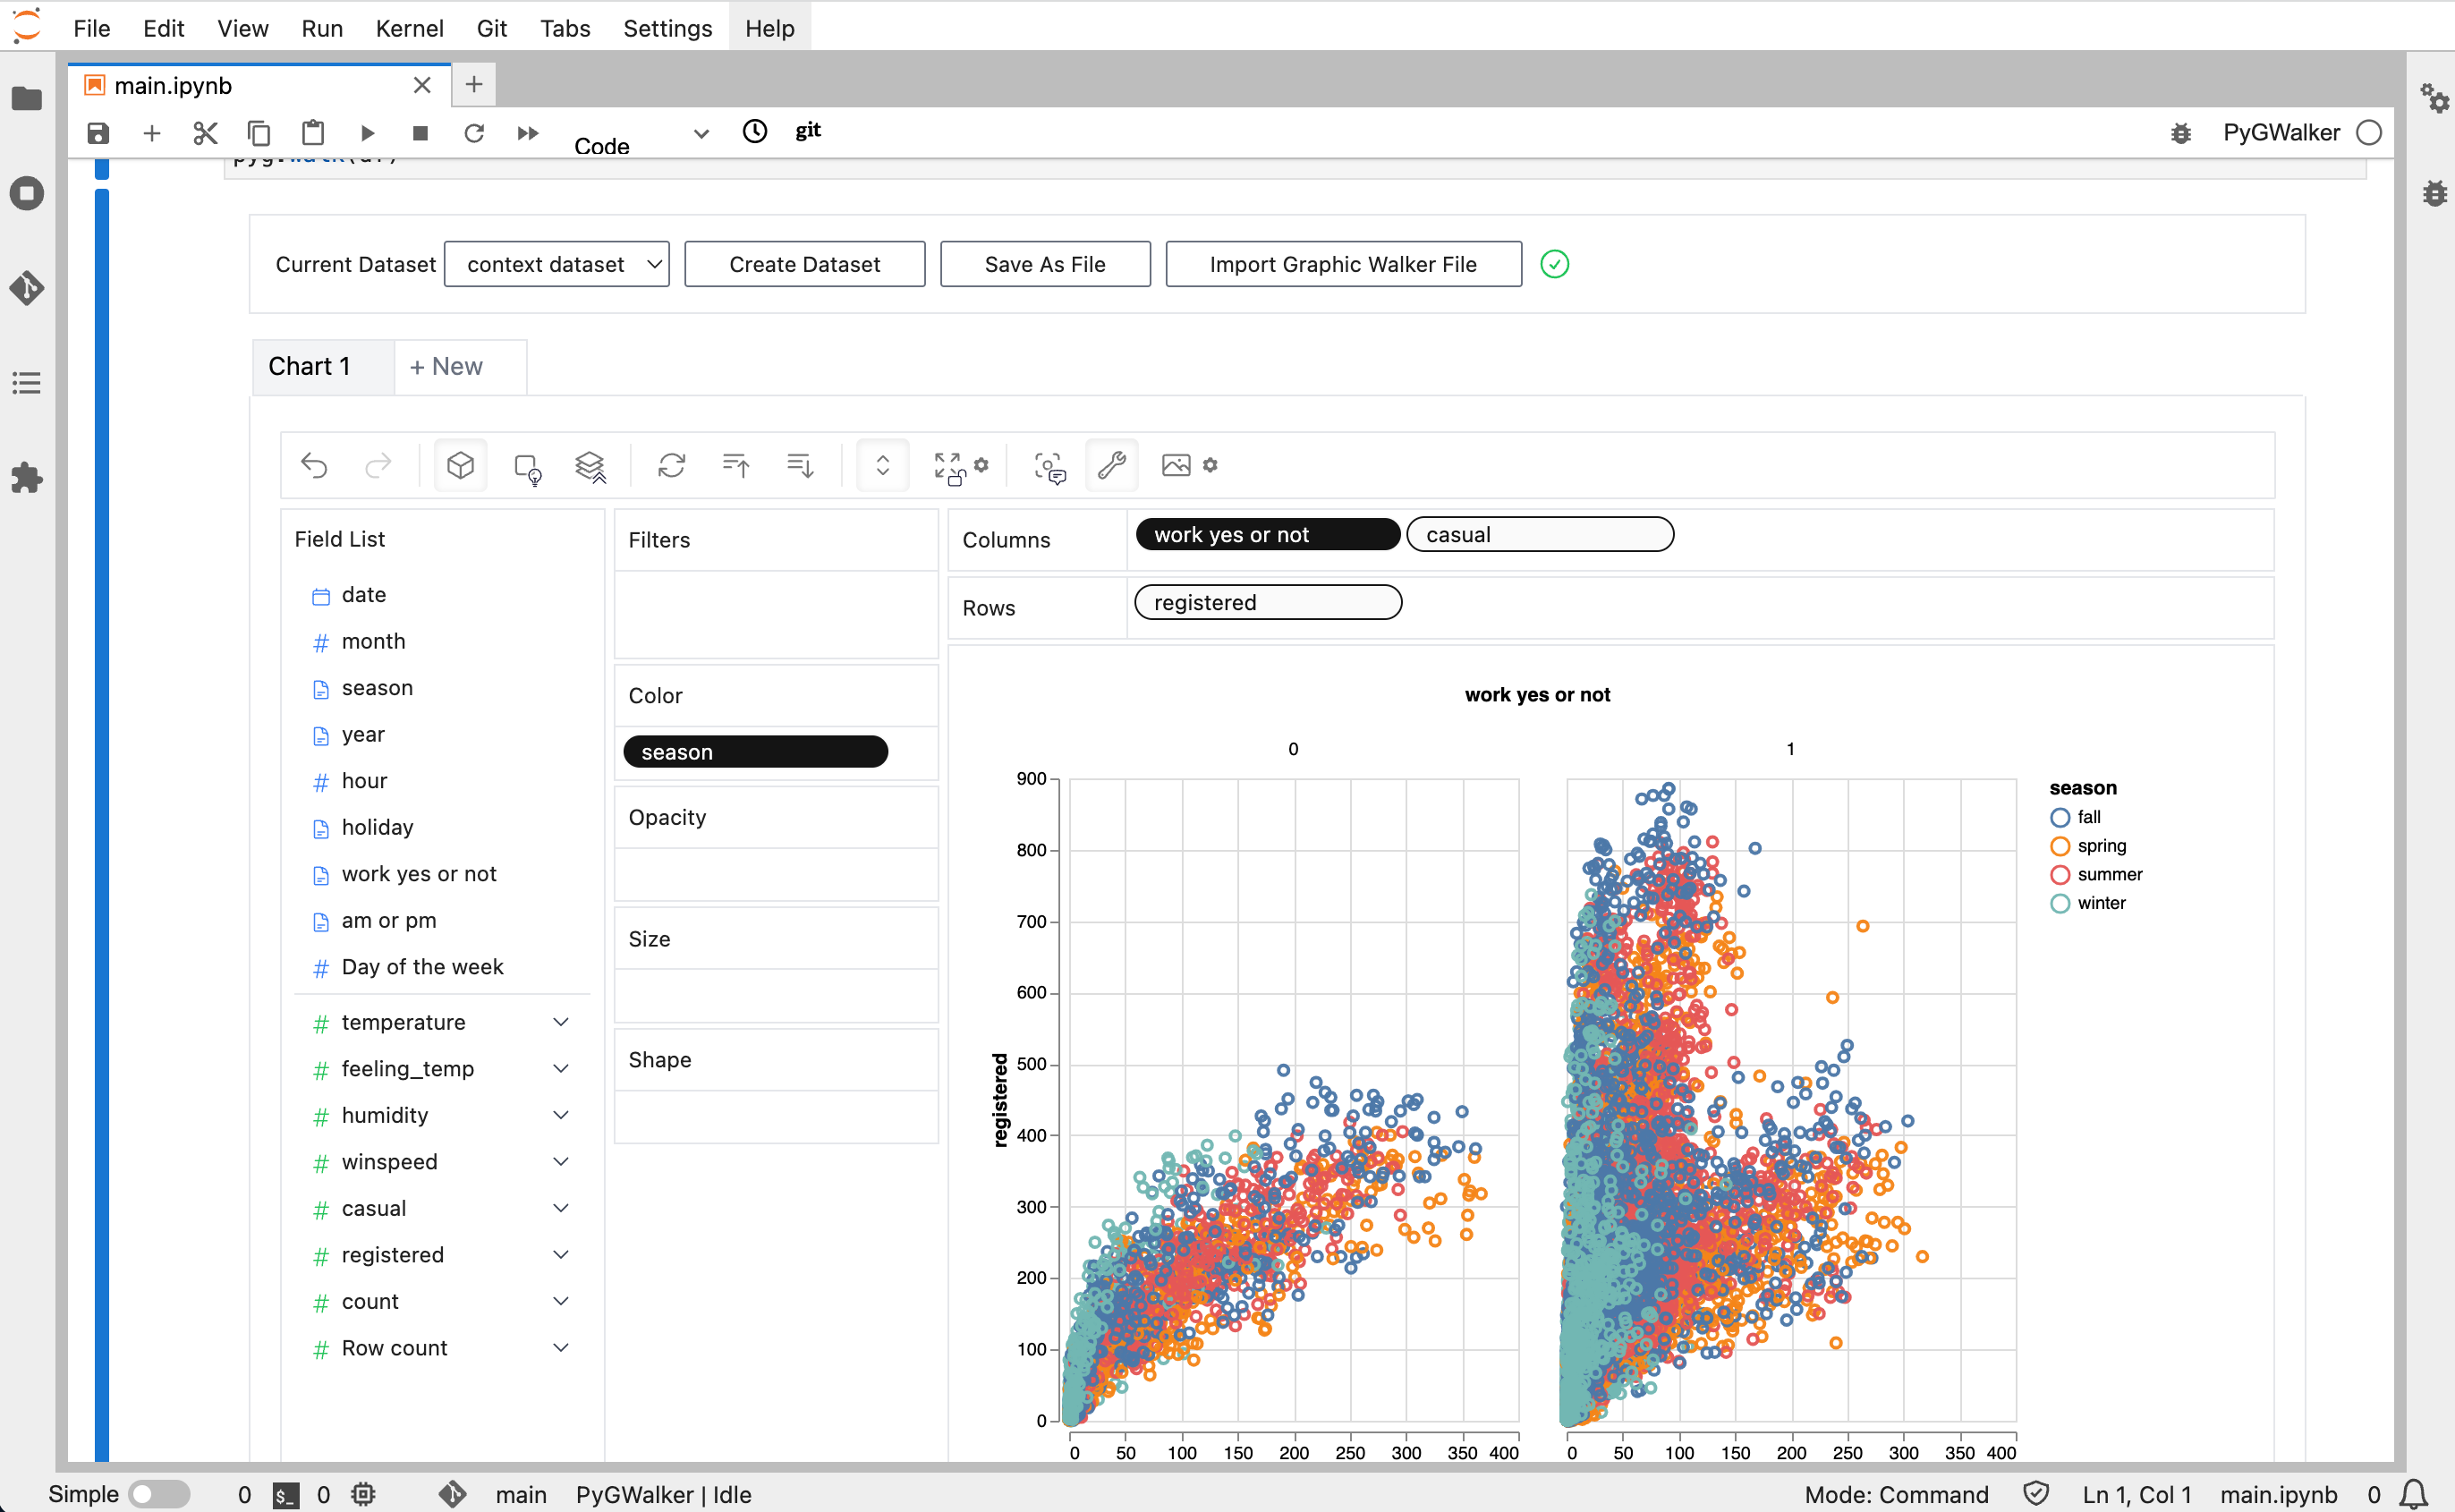
That's it. Now you have a Tableau-like user interface to analyze and visualize data by dragging and dropping variables.
Cool things you can do with Graphic Walker:
- You can change the mark type into others to make different charts, for example, a line chart:
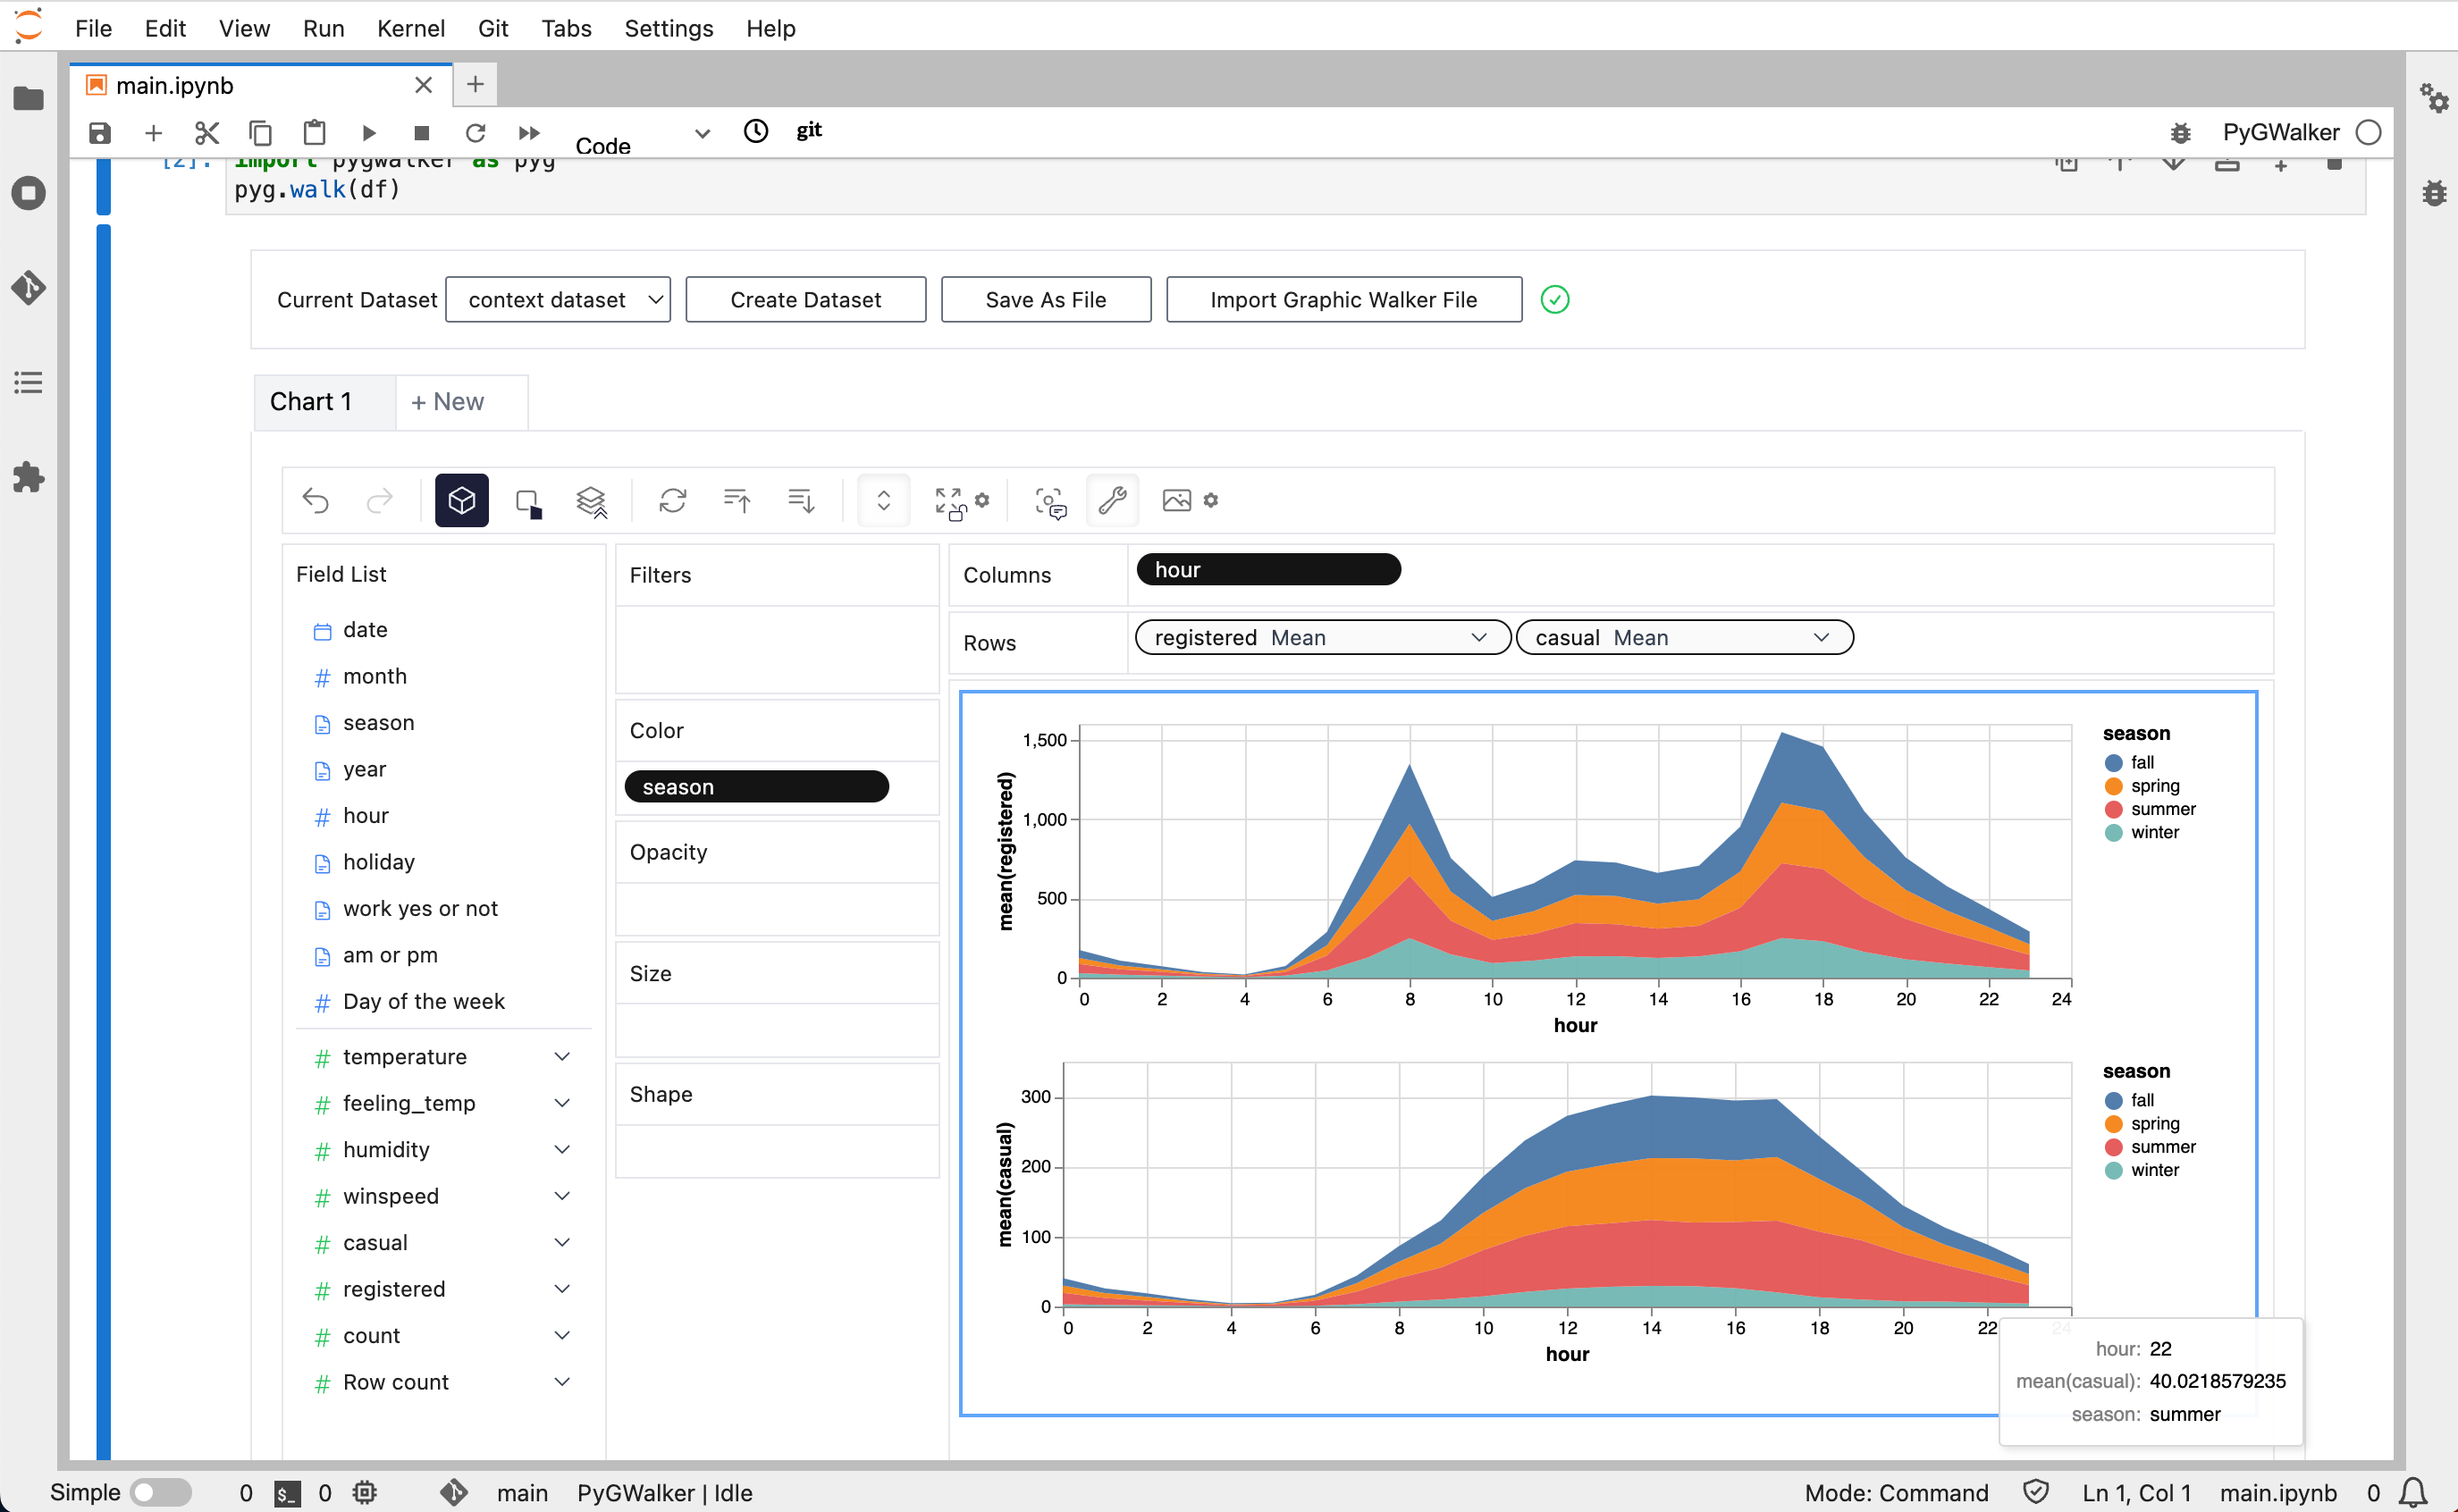
- To compare different measures, you can create a concat view by adding more than one measure into rows/columns.
- To make a facet view of several subviews divided by the value in dimension, put dimensions into rows or columns to make a facets view. The rules are similar to Tableau.
- You can save the data exploration result to a local file.
For more detailed instructions, visit the Graphic Walker GitHub page.
MIT License
Copyright (c) 2023-2033 Kanaries Data, Inc.
Permission is hereby granted, free of charge, to any person obtaining a copy of this software and associated documentation files (the "Software"), to deal in the Software without restriction, including without limitation the rights to use, copy, modify, merge, publish, distribute, sublicense, and/or sell copies of the Software, and to permit persons to whom the Software is furnished to do so, subject to the following conditions:
The above copyright notice and this permission notice shall be included in all copies or substantial portions of the Software.
THE SOFTWARE IS PROVIDED "AS IS", WITHOUT WARRANTY OF ANY KIND, EXPRESS OR IMPLIED, INCLUDING BUT NOT LIMITED TO THE WARRANTIES OF MERCHANTABILITY, FITNESS FOR A PARTICULAR PURPOSE AND NONINFRINGEMENT. IN NO EVENT SHALL THE AUTHORS OR COPYRIGHT HOLDERS BE LIABLE FOR ANY CLAIM, DAMAGES OR OTHER LIABILITY, WHETHER IN AN ACTION OF CONTRACT, TORT OR OTHERWISE, ARISING FROM, OUT OF OR IN CONNECTION WITH THE SOFTWARE OR THE USE OR OTHER DEALINGS IN THE SOFTWARE.
Resources
- Check out more resources about Graphic Walker on Graphic Walker GitHub
- We are also working on RATH: an Open Source, Automate exploratory data analysis tool that redefines the workflow of data wrangling, exploration and visualization with AI-powered automation. Check out the Kanaries website and RATH GitHub for more!
- If you encounter any issues and need support, join our Slack or Discord channels.
- Share pygwalker on these social media platforms:


Release history Release notifications | RSS feed


Download files
Download the file for your platform. If you're not sure which to choose, learn more about installing packages.
Source Distribution
Built Distribution
Filter files by name, interpreter, ABI, and platform.
If you're not sure about the file name format, learn more about wheel file names.
Copy a direct link to the current filters
File details
Details for the file pygwalker-0.1.2.tar.gz.
File metadata
- Download URL: pygwalker-0.1.2.tar.gz
- Upload date:
- Size: 708.1 kB
- Tags: Source
- Uploaded using Trusted Publishing? No
- Uploaded via: twine/4.0.2 CPython/3.8.16
File hashes
| Algorithm | Hash digest | |
|---|---|---|
| SHA256 |
859b59df8bc05106d3f28e6be82a6466230bcf74bcae1056b4977fa7dbc8e8fa
|
|
| MD5 |
d67d2b34bd0defd30ec8d8d822649b49
|
|
| BLAKE2b-256 |
4441a46d4c70c81756baacc909831a6ee7316c879dee1dcae6b91e2143fe6231
|
File details
Details for the file pygwalker-0.1.2-py3-none-any.whl.
File metadata
- Download URL: pygwalker-0.1.2-py3-none-any.whl
- Upload date:
- Size: 707.9 kB
- Tags: Python 3
- Uploaded using Trusted Publishing? No
- Uploaded via: twine/4.0.2 CPython/3.8.16
File hashes
| Algorithm | Hash digest | |
|---|---|---|
| SHA256 |
745f39ad67b90530aa7f95d3076ee8b6f2ed875f41213f421896c14700744e45
|
|
| MD5 |
0db8a50b8c89e80572933b6e5621485c
|
|
| BLAKE2b-256 |
bd8a0c34d6d9113bcba288ce66aea901fe37ba50efbbef8046afbf409bed3dd2
|


