
pymmeans
Estimated marginal means (EMMs) for Python — a native implementation of R's emmeans package, with no R dependency.
Status: Beta (v0.2.7). API stable across the OLS / GLM / MixedLM / GEE / Cox / Beta surface; 90/100 strict parity with R
emmeans(94/100 if partially-supported items count — see docs/r_parity_matrix.md) validated againsttests/r_reference/CSVs atatol=1e-4(and tighter — see vs-r.md). 352 unit tests on the public surface (pytest), 54% line coverage. Minor API polish still possible; the numerical surface is frozen.
Install
pip install pymmeans              # from PyPI
pip install "pymmeans[plot]"      # add matplotlib for plot() / emmip()
pip install "pymmeans[tutorial]"  # add pysofra + jupyter for the showcase notebook
For local development:
git clone https://github.com/jturner-uofl/pymmeans.git
cd pymmeans
uv venv && uv pip install -e ".[dev,plot]"
Quickstart
Fit a model, then ask for marginal means, pairwise comparisons, and a plot:
import numpy as np
import pandas as pd
import statsmodels.formula.api as smf
from pymmeans import emmeans, pairs, plot

rng = np.random.default_rng(0)
df = pd.DataFrame({
    "fertilizer": np.tile(np.repeat(["lo", "med", "hi"], 30), 2),
    "sunlight":   np.repeat(["shade", "sun"], 90),
})
df["growth"] = (
    df["fertilizer"].map({"lo": 0.5, "med": 1.2, "hi": 1.8})
    + (df["sunlight"] == "sun") * 0.4
    + rng.normal(0, 0.3, 180)
)
model = smf.ols("growth ~ fertilizer * sunlight", data=df).fit()

print(emmeans(model, "fertilizer"))
# Output (with the seed above):
#   fertilizer    emmean       SE     df  lower_cl  upper_cl
# 0         hi   2.0071   0.0376  174.0    1.9328    2.0813
# 1         lo   0.6811   0.0376  174.0    0.6069    0.7554
# 2        med   1.4399   0.0376  174.0    1.3657    1.5142

print(pairs(emmeans(model, "fertilizer")))
#   contrast  estimate      SE     df  t_ratio  p_value
# 0  hi - lo    1.3259  0.0532  174.0  24.9230      0.0
# 1 hi - med    0.5671  0.0532  174.0  10.6596      0.0
# 2 lo - med   -0.7588  0.0532  174.0 -14.2633      0.0
# (p_value=0.0 is pandas' default display of underflowed p < ~1e-15;
#  use `summary(pairs(...))` or `as_r_frame(...)` for "<.0001" format.)

ax = plot(emmeans(model, "fertilizer", by="sunlight"))
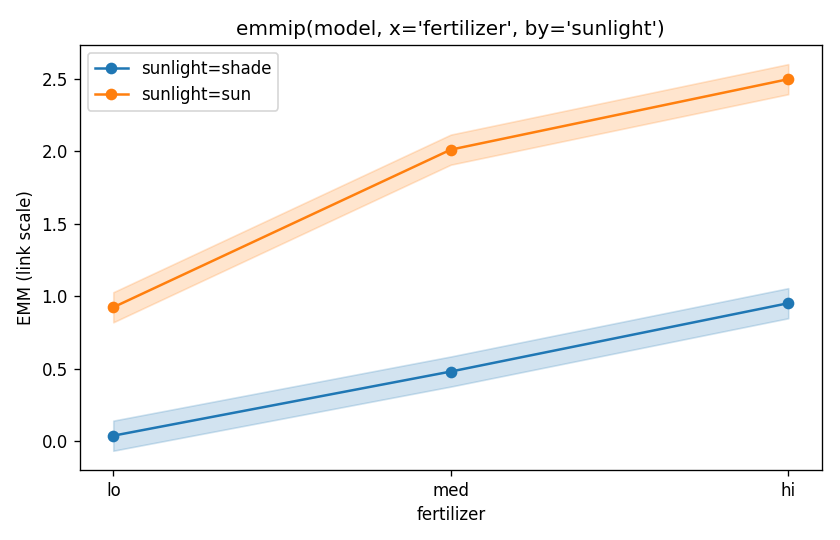
Interaction plot via emmip:
Showcase notebook
A full walkthrough of every analytical surface — EMMs, contrasts,
multiplicity adjustments, mixed-model Kenward-Roger / Satterthwaite df,
parametric-bootstrap LRT, and the ML adapter — is at
examples/pymmeans_showcase.ipynb with a
self-contained HTML render at
examples/pymmeans_showcase.html.
What's in v0.1
| Feature | Notes |
|---|---|
emmeans(model, specs, by=, at=, level=, type=) |
OLS and GLM (Binomial / Poisson / Gamma). type="response" back-transforms via the inverse link with delta-method SEs. |
pairs(emm, adjust=) |
Tukey (default), Bonferroni, Holm, Šidák, Dunnett / dunnettx / mvt, Scheffé, BH/fdr, BY, Hochberg, Hommel, none. Per-by-group families. |
contrast(emm, method=, ref=) |
Default eff per R. Methods: eff, del.eff, pairwise, revpairwise, tukey, trt.vs.ctrl/1/k, poly (R emmeans::poly.emmc integer-scaled), consec, mean_chg, identity, helmert. Also accepts custom coefficient dicts/matrices. Default adjustments match R per method (eff/del.eff → fdr; consec/mean_chg → mvt; trt.vs.ctrl → dunnettx). |
cld(emm) |
Compact letter display (Piepho 2004 / multcompView). |
pwpp(emm) / pwpm(emm) |
Pairwise-p-value plot (Lenth-style) + matrix display. |
summary(emm, infer=, side=, null=, delta=) |
R summary.emmGrid parity: toggle CI / test columns, one-sided CIs, non-zero null, TOST equivalence. |
confint(emm) / test(emm) / update(emm, level=) |
R confint / test / update.emmGrid. |
as_r_frame(emm) |
Return DataFrame with R-dot column names (lower.CL, t.ratio, p.value). |
with emm_options(level=, adjust=) |
R emm_options() context manager (ContextVar-backed). |
lsmeans / lsm / lstrends / lsmip / lsm_options / get_lsm_option |
R lsmeans package aliases — the deprecated predecessor of emmeans (still on CRAN as a transitional front-end). pymmeans covers the common script-level aliases plus lsmeans(ref_grid(...), "factor") workflows. See docs/r_parity_matrix.md for the per-function table. |
emtrends(model, specs, var=) |
Slopes of a numeric covariate at each EMM grid point (link or response scale). |
bootstrap_ci(emm, n_samples=, kind=) |
Parametric percentile CIs (default; samples β ~ N(β̂, V̂)) OR true non-parametric case bootstrap (kind="case"). Streaming P² percentiles (method="streaming") for constant-memory parametric bootstrap. Accepts ContrastResult, MLEMMResult, and EmmList inputs. |
permutation_test(contrast) |
Label-shuffle p-values with Phipson-Smyth correction. Robust to mis-specified residual distributions. |
effect_size(contrast, measure=) |
Cohen's d / Hedges' g (default) plus R-style effect_size SE/CI. measure="odds_ratio" / "risk_ratio" / "hazard_ratio" for binomial-logit / log-link / Cox PH contrasts. |
eta_squared(model, alternative=) |
Per-term partial η² / Hays' ω² / Cohen's f with noncentral-F CIs. Matches R emmeans::joint_tests exactly and R effectsize::eta_squared for balanced designs. |
joint_tests(model) |
Type III joint Wald F (or χ²) tests for every non-intercept term. |
pairs(emm, simple=, max_contrasts=) |
Guard against the multi-factor-pairwise explosion footgun, plus simple= per-factor decomposition (R parity). contrast(simple=, combine=) for the same on non-pairwise methods. |
ml_emmeans(info, specs, by=, at=) + ml_pairs + ml_contrast(method=) |
Marginal means for any ML model with .predict() (sklearn, xgboost, lightgbm, torch). Population-average prediction surface (g-computation). |
apply_satterthwaite(emm) |
Replace df=∞ with Satterthwaite df for MixedLM fits using cov_re / re_formula= random effects and vc_formula= variance components (crossed / nested designs). Same coverage applies to apply_kenward_roger. |
apply_kenward_roger(emm) |
KR-inflated vcov + KR df. Same cov_re / re_formula= / vc_formula= coverage as apply_satterthwaite. Cross-validated against pbkrtest::KRmodcomp; KR SE matches R's published vc_formula= output to 3 decimals. |
krmodcomp / satmodcomp / pbmodcomp / kenward_roger_vcov / get_kr / ddf_lb |
The six headline pbkrtest functions ported to Python. |
regrid_response(emm, bias_adjust=) |
LHS-transformation back-transform (np.log(y), np.sqrt(y), np.log1p(y), ...). Optional Jensen σ²/2 correction. |
weights="proportional" / "outer" |
Weighted averaging over non-target factors (training-data marginals). Default is "equal" (uniform). |
plot(emm), emmip(model, x=, by=) |
Forest and interaction plots (matplotlib). |
statsmodels.MixedLM support |
EMMs and contrasts on fixed effects. |
linearmodels panel / IV support |
Via from_linearmodels(result, data=df); explicit 1 + intercept required. PanelOLS strips EntityEffects / TimeEffects tokens. Formula-based IV2SLS / IVGMM / IVLIML work by stripping the [endog ~ instruments] block and reusing the IV-corrected result.params / result.cov. |
| Formula expressions | C(col), np.log(x), etc. on the RHS are handled via the analytic path. |
| Estimability checks | Rank-deficient designs are detected; non-estimable EMM / contrast rows surface as NaN with a clear warning. |
| Adapter protocol | Plug in custom frameworks (PyMC, TSA, ...) via register_adapter(MyAdapter). |
ML-model adapter (beyond R emmeans parity) |
from_predict(predict_fn, data, factors=, numerics=) brings marginal means to any model with .predict() (sklearn / xgboost / lightgbm / torch). Bootstrap CIs via bootstrap_ci(kind="case"). The closest R analogue is the marginaleffects package; pymmeans brings the same population-average prediction workflow to Python natively alongside its linear-model EMM machinery. |
Beyond R parity — ML adapter example
import numpy as np
import pandas as pd
from sklearn.ensemble import RandomForestRegressor
from pymmeans import from_predict, ml_emmeans, ml_pairs, bootstrap_ci

# 0) Toy training data: 3 treatments × 2 sites + 2 numeric covariates
rng = np.random.default_rng(0)
df = pd.DataFrame({
    "treatment": np.repeat(["A", "B", "C"], 50),
    "site":      np.tile(np.repeat(["north", "south"], 25), 3),
    "age":       rng.uniform(20, 70, 150),
    "dose":      rng.uniform(0.0, 1.0, 150),
})
df["y"] = (
    df["treatment"].map({"A": 0.8, "B": 1.2, "C": 1.7})
    + 0.01 * df["age"]
    + 0.5 * df["dose"]
    + rng.normal(0, 0.1, 150)
)

# Pin a stable feature schema so sub-grid predictions always
# present the same columns sklearn saw at fit time.
_FEATURE_COLS = pd.get_dummies(
    df[["treatment", "site", "age", "dose"]],
).columns.tolist()

def featurize(d):
    return (
        pd.get_dummies(d[["treatment", "site", "age", "dose"]])
        .reindex(columns=_FEATURE_COLS, fill_value=0)
    )

X_train, y_train = featurize(df), df["y"]

# 1) Train any sklearn-style model
rf = RandomForestRegressor(random_state=0).fit(X_train, y_train)

# 2) Wrap as a pymmeans target via the predict callable
info = from_predict(
    predict_fn=lambda d: rf.predict(featurize(d)),
    data=df,
    factors=["treatment", "site"],
    numerics=["age", "dose"],
    refit_fn=lambda sample: (lambda fitted: lambda d: fitted.predict(featurize(d)))(
        RandomForestRegressor(random_state=0)
        .fit(featurize(sample), sample["y"])
    ),
)

# 3) Marginal means via prediction-surface averaging (g-computation)
em = ml_emmeans(info, "treatment")
#   treatment  emmean
# 0         A   1.531
# 1         B   1.939
# 2         C   2.464

# 4) Pairwise contrasts
ml_pairs(em)

# 5) Case-bootstrap CIs (refits on each resample for proper variance)
em_with_ci = bootstrap_ci(em, n_samples=500, kind="case", seed=0)
#   treatment  emmean     SE  lower_cl  upper_cl
# 0         A   1.531  0.025     1.483     1.582
# 1         B   1.939  0.022     1.899     1.983
# 2         C   2.464  0.028     2.402     2.509
R emmeans is restricted to models with a tractable β + V representation.
pymmeans's prediction-surface averaging extends the marginal-effects
workflow to any ML model with a .predict() method, sharing the same
pairs / contrast / bootstrap_ci / effect_size / summary machinery
as the linear-model path. The closest R-ecosystem analogue is
marginaleffects, which also supports ML
models; pymmeans brings the same population-average prediction workflow to
Python without leaving the EMM toolbox.
Validation
352 public-surface unit tests pass (a small number of dependency-gated tests
skip when optional packages are absent). 18 R-emmeans reference
fits are cross-validated to atol=1e-4 (warpbreaks, pigs, ToothGrowth,
InsectSprays, neuralgia binomial GLM response-scale, plus the broader
reference suite). See tests/test_vs_r.py,
tests/r_reference/, and
docs/r_parity_matrix.md for the feature-level
parity inventory.
Performance vs R
See docs/PERFORMANCE_REPORT.md for full numbers. Highlights:
| Scenario | R emmeans | pymmeans v0.1 |
|---|---|---|
emmeans on n=1K OLS |
0.023 s | 0.002 s (~11.5× faster) |
emmeans on n=500K OLS |
0.178 s | 0.023 s (~7.7× faster) |
| GitHub issue #282 (46M-row grid) | refuses / OOM | 0.021 s (only pymmeans completes) |
| Pairwise k=20 (Tukey) | 0.016 s | 0.018 s (≈ 1×) |
| Pairwise k=50 (Tukey) | 0.060 s | 0.101 s (1.7× slower) |
| Pairwise k=100 (Tukey) | 0.561 s | 0.416 s (1.3× faster) |
| Pairwise k=200 (Tukey) | 9.704 s | 1.961 s (4.9× faster) |
pymmeans wins on the EMM side via analytic marginalization (computing
L_marg as a Kronecker product of marginal factor codings, no grid
materialization). Tukey uses a numerically correct hybrid of generalized
Gauss-Laguerre (df < 400) and adaptive Gauss-Legendre (df ≥ 400, where
SciPy's roots_genlaguerre overflows) — beating R at large k where Tukey
is most painful, slightly slower at moderate k.
Documentation
A mkdocs-material site builds from docs/ (run mkdocs serve after
pip install -e ".[docs]").
- docs/getting-started.md — worked examples
- docs/PERFORMANCE_REPORT.md — benchmark numbers
- docs/vs-r.md — R reference comparison and validation
- docs/r_parity_matrix.md — function-by-function map between
pymmeansand Remmeans/lsmeans/pbkrtest - docs/v0_2_roadmap.md — what's planned for the next release
- examples/pymmeans_showcase.ipynb — the full showcase notebook
- examples/basic_ols.py, examples/glm_logistic.py — runnable demos
License
GPL-3.0-or-later, matching the R emmeans package.
1 maintainer

Metadata
1 maintainer
Release files for pymmeans 0.2.7
For a detailed explanation of source distributions (sdists) and built distributions (wheels), please see the package formats documentation.
Source distribution (sdist)
| File | Size | Uploaded | |
|---|---|---|---|
| pymmeans-0.2.7.tar.gz | 1.2 MB | Details |
Built distribution (wheel)
| File | Interpreter | ABI | Platform | Reset |
|---|---|---|---|---|
| pymmeans-0.2.7-py3-none-any.whl | Python 3 | none | any | Details |
Total release size: 1.6 MB
Release files / pymmeans-0.2.7.tar.gz
| Download URL | pymmeans-0.2.7.tar.gz |
|---|---|
| Size | 1.2 MB |
| Tags | Source |
|
SHA-256 checksum How to use checksums |
821be04baf1382196084af5530cabb9ebf5bdb086a2474dd4ca705b7d48d6c95
|
|
BLAKE2b-256 checksum How to use checksums |
ed80517f6d5ea6231da38c2578b230197ef7bf10a3c7d6ee968c5575614ad3d6
|
| Upload date | |
|
Uploaded using Trusted Publishing? What is trusted publishing? |
No |
| Uploaded via |
twine/6.2.0 CPython/3.11.15
|
Release files / pymmeans-0.2.7-py3-none-any.whl
| Download URL | pymmeans-0.2.7-py3-none-any.whl |
|---|---|
| Size | 369.2 kB |
| Tags | Python 3 |
|
SHA-256 checksum How to use checksums |
6db336d2ec918f1b71608f02423a98055dc63adf0532e89ab1c3d88c07e91c0c
|
|
BLAKE2b-256 checksum How to use checksums |
7ae29c0a5c4b4ee66adbd8789ff34455580b91047f75bb78ae18eff2a80a864c
|
| Upload date | |
|
Uploaded using Trusted Publishing? What is trusted publishing? |
No |
| Uploaded via |
twine/6.2.0 CPython/3.11.15
|














