
Estimated marginal means for Python — a native port of R's emmeans.

Project description
pymmeans
Estimated marginal means (EMMs) for Python — a native implementation of R's emmeans package, with no R dependency.
Status: Beta (v0.1.6). API stable across the OLS / GLM / MixedLM / GEE / Cox / Beta surface; 84/100 strict parity with R
emmeans(88/100 if partially-supported items count — see docs/r_parity_matrix.md) validated againsttests/r_reference/CSVs atatol=1e-4(and tighter — see vs-r.md). 313 unit tests on the public surface (pytest), 54% line coverage. Minor API polish still possible; the numerical surface is frozen.
Install
pip install pymmeans              # from PyPI
pip install "pymmeans[plot]"      # add matplotlib for plot() / emmip()
pip install "pymmeans[tutorial]"  # add pysofra + jupyter for the showcase notebook
For local development:
git clone https://github.com/jturner-uofl/pymmeans.git
cd pymmeans
uv venv && uv pip install -e ".[dev,plot]"
Quickstart
Fit a model, then ask for marginal means, pairwise comparisons, and a plot:
import numpy as np
import pandas as pd
import statsmodels.formula.api as smf
from pymmeans import emmeans, pairs, plot

rng = np.random.default_rng(0)
df = pd.DataFrame({
    "fertilizer": np.tile(np.repeat(["lo", "med", "hi"], 30), 2),
    "sunlight":   np.repeat(["shade", "sun"], 90),
})
df["growth"] = (
    df["fertilizer"].map({"lo": 0.5, "med": 1.2, "hi": 1.8})
    + (df["sunlight"] == "sun") * 0.4
    + rng.normal(0, 0.3, 180)
)
model = smf.ols("growth ~ fertilizer * sunlight", data=df).fit()

print(emmeans(model, "fertilizer"))
# Output (with the seed above):
#   fertilizer    emmean       SE     df  lower_cl  upper_cl
# 0         hi   2.0071   0.0376  174.0    1.9328    2.0813
# 1         lo   0.6811   0.0376  174.0    0.6069    0.7554
# 2        med   1.4399   0.0376  174.0    1.3657    1.5142

print(pairs(emmeans(model, "fertilizer")))
#   contrast  estimate      SE     df  t_ratio  p_value
# 0  hi - lo    1.3259  0.0532  174.0  24.9230      0.0
# 1 hi - med    0.5671  0.0532  174.0  10.6596      0.0
# 2 lo - med   -0.7588  0.0532  174.0 -14.2633      0.0
# (p_value=0.0 is pandas' default display of underflowed p < ~1e-15;
#  use `summary(pairs(...))` or `as_r_frame(...)` for "<.0001" format.)

ax = plot(emmeans(model, "fertilizer", by="sunlight"))
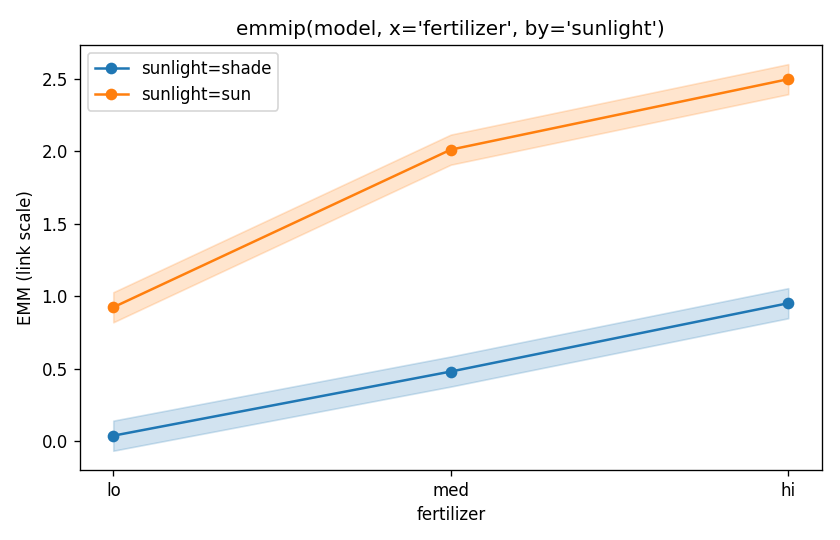
Interaction plot via emmip:
Showcase notebook
A full walkthrough of every analytical surface — EMMs, contrasts,
multiplicity adjustments, mixed-model Kenward-Roger / Satterthwaite df,
parametric-bootstrap LRT, and the ML adapter — is at
examples/pymmeans_showcase.ipynb with a
self-contained HTML render at
examples/pymmeans_showcase.html.
What's in v0.1
| Feature | Notes |
|---|---|
emmeans(model, specs, by=, at=, level=, type=) |
OLS and GLM (Binomial / Poisson / Gamma). type="response" back-transforms via the inverse link with delta-method SEs. |
pairs(emm, adjust=) |
Tukey (default), Bonferroni, Holm, Šidák, Dunnett / dunnettx / mvt, Scheffé, BH/fdr, BY, Hochberg, Hommel, none. Per-by-group families. |
contrast(emm, method=, ref=) |
Default eff per R. Methods: eff, del.eff, pairwise, revpairwise, tukey, trt.vs.ctrl/1/k, poly (R emmeans::poly.emmc integer-scaled), consec, mean_chg, identity, helmert. Also accepts custom coefficient dicts/matrices. Default adjustments match R per method (eff/del.eff → fdr; consec/mean_chg → mvt; trt.vs.ctrl → dunnettx). |
cld(emm) |
Compact letter display (Piepho 2004 / multcompView). |
pwpp(emm) / pwpm(emm) |
Pairwise-p-value plot (Lenth-style) + matrix display. |
summary(emm, infer=, side=, null=, delta=) |
R summary.emmGrid parity: toggle CI / test columns, one-sided CIs, non-zero null, TOST equivalence. |
confint(emm) / test(emm) / update(emm, level=) |
R confint / test / update.emmGrid. |
as_r_frame(emm) |
Return DataFrame with R-dot column names (lower.CL, t.ratio, p.value). |
with emm_options(level=, adjust=) |
R emm_options() context manager (ContextVar-backed). |
lsmeans / lsm / lstrends / lsmip / lsm_options / get_lsm_option |
R lsmeans package aliases — the deprecated predecessor of emmeans (still on CRAN as a transitional front-end). pymmeans covers the common script-level aliases plus lsmeans(ref_grid(...), "factor") workflows. See docs/r_parity_matrix.md for the per-function table. |
emtrends(model, specs, var=) |
Slopes of a numeric covariate at each EMM grid point (link or response scale). |
bootstrap_ci(emm, n_samples=, kind=) |
Parametric percentile CIs (default; samples β ~ N(β̂, V̂)) OR true non-parametric case bootstrap (kind="case"). Streaming P² percentiles (method="streaming") for constant-memory parametric bootstrap. Accepts ContrastResult, MLEMMResult, and EmmList inputs. |
permutation_test(contrast) |
Label-shuffle p-values with Phipson-Smyth correction. Robust to mis-specified residual distributions. |
effect_size(contrast, measure=) |
Cohen's d / Hedges' g (default) plus R-style effect_size SE/CI. measure="odds_ratio" / "risk_ratio" / "hazard_ratio" for binomial-logit / log-link / Cox PH contrasts. |
eta_squared(model, alternative=) |
Per-term partial η² / Hays' ω² / Cohen's f with noncentral-F CIs. Matches R emmeans::joint_tests exactly and R effectsize::eta_squared for balanced designs. |
joint_tests(model) |
Type III joint Wald F (or χ²) tests for every non-intercept term. |
pairs(emm, simple=, max_contrasts=) |
Guard against the multi-factor-pairwise explosion footgun, plus simple= per-factor decomposition (R parity). contrast(simple=, combine=) for the same on non-pairwise methods. |
ml_emmeans(info, specs, by=, at=) + ml_pairs + ml_contrast(method=) |
Marginal means for any ML model with .predict() (sklearn, xgboost, lightgbm, torch). Population-average prediction surface (g-computation). |
apply_satterthwaite(emm) |
Replace df=∞ with Satterthwaite df (any RE structure) for MixedLM. |
apply_kenward_roger(emm) |
KR-inflated vcov + KR df. Cross-validated against pbkrtest::KRmodcomp (Kackar-Harville form). |
krmodcomp / satmodcomp / pbmodcomp / kenward_roger_vcov / get_kr / ddf_lb |
The six headline pbkrtest functions ported to Python. |
regrid_response(emm, bias_adjust=) |
LHS-transformation back-transform (np.log(y), np.sqrt(y), np.log1p(y), ...). Optional Jensen σ²/2 correction. |
weights="proportional" / "outer" |
Weighted averaging over non-target factors (training-data marginals). Default is "equal" (uniform). |
plot(emm), emmip(model, x=, by=) |
Forest and interaction plots (matplotlib). |
statsmodels.MixedLM support |
EMMs and contrasts on fixed effects. |
linearmodels panel / IV support |
Via from_linearmodels(result, data=df); explicit 1 + intercept required. PanelOLS strips EntityEffects / TimeEffects tokens. Formula-based IV2SLS / IVGMM / IVLIML work by stripping the [endog ~ instruments] block and reusing the IV-corrected result.params / result.cov. |
| Formula expressions | C(col), np.log(x), etc. on the RHS are handled via the analytic path. |
| Estimability checks | Rank-deficient designs are detected; non-estimable EMM / contrast rows surface as NaN with a clear warning. |
| Adapter protocol | Plug in custom frameworks (PyMC, TSA, ...) via register_adapter(MyAdapter). |
ML-model adapter (beyond R emmeans parity) |
from_predict(predict_fn, data, factors=, numerics=) brings marginal means to any model with .predict() (sklearn / xgboost / lightgbm / torch). Bootstrap CIs via bootstrap_ci(kind="case"). The closest R analogue is the marginaleffects package; pymmeans brings the same population-average prediction workflow to Python natively alongside its linear-model EMM machinery. |
Beyond R parity — ML adapter example
import numpy as np
import pandas as pd
from sklearn.ensemble import RandomForestRegressor
from pymmeans import from_predict, ml_emmeans, ml_pairs, bootstrap_ci

# 0) Toy training data: 3 treatments × 2 sites + 2 numeric covariates
rng = np.random.default_rng(0)
df = pd.DataFrame({
    "treatment": np.repeat(["A", "B", "C"], 50),
    "site":      np.tile(np.repeat(["north", "south"], 25), 3),
    "age":       rng.uniform(20, 70, 150),
    "dose":      rng.uniform(0.0, 1.0, 150),
})
df["y"] = (
    df["treatment"].map({"A": 0.8, "B": 1.2, "C": 1.7})
    + 0.01 * df["age"]
    + 0.5 * df["dose"]
    + rng.normal(0, 0.1, 150)
)

# Pin a stable feature schema so sub-grid predictions always
# present the same columns sklearn saw at fit time.
_FEATURE_COLS = pd.get_dummies(
    df[["treatment", "site", "age", "dose"]],
).columns.tolist()

def featurize(d):
    return (
        pd.get_dummies(d[["treatment", "site", "age", "dose"]])
        .reindex(columns=_FEATURE_COLS, fill_value=0)
    )

X_train, y_train = featurize(df), df["y"]

# 1) Train any sklearn-style model
rf = RandomForestRegressor(random_state=0).fit(X_train, y_train)

# 2) Wrap as a pymmeans target via the predict callable
info = from_predict(
    predict_fn=lambda d: rf.predict(featurize(d)),
    data=df,
    factors=["treatment", "site"],
    numerics=["age", "dose"],
    refit_fn=lambda sample: (lambda fitted: lambda d: fitted.predict(featurize(d)))(
        RandomForestRegressor(random_state=0)
        .fit(featurize(sample), sample["y"])
    ),
)

# 3) Marginal means via prediction-surface averaging (g-computation)
em = ml_emmeans(info, "treatment")
#   treatment  emmean
# 0         A   1.531
# 1         B   1.939
# 2         C   2.464

# 4) Pairwise contrasts
ml_pairs(em)

# 5) Case-bootstrap CIs (refits on each resample for proper variance)
em_with_ci = bootstrap_ci(em, n_samples=500, kind="case", seed=0)
#   treatment  emmean     SE  lower_cl  upper_cl
# 0         A   1.531  0.025     1.483     1.582
# 1         B   1.939  0.022     1.899     1.983
# 2         C   2.464  0.028     2.402     2.509
R emmeans is restricted to models with a tractable β + V representation.
pymmeans's prediction-surface averaging extends the marginal-effects
workflow to any ML model with a .predict() method, sharing the same
pairs / contrast / bootstrap_ci / effect_size / summary machinery
as the linear-model path. The closest R-ecosystem analogue is
marginaleffects, which also supports ML
models; pymmeans brings the same population-average prediction workflow to
Python without leaving the EMM toolbox.
Validation
313 public-surface unit tests pass (1 skipped — arviz optional). 18 R-emmeans reference
fits are cross-validated to atol=1e-4 (warpbreaks, pigs, ToothGrowth,
InsectSprays, neuralgia binomial GLM response-scale, plus the broader
reference suite). See tests/test_vs_r.py,
tests/r_reference/, and
docs/r_parity_matrix.md for the feature-level
parity inventory.
Performance vs R
See docs/PERFORMANCE_REPORT.md for full numbers. Highlights:
| Scenario | R emmeans | pymmeans v0.1 |
|---|---|---|
emmeans on n=1K OLS |
0.023 s | 0.002 s (~11.5× faster) |
emmeans on n=500K OLS |
0.178 s | 0.023 s (~7.7× faster) |
| GitHub issue #282 (46M-row grid) | refuses / OOM | 0.021 s (only pymmeans completes) |
| Pairwise k=20 (Tukey) | 0.016 s | 0.018 s (≈ 1×) |
| Pairwise k=50 (Tukey) | 0.060 s | 0.101 s (1.7× slower) |
| Pairwise k=100 (Tukey) | 0.561 s | 0.416 s (1.3× faster) |
| Pairwise k=200 (Tukey) | 9.704 s | 1.961 s (4.9× faster) |
pymmeans wins on the EMM side via analytic marginalization (computing
L_marg as a Kronecker product of marginal factor codings, no grid
materialization). Tukey uses a numerically correct hybrid of generalized
Gauss-Laguerre (df < 400) and adaptive Gauss-Legendre (df ≥ 400, where
SciPy's roots_genlaguerre overflows) — beating R at large k where Tukey
is most painful, slightly slower at moderate k.
Documentation
A mkdocs-material site builds from docs/ (run mkdocs serve after
pip install -e ".[docs]").
- docs/getting-started.md — worked examples
- docs/PERFORMANCE_REPORT.md — benchmark numbers
- docs/vs-r.md — R reference comparison and validation
- docs/r_parity_matrix.md — function-by-function map between
pymmeansand Remmeans/lsmeans/pbkrtest - docs/v0_2_roadmap.md — what's planned for the next release
- examples/pymmeans_showcase.ipynb — the full showcase notebook
- examples/basic_ols.py, examples/glm_logistic.py — runnable demos
License
GPL-3.0-or-later, matching the R emmeans package.
Release history Release notifications | RSS feed


Download files
Download the file for your platform. If you're not sure which to choose, learn more about installing packages.
Source Distribution
Built Distribution
Filter files by name, interpreter, ABI, and platform.
If you're not sure about the file name format, learn more about wheel file names.
Copy a direct link to the current filters
File details
Details for the file pymmeans-0.1.6.tar.gz.
File metadata
- Download URL: pymmeans-0.1.6.tar.gz
- Upload date:
- Size: 680.9 kB
- Tags: Source
- Uploaded using Trusted Publishing? No
- Uploaded via: twine/6.2.0 CPython/3.11.15
File hashes
| Algorithm | Hash digest | |
|---|---|---|
| SHA256 |
69ed6c220a2c18a334905e4ac55e6164701e3da62f48497a7e597d21f03f60ae
|
|
| MD5 |
5a06240c816490c57243d472f3852979
|
|
| BLAKE2b-256 |
9ede9c636d4316cb5bd6b1c6d9f654f7238043cf8b0b5fed34656a8e637f7187
|
File details
Details for the file pymmeans-0.1.6-py3-none-any.whl.
File metadata
- Download URL: pymmeans-0.1.6-py3-none-any.whl
- Upload date:
- Size: 293.8 kB
- Tags: Python 3
- Uploaded using Trusted Publishing? No
- Uploaded via: twine/6.2.0 CPython/3.11.15
File hashes
| Algorithm | Hash digest | |
|---|---|---|
| SHA256 |
bbc1b92cea173721975fd8dd632686dc622b839b0c0540c0713845e748571db6
|
|
| MD5 |
1cfeeb89b11b46086e6669c38d7f3d61
|
|
| BLAKE2b-256 |
054bb9e4b91116e1d433c5e33a34c5e0e6bebbb1f746749ed9089e137ecd3e37
|






