
OpenLayers + Qt (QWebEngine) mapping widget for Python
Verified details
These details have been verified by PyPIProject links
GitHub Statistics
Maintainers

Project description
pyopenlayersqt
OpenLayers + Qt (QWebEngine) mapping widget for Python.
A high-performance, feature-rich mapping widget that embeds OpenLayers in a Qt application using QWebEngine. Designed for displaying and interacting with large volumes of geospatial data.
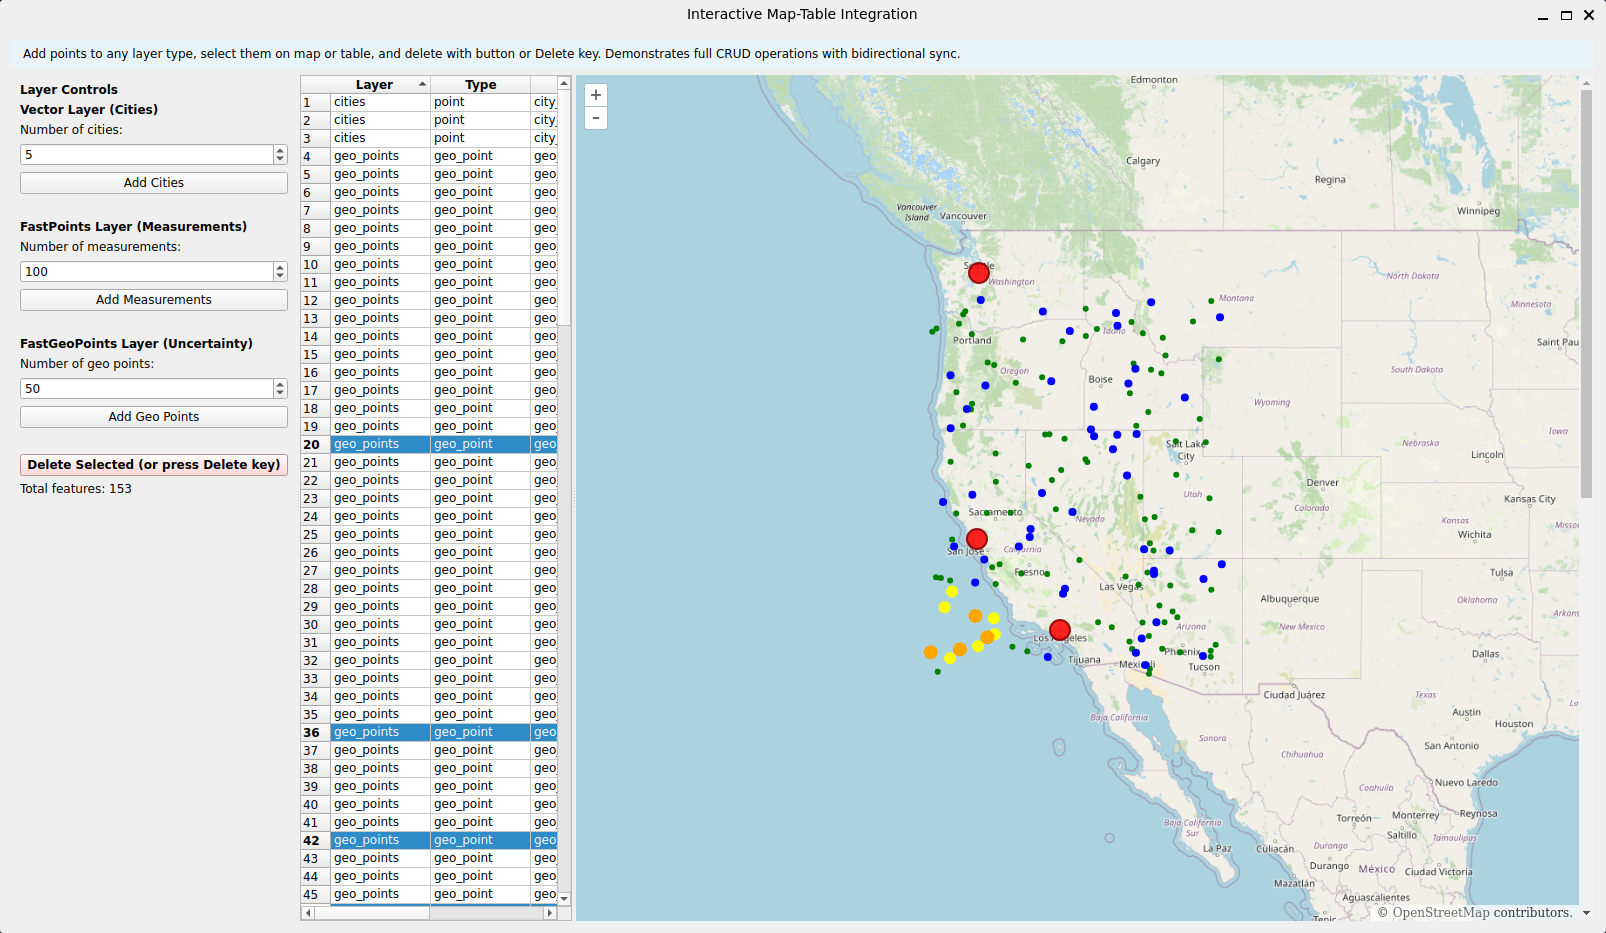
Table of Contents
- Features
- Installation
- Quick Start
- Core Components
- Complete Example
- View Extent Tracking
- Advanced: Direct JavaScript Communication
- Performance Tips
- Architecture
- License
- Contributing
- Credits
Features
- 🗺️ Interactive Map Widget: Fully-featured OpenLayers map embedded in PySide6/Qt
- ⚡ High-Performance Rendering: Fast points layers with spatial indexing for millions of points
- 🎨 Rich Styling: Customizable styles for points, polygons, circles, and ellipses
- 🎨 QColor Support: Use
QColorobjects or color names directly in styles - no.name()needed - 📍 Geolocation Support: Fast geo-points layer with uncertainty ellipses
- 🌐 WMS Integration: Built-in Web Map Service layer support
- 🖼️ Raster Overlays: PNG/ overlay support with custom bounds
- ✅ Feature Selection: Interactive feature selection with Python ↔ JavaScript sync
- 🎯 Smart Z-Ordering: Selected points and ellipses automatically appear on top
- 📊 Feature Table Widget: High-performance table widget for displaying and managing features
- 🔄 Bidirectional Sync: Seamless selection synchronization between map and table
- 📏 Distance Measurement: Interactive measurement mode with geodesic distance calculations and great-circle path visualization
- 🎚️ Range Slider Widget: Dual-handle range slider for filtering features by numeric or timestamp ranges
Installation
pip install pyopenlayersqt
Requirements
- Python >= 3.8
- PySide6 >= 6.5
- numpy >= 1.23
- pillow >= 10.0
- matplotlib >= 3.7
Quick Start
from PySide6 import QtWidgets
from PySide6.QtGui import QColor
from pyopenlayersqt import OLMapWidget, PointStyle
import sys

app = QtWidgets.QApplication(sys.argv)

# Create the map widget with custom initial view
map_widget = OLMapWidget(center=(37.0, -120.0), zoom=6)

# Add a vector layer
vector_layer = map_widget.add_vector_layer("my_layer", selectable=True)

# Add some points with QColor styling
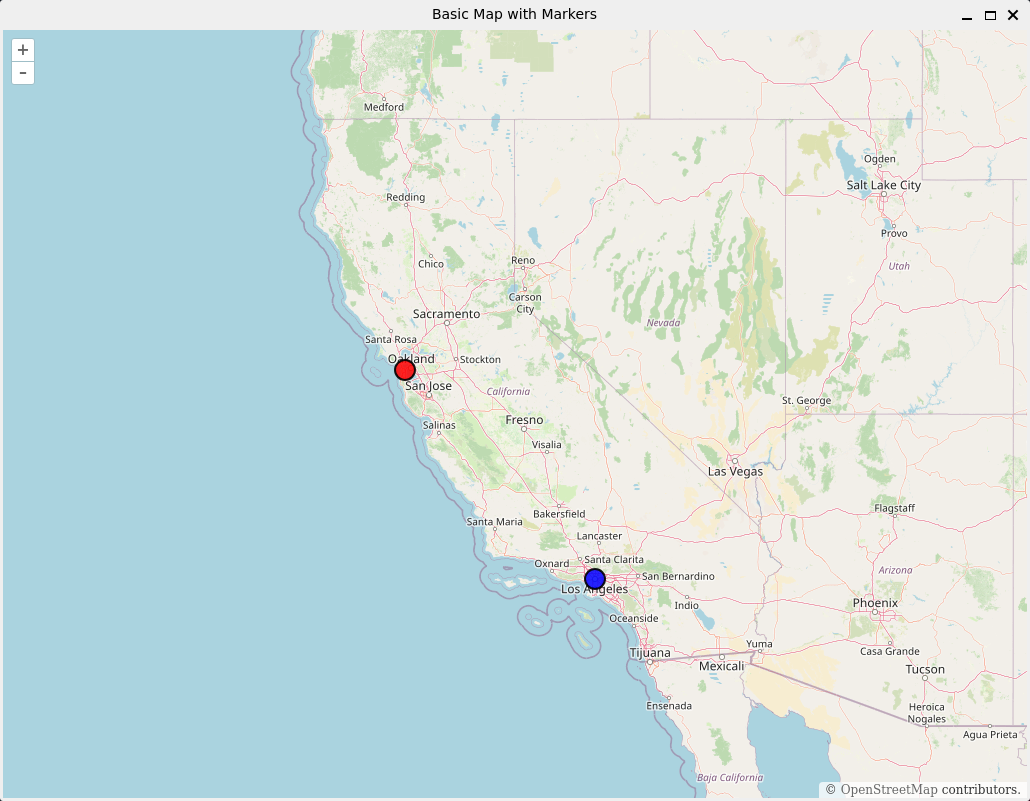
coords = [(37.7749, -122.4194), (34.0522, -118.2437)]  # SF, LA
vector_layer.add_points(
    coords,
    ids=["sf", "la"],
    style=PointStyle(radius=8.0, fill_color=QColor("red"))
)

# Show the map
map_widget.show()
sys.exit(app.exec())
See the examples directory for more working examples:
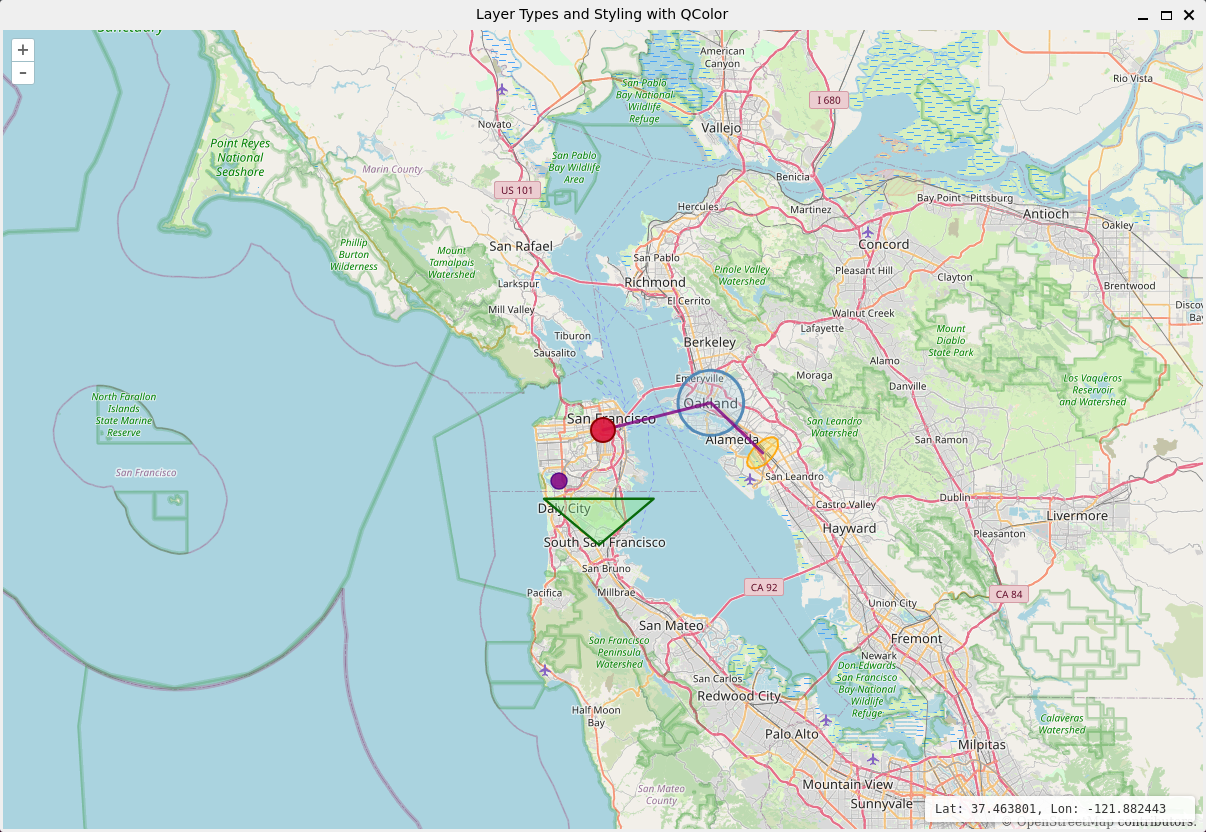
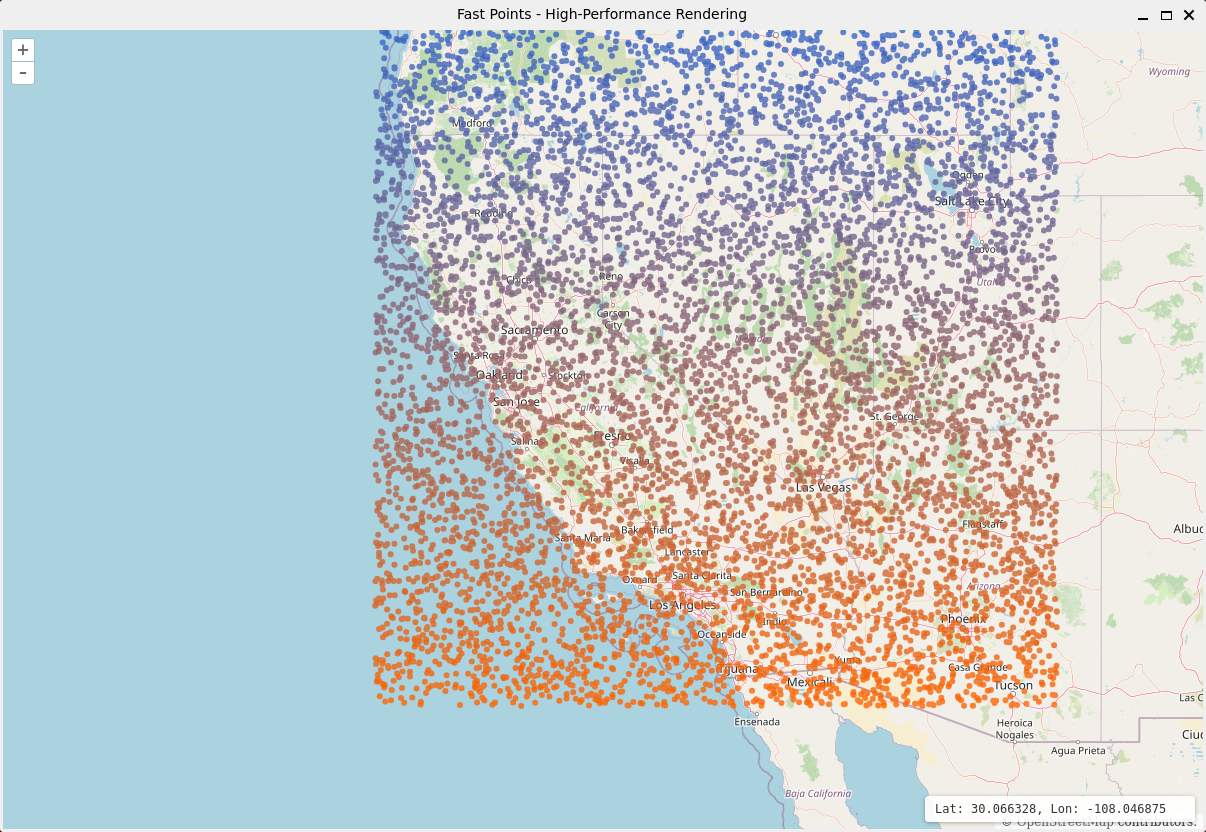
01_basic_map_with_markers.py- Basic map with QColor markers (start here!)02_layer_types_and_styling.py- All geometry types with QColor03_fast_points_performance.py- High-performance rendering (10,000+ points)04_wms_and_base_layers.py- WMS integration and opacity control05_raster_overlay.py- Raster/heatmap visualization06_geo_uncertainty_ellipses.py- Geolocation uncertainty with ellipses07_feature_selection.py- Interactive selection across layers08_table_integration.py- Bidirectional map-table sync (CORE)09_selection_and_recoloring.py- Interactive recoloring (CORE)10_range_slider_filtering.py- Range slider filtering11_measurement_tool.py- Distance measurement tool12_coordinate_display.py- Coordinate display toggle13_dual_table_linking.py- Two-table parent/child map-table selection workflow
Core Components
OLMapWidget
The main widget class that embeds an OpenLayers map.
from pyopenlayersqt import OLMapWidget

# Create with default world view (center at 0,0, zoom level 2)
map_widget = OLMapWidget()

# Or create with custom initial view
map_widget = OLMapWidget(center=(37.0, -120.0), zoom=6)
Constructor Parameters:
parent- Optional parent widgetcenter- Initial map center as(lat, lon)tuple. Defaults to(0, 0).zoom- Initial zoom level (integer). Defaults to2(world view).show_coordinates- If True, displays mouse lat/lon coordinates in the lower right corner. Defaults toTrue.
Key Methods:
add_vector_layer(name, selectable=True)- Create a vector layer for points, polygons, circles, ellipsesadd_fast_points_layer(name, selectable, style, cell_size_m)- Create a high-performance points layeradd_fast_geopoints_layer(name, selectable, style, cell_size_m)- Create a geo-points layer with uncertainty ellipsesadd_wms(options, name)- Add a WMS (Web Map Service) layeradd_raster_image(image, bounds, style, name)- Add a raster image overlayset_base_opacity(opacity)- Set OSM base layer opacity (0.0-1.0)set_measure_mode(enabled)- Enable/disable interactive distance measurement modeclear_measurements()- Clear all measurement points and linesget_view_extent(callback)- Get current map extent asynchronouslywatch_view_extent(callback, debounce_ms)- Subscribe to extent changes
Signals:
ready- Emitted when the map is readyselectionChanged- Emitted when feature selection changesviewExtentChanged- Emitted when map extent changesjsEvent- Emitted for JavaScript events (e.g., measurement mode). Signal(str, str) with event type and JSON payload.
Layer Types
All layer types in pyopenlayersqt inherit from a common BaseLayer class, providing consistent functionality across different layer implementations.
Common Layer Methods
All layers (VectorLayer, FastPointsLayer, FastGeoPointsLayer, WMSLayer, RasterLayer) support these core methods:
# Set layer opacity (0.0 = transparent, 1.0 = opaque)
layer.set_opacity(0.7)

# Remove the layer from the map
layer.remove()
Feature-based layers (VectorLayer, FastPointsLayer, FastGeoPointsLayer) also support:
# Show/hide the layer
layer.set_visible(True)

# Enable/disable feature selection
layer.set_selectable(True)

# Clear all features from the layer
layer.clear()
Each layer type also has specialized methods for its specific use case, as detailed below.
VectorLayer
For standard vector features with full styling control.
from pyopenlayersqt import PointStyle, PolygonStyle, CircleStyle, EllipseStyle

# Add a vector layer
vector = map_widget.add_vector_layer("vector", selectable=True)

# Add points
vector.add_points(
    coords=[(lat, lon), ...],
    ids=["id1", "id2", ...],
    style=PointStyle(
        radius=6.0,
        fill_color=QColor("red"),
        fill_opacity=0.85,
        stroke_color=QColor("black"),
        stroke_width=1.0
    )
)

# Add polygons
vector.add_polygon(
    ring=[(lat1, lon1), (lat2, lon2), ...],
    feature_id="poly1",
    style=PolygonStyle(
        stroke_color=QColor("dodgerblue"),
        stroke_width=2.0,
        fill_color=QColor("dodgerblue"),
        fill_opacity=0.15
    )
)

# Add lines (polylines)
vector.add_line(
    coords=[(lat1, lon1), (lat2, lon2), (lat3, lon3)],
    feature_id="ln1",
    style=PolygonStyle(
        stroke_color=QColor("dodgerblue"),
        stroke_width=2.0
    )
)

# Add circles (radius in meters)
vector.add_circle(
    center=(lat, lon),
    radius_m=1000.0,
    feature_id="circle1",
    style=CircleStyle(stroke_color=QColor("dodgerblue"), fill_opacity=0.15)
)

# Add ellipses (semi-major/minor axes in meters, tilt in degrees from north)
vector.add_ellipse(
    center=(lat, lon),
    sma_m=2000.0,  # Semi-major axis
    smi_m=1200.0,  # Semi-minor axis
    tilt_deg=45.0,  # Tilt from true north
    feature_id="ell1",
    style=EllipseStyle(stroke_color=QColor("gold"), fill_opacity=0.12)
)

# Update styles of specific features (e.g., selected features)
feature_ids = ["id1", "id2"]
new_styles = [
    PointStyle(radius=8.0, fill_color=QColor("red"), fill_opacity=1.0),
    PointStyle(radius=8.0, fill_color=QColor("green"), fill_opacity=1.0),
]
vector.update_feature_styles(feature_ids, new_styles)

# Remove features
vector.remove_features(["id1", "poly1"])

# Clear all features
vector.clear()
FastPointsLayer
High-performance layer for rendering millions of points using canvas and spatial indexing.
from pyopenlayersqt import FastPointsStyle

# Create fast points layer
fast = map_widget.add_fast_points_layer(
    "fast_points",
    selectable=True,
    style=FastPointsStyle(
        radius=2.5,
        default_color="green",  # Color name or QColor
        selected_radius=6.0,
        selected_color="yellow"
    ),
    cell_size_m=750.0  # Spatial index cell size
)

# Add points (efficient for large datasets)
coords = [(lat, lon), ...]  # millions of points
ids = [f"pt{i}" for i in range(len(coords))]

# Option 1: Single color for all points
fast.add_points(coords, ids=ids)

# Option 2: Per-point colors using QColor objects
from PySide6.QtGui import QColor
colors = [QColor(255, 0, 0, 180), QColor(0, 255, 0, 180), ...]
fast.add_points(coords, ids=ids, colors_rgba=colors)

# Option 3: Per-point colors using color names
colors = ["red", "green", "blue", ...]
fast.add_points(coords, ids=ids, colors_rgba=colors)

# Remove specific points
fast.remove_points(["pt1", "pt2"])

# Update colors of specific points (e.g., selected points)
feature_ids = ["pt10", "pt25", "pt50"]
# Use QColor objects (recommended)
from PySide6.QtGui import QColor
new_colors = [QColor("red"), QColor("green"), QColor("blue")]
fast.set_colors(feature_ids, new_colors)
# Or color names
new_colors = ["red", "green", "blue"]
fast.set_colors(feature_ids, new_colors)

# Temporarily hide/show features (without removing them)
fast.hide_features(["pt100", "pt200"])
fast.show_features(["pt100"])
fast.show_all_features()  # Show all hidden features

# Clear all points
fast.clear()
FastGeoPointsLayer
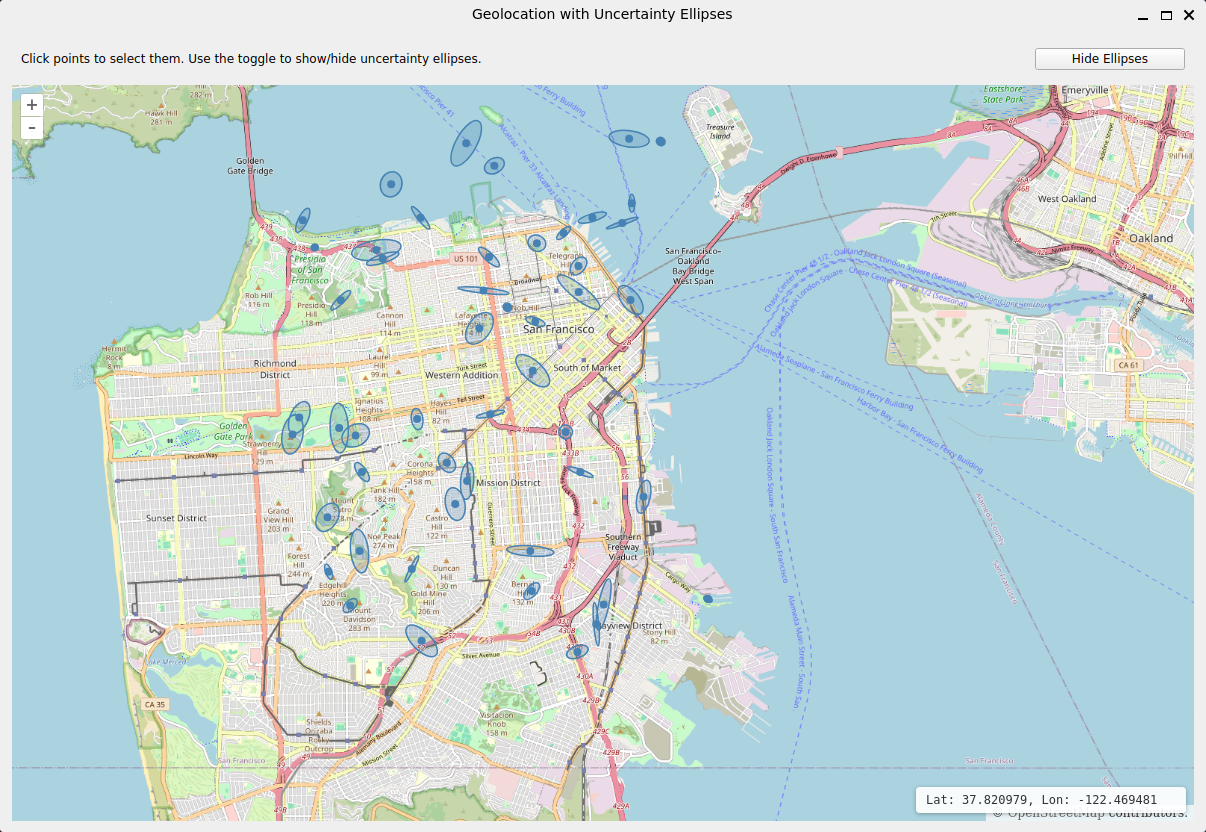
High-performance layer for geolocation data with uncertainty ellipses.
from pyopenlayersqt import FastGeoPointsStyle

# Create fast geo points layer
fast_geo = map_widget.add_fast_geopoints_layer(
    "fast_geo",
    selectable=True,
    style=FastGeoPointsStyle(
        # Point styling
        point_radius=2.5,
        default_color="steelblue",  # Color name or QColor
        selected_point_radius=6.0,
        selected_color="white",
        # Ellipse styling
        ellipse_stroke_color="steelblue",
        ellipse_stroke_width=1.2,
        fill_ellipses=False,
        ellipse_fill_color=QColor(40, 80, 255, 40),
        # Behavior
        ellipses_visible=True,
        min_ellipse_px=0.0,  # Cull tiny ellipses
        max_ellipses_per_path=2000,
        skip_ellipses_while_interacting=True
    ),
    cell_size_m=750.0
)

# Add points with uncertainty ellipses
coords = [(lat, lon), ...]
sma_m = [200.0, 300.0, ...]  # Semi-major axes in meters
smi_m = [100.0, 150.0, ...]  # Semi-minor axes in meters
tilt_deg = [45.0, 90.0, ...]  # Tilt from north in degrees
ids = [f"geo{i}" for i in range(len(coords))]

fast_geo.add_points_with_ellipses(
    coords=coords,
    sma_m=sma_m,
    smi_m=smi_m,
    tilt_deg=tilt_deg,
    ids=ids
)

# Toggle ellipse visibility
fast_geo.set_ellipses_visible(False)

# Update colors of specific points (e.g., selected points)
feature_ids = ["geo5", "geo12", "geo20"]
# Use QColor objects (recommended)
from PySide6.QtGui import QColor
new_colors = [QColor("red"), QColor("green"), QColor("blue")]
fast_geo.set_colors(feature_ids, new_colors)
# Or color names
new_colors = ["red", "green", "blue"]
fast_geo.set_colors(feature_ids, new_colors)

# Temporarily hide/show features (without removing them)
fast_geo.hide_features(["geo100", "geo200"])
fast_geo.show_features(["geo100"])
fast_geo.show_all_features()  # Show all hidden features

# Remove points
fast_geo.remove_ids(["geo1", "geo2"])

# Clear all
fast_geo.clear()
WMSLayer
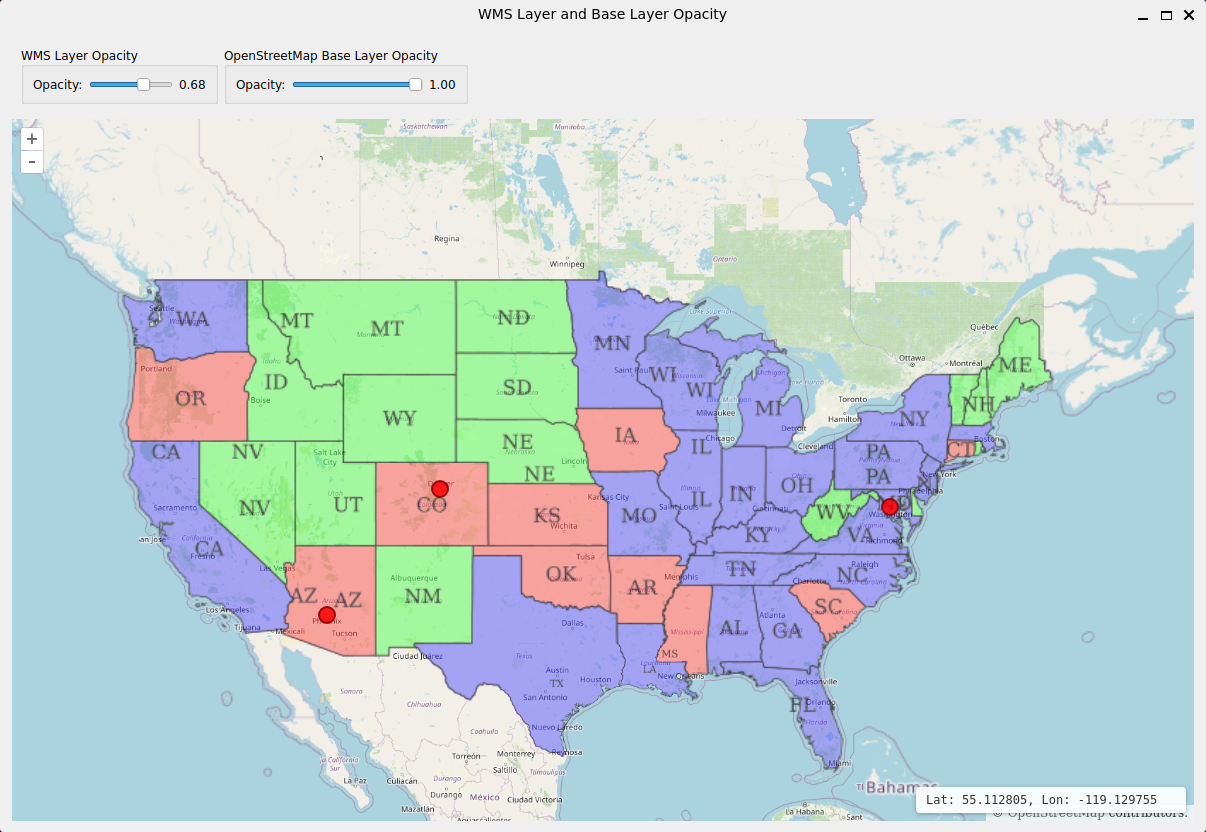
Web Map Service layer integration.
from pyopenlayersqt import WMSOptions

# Add WMS layer
wms_options = WMSOptions(
    url="https://ahocevar.com/geoserver/wms",
    params={
        "LAYERS": "topp:states",
        "TILED": True,
        "FORMAT": "image/png",
        "TRANSPARENT": True
    },
    opacity=0.85
)

wms_layer = map_widget.add_wms(wms_options, name="wms")

# Update WMS parameters
wms_layer.set_params({"LAYERS": "new:layer"})

# Set opacity
wms_layer.set_opacity(0.5)

# Remove layer
wms_layer.remove()
RasterLayer
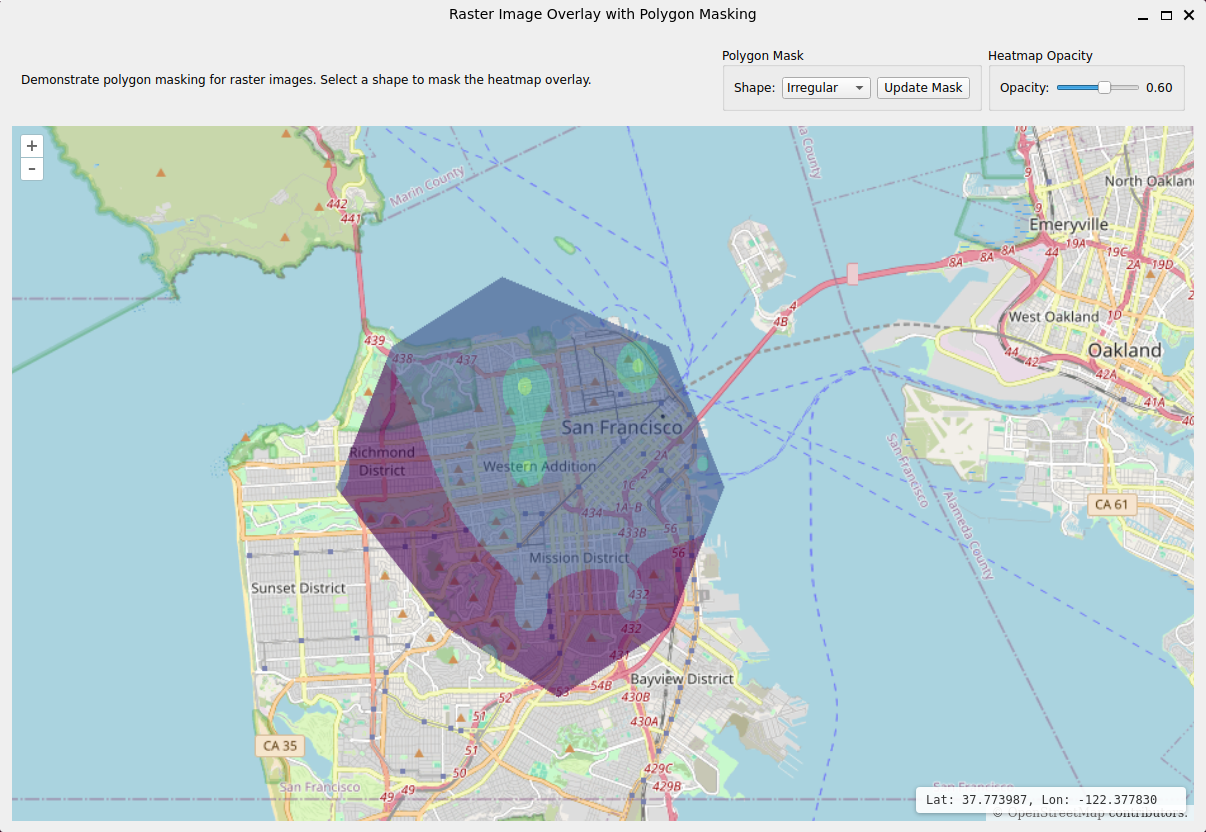
Image overlay layer for heatmaps, imagery, etc.
from pyopenlayersqt import RasterStyle

# Create PNG bytes (example using PIL)
from PIL import Image
import io

img = Image.new('RGBA', (512, 512), color=(255, 0, 0, 128))
buf = io.BytesIO()
img.save(buf, format='PNG')
png_bytes = buf.getvalue()

# Add raster overlay
bounds = [
    (lat_min, lon_min),  # Southwest corner
    (lat_max, lon_max)   # Northeast corner
]

raster = map_widget.add_raster_image(
    png_bytes,  # Can be bytes, file path, or URL
    bounds=bounds,
    style=RasterStyle(opacity=0.6),
    name="heatmap"
)

# Update opacity
raster.set_opacity(0.8)

# Remove layer
raster.remove()
Style Classes
All style classes are immutable dataclasses with sensible defaults:
from pyopenlayersqt import (
    PointStyle,
    PolygonStyle,
    CircleStyle,
    EllipseStyle,
    RasterStyle,
    FastPointsStyle,
    FastGeoPointsStyle
)
from PySide6.QtGui import QColor

# Vector styles use QColor objects or color names (recommended)
point_style = PointStyle(
    radius=5.0,
    fill_color=QColor("red"),        # QColor object (recommended)
    fill_opacity=0.85,
    stroke_color=QColor("black"),    # QColor object
    stroke_width=1.0,
    stroke_opacity=0.9
)

# You can also use color names directly
polygon_style = PolygonStyle(
    stroke_color="red",    # Color name string
    fill_color="green"     # Color name string
)

# Fast layer styles support QColor/color names (recommended)
# Recommended: Using QColor objects or color names
fast_style_qcolor = FastPointsStyle(
    radius=3.0,
    default_color=QColor("steelblue"),  # QColor object
    selected_radius=6.0,
    selected_color="orange"              # Color name string
)

# Legacy (deprecated): Using RGBA tuples
fast_style = FastPointsStyle(
    radius=3.0,
    default_rgba=(255, 51, 51, 204),
    selected_radius=6.0,
    selected_rgba=(0, 255, 255, 255)
)

# Mixed: Both styles (color options take precedence)
fast_style_mixed = FastPointsStyle(
    radius=3.0,
    default_rgba=(255, 51, 51, 204),     # Fallback
    default_color="purple",               # This takes precedence
    selected_radius=6.0,
    selected_color=QColor("yellow")       # This takes precedence
)

# FastGeoPointsStyle supports QColor for all colors (points and ellipses)
geo_style = FastGeoPointsStyle(
    point_radius=4.0,
    default_color="darkgreen",                    # Point color (QColor or color name)
    selected_color=QColor("red"),                 # Selected point color
    ellipse_stroke_color="darkgreen",             # Ellipse stroke color
    ellipse_fill_color=QColor(0, 100, 0, 40),    # Ellipse fill color (with alpha)
    selected_ellipse_stroke_color="red",          # Selected ellipse stroke color
    fill_ellipses=True,
    ellipses_visible=True
)
Key Features:
- QColor Support in ALL Styles: Pass
QColorobjects directly to any color parameter in PointStyle, CircleStyle, PolygonStyle, EllipseStyle, FastPointsStyle, and FastGeoPointsStyle - no need for.name() - Color Names Everywhere: Use color names like
"red","Green","steelblue"directly in all Style classes - Multiple Formats: All styles accept QColor objects, color names, hex strings, and CSS strings (RGBA tuples are deprecated)
- Backward Compatible: Existing code using RGBA tuples or hex colors continues to work
- Z-Ordering: Selected points and ellipses are automatically drawn on top in dense areas
Feature Selection
Selection is synchronized between the map and Python:
# Set selection programmatically
map_widget.set_vector_selection(layer_id, ["feature1", "feature2"])
map_widget.set_fast_points_selection(layer_id, ["pt1", "pt2"])
map_widget.set_fast_geopoints_selection(layer_id, ["geo1", "geo2"])

# Listen to selection changes from map
def on_selection_changed(selection):
    print(f"Layer: {selection.layer_id}")
    print(f"Selected IDs: {selection.feature_ids}")
    print(f"Count: {selection.count}")

map_widget.selectionChanged.connect(on_selection_changed)
Selection and Recoloring
For updating styles of selected features, see the layer-specific methods documented above:
VectorLayer.update_feature_styles()- Update styles for vector featuresFastPointsLayer.set_colors()- Update colors for fast pointsFastGeoPointsLayer.set_colors()- Update colors for fast geo-points
Multi-layer selection workflow example:
# Track selections for all layers (layer_id -> list of feature_ids)
selections = {}

def on_selection_changed(selection):
    global selections
    # Update selections for this layer
    if len(selection.feature_ids) > 0:
        selections[selection.layer_id] = selection.feature_ids
    elif selection.layer_id in selections:
        # Clear selection for this layer
        del selections[selection.layer_id]

    total = sum(len(ids) for ids in selections.values())
    print(f"Total selected: {total} features across {len(selections)} layer(s)")

map_widget.selectionChanged.connect(on_selection_changed)

# Recolor all selected items across all layers
def recolor_selected_red():
    from PySide6.QtGui import QColor
    for layer_id, feature_ids in selections.items():
        if layer_id == vector_layer.id:
            styles = [PointStyle(fill_color="red") for _ in feature_ids]
            vector_layer.update_feature_styles(feature_ids, styles)
        elif layer_id == fast_layer.id:
            colors = [QColor("red") for _ in feature_ids]
            fast_layer.set_colors(feature_ids, colors)
        elif layer_id == fast_geo_layer.id:
            colors = [QColor("red") for _ in feature_ids]
            fast_geo_layer.set_colors(feature_ids, colors)
See examples/09_selection_and_recoloring.py for a complete interactive example.
Deleting Features
Each layer type provides methods to remove features, either individually, in batches, or all at once.
VectorLayer Deletion
# Remove specific features by ID
vector_layer.remove_features(["point1", "polygon2", "circle3"])

# Clear all features from the layer
vector_layer.clear()
FastPointsLayer Deletion
# Remove specific points by ID
fast_layer.remove_points(["pt1", "pt2", "pt100"])

# Clear all points from the layer
fast_layer.clear()
FastGeoPointsLayer Deletion
# Remove specific geo-points by ID
geo_layer.remove_ids(["geo1", "geo2", "geo50"])

# Clear all geo-points from the layer
geo_layer.clear()
Deleting Selected Features
A common pattern is to delete features that the user has selected interactively:
from PySide6.QtGui import QShortcut, QKeySequence

# Track selections across all layers
selections = {}

def on_selection_changed(selection):
    """Update the selections dictionary when selection changes."""
    if len(selection.feature_ids) > 0:
        selections[selection.layer_id] = selection.feature_ids
    elif selection.layer_id in selections:
        del selections[selection.layer_id]

map_widget.selectionChanged.connect(on_selection_changed)

def delete_selected():
    """Delete all currently selected features across all layers."""
    for layer_id, feature_ids in list(selections.items()):
        if layer_id == vector_layer.id:
            vector_layer.remove_features(feature_ids)
        elif layer_id == fast_layer.id:
            fast_layer.remove_points(feature_ids)
        elif layer_id == geo_layer.id:
            geo_layer.remove_ids(feature_ids)

    # Clear selections after deletion
    selections.clear()
    print(f"Deleted features")

# Connect to a button
delete_button.clicked.connect(delete_selected)

# Or add keyboard shortcut (Delete key)
delete_shortcut = QShortcut(QKeySequence.Delete, map_widget)
delete_shortcut.activated.connect(delete_selected)
Removing Entire Layers
To remove an entire layer from the map:
# Remove the layer (also removes all its features)
vector_layer.remove()
fast_layer.remove()
geo_layer.remove()
Complete CRUD Example: See examples/08_table_integration.py for a full working example demonstrating Create, Read, Update, and Delete operations with interactive add/delete buttons and keyboard shortcuts across all layer types.
Distance Measurement Mode
Interactive distance measurement with geodesic calculations:
import json

# Enable measurement mode
map_widget.set_measure_mode(True)

# Listen for measurement events
def on_js_event(event_type, payload_json):
    if event_type == 'measurement':
        data = json.loads(payload_json)
        segment_m = data['segment_distance_m']      # Distance from previous point
        cumulative_m = data['cumulative_distance_m']  # Total distance from start
        lon, lat = data['lon'], data['lat']
        print(f"Point at ({lat:.5f}, {lon:.5f})")
        print(f"Segment: {segment_m:.1f} m, Total: {cumulative_m:.1f} m")

map_widget.jsEvent.connect(on_js_event)

# Clear all measurements
map_widget.clear_measurements()

# Disable measurement mode
map_widget.set_measure_mode(False)
Features:
- Click on map to create measurement anchor points
- Live polyline drawn from last point to cursor
- Tooltip displays segment and cumulative distances
- Uses Haversine formula for accurate great-circle distances
- Lines follow great-circle paths - measurement lines curve to represent the true shortest path on Earth's surface
- Curved paths are especially visible for long distances (e.g., New York to London)
- Press
Escapeto exit measurement mode - Measurement events emitted to Python with distances and coordinates
See examples/11_measurement_tool.py for a complete working example.
FeatureTableWidget
High-performance table widget for displaying and managing features:
from pyopenlayersqt.features_table import FeatureTableWidget, ColumnSpec

# Define columns
columns = [
    ColumnSpec("Layer", lambda r: r.get("layer_kind", "")),
    ColumnSpec("Type", lambda r: r.get("geom_type", "")),
    ColumnSpec("ID", lambda r: r.get("feature_id", "")),
    ColumnSpec(
        "Latitude",
        lambda r: r.get("center_lat", ""),
        fmt=lambda v: f"{float(v):.6f}" if v != "" else ""
    ),
    ColumnSpec(
        "Longitude",
        lambda r: r.get("center_lon", ""),
        fmt=lambda v: f"{float(v):.6f}" if v != "" else ""
    ),
]

# Create table
table = FeatureTableWidget(
    columns=columns,
    key_fn=lambda r: (str(r.get("layer_id", "")), str(r.get("feature_id", ""))),
    debounce_ms=90
)

# Add rows
rows = [
    {
        "layer_kind": "vector",
        "layer_id": "v1",
        "feature_id": "pt1",
        "geom_type": "point",
        "center_lat": 37.7749,
        "center_lon": -122.4194
    }
]
table.append_rows(rows)

# Sync selection: table -> map
def on_table_selection(keys):
    # keys is list of (layer_id, feature_id) tuples
    for layer_id, feature_id in keys:
        # Update map selection based on layer type
        pass

table.selectionKeysChanged.connect(on_table_selection)

# Sync selection: map -> table
def on_map_selection(selection):
    keys = [(selection.layer_id, fid) for fid in selection.feature_ids]
    table.select_keys(keys, clear_first=True)

map_widget.selectionChanged.connect(on_map_selection)
Row removal APIs: remove_keys vs remove_where
FeatureTableWidget provides two row-removal methods for different use cases:
-
table.remove_keys(keys)-
Use when you already know the exact
(layer_id, feature_id)keys to remove. -
Best for map-driven actions like deleting selected features from one or more layers, because keys are already available from selection events.
-
Example:
selected_keys = table.selected_keys()  # [(layer_id, feature_id), ...]
if selected_keys:
    table.remove_keys(selected_keys)
-
-
table.remove_where(predicate)-
Use when removal logic depends on arbitrary row attributes/conditions rather than known keys.
-
Example:
# Remove all rows from a specific layer kind
table.remove_where(lambda row: row.get("layer_kind") == "geo_points")
-
In short: prefer remove_keys for explicit feature-ID removals (typical CRUD
flows), and remove_where for ad-hoc, attribute-based filtering/removal.
RangeSliderWidget
Dual-handle range slider for filtering features by numeric or timestamp ranges:
from pyopenlayersqt.range_slider import RangeSliderWidget
from pyopenlayersqt import FastPointsStyle

# Create a fast points layer (required for hide/show features)
fast_layer = map_widget.add_fast_points_layer(
    "filterable_points",
    selectable=True,
    style=FastPointsStyle(radius=3.0, default_color="green")
)

# Numeric range slider
value_slider = RangeSliderWidget(
    min_val=0.0,
    max_val=100.0,
    step=1.0,
    label="Filter by Value"
)

# Connect to filter function
def on_value_range_changed(min_val, max_val):
    # Filter features based on value range
    visible_ids = [f["id"] for f in features if min_val <= f["value"] <= max_val]
    hidden_ids = [f["id"] for f in features if not (min_val <= f["value"] <= max_val)]

    # Hide/show features on map (FastPointsLayer and FastGeoPointsLayer only)
    if hidden_ids:
        fast_layer.hide_features(hidden_ids)
    if visible_ids:
        fast_layer.show_features(visible_ids)

    # Hide/show rows in table
    layer_id = fast_layer.id
    table.hide_rows_by_keys([(layer_id, fid) for fid in hidden_ids])
    table.show_rows_by_keys([(layer_id, fid) for fid in visible_ids])

value_slider.rangeChanged.connect(on_value_range_changed)

# ISO8601 timestamp range slider
timestamps = ["2024-01-01T00:00:00Z", "2024-01-15T12:00:00Z", "2024-01-31T23:59:59Z"]
timestamp_slider = RangeSliderWidget(
    values=sorted(set(timestamps)),  # Unique sorted timestamps
    label="Filter by Timestamp"
)

timestamp_slider.rangeChanged.connect(on_timestamp_range_changed)

# Reset filters - show all features again
fast_layer.show_all_features()  # Show all on map
table.show_all_rows()  # Show all in table
See examples/10_range_slider_filtering.py for a complete working example with map and table filtering.
Complete Example
For a comprehensive demonstration of all features, see the complete working example at examples/08_table_integration.py. This example includes:
- Vector and fast points layers
- Feature table with bidirectional selection sync
- Sample data generation
- Layer management
View Extent Tracking
Monitor map extent changes for dynamic data loading:
# One-time extent request
def on_extent(extent):
    print(f"Extent: {extent['lon_min']}, {extent['lat_min']} to "
          f"{extent['lon_max']}, {extent['lat_max']}")
    print(f"Zoom: {extent['zoom']}, Resolution: {extent['resolution']}")

map_widget.get_view_extent(on_extent)

# Watch extent changes (debounced)
def on_extent_changed(extent):
    # Load data for current extent
    load_data_for_extent(extent)

handle = map_widget.watch_view_extent(on_extent_changed, debounce_ms=150)

# Stop watching
handle.cancel()
Advanced: Direct JavaScript Communication
For advanced use cases, you can send custom messages to the JavaScript bridge:
# Send custom message to JavaScript
map_widget.send({
    "type": "custom_command",
    "param1": "value1",
    "param2": 123
})

# Listen to JavaScript events
def on_js_event(event_type, payload_json):
    print(f"Event: {event_type}, Payload: {payload_json}")

map_widget.jsEvent.connect(on_js_event)
Performance Tips
- Use Fast Layers for Large Datasets: For > 1000 points, use
FastPointsLayerorFastGeoPointsLayerinstead of vector layers - Tune Cell Size: Adjust
cell_size_mparameter based on your data density (larger = faster, but less precise selection) - Chunk Large Additions:
FastGeoPointsLayer.add_points_with_ellipses()automatically chunks data (default 50k points per chunk) - Debounce Extent Watching: Use appropriate
debounce_mswhen watching extent changes to avoid excessive updates - Cull Tiny Ellipses: Set
min_ellipse_pxinFastGeoPointsStyleto skip rendering very small ellipses - Skip Ellipses While Interacting: Enable
skip_ellipses_while_interactingfor smoother panning/zooming
Architecture
- Python → JavaScript: Commands sent via
window.pyolqt_send() - JavaScript → Python: Events sent via Qt Web Channel (
qtBridge.emitEvent()) - Static Assets: Served by embedded HTTP server (wheel-safe)
- Raster Overlays: Written to user cache directory and served dynamically
License
MIT License
Contributing
Contributions are welcome! Please feel free to submit issues or pull requests.
For maintainers, see CONTRIBUTING.md for information on creating releases and publishing to PyPI.
Credits
Built with:
- OpenLayers - High-performance web mapping library
- PySide6 - Qt for Python
- NumPy - Numerical computing
- Matplotlib - Plotting and colormaps
Project details
Verified details
These details have been verified by PyPIProject links
GitHub Statistics
Maintainers
Release history Release notifications | RSS feed


Download files
Download the file for your platform. If you're not sure which to choose, learn more about installing packages.
Source Distribution
Built Distribution
Filter files by name, interpreter, ABI, and platform.
If you're not sure about the file name format, learn more about wheel file names.
Copy a direct link to the current filters
File details
Details for the file pyopenlayersqt-0.6.1.tar.gz.
File metadata
- Download URL: pyopenlayersqt-0.6.1.tar.gz
- Upload date:
- Size: 303.1 kB
- Tags: Source
- Uploaded using Trusted Publishing? Yes
- Uploaded via: twine/6.1.0 CPython/3.13.7
File hashes
| Algorithm | Hash digest | |
|---|---|---|
| SHA256 |
bfb4bb866ad252cee07d80b46e82b8e3482616482f605a59c965b5ec39a01098
|
|
| MD5 |
d5cbc0df9e1c1d6a91116ecaab02af89
|
|
| BLAKE2b-256 |
1d066c0a951a053b85a1f8d473be57479a0965d6ec3df572273d4ef420575709
|
Provenance
The following attestation bundles were made for pyopenlayersqt-0.6.1.tar.gz:
Publisher:
publish.yml on crroush/pyopenlayersqt
-
Statement:
-
Statement type:
https://in-toto.io/Statement/v1 -
Predicate type:
https://docs.pypi.org/attestations/publish/v1 -
Subject name:
pyopenlayersqt-0.6.1.tar.gz -
Subject digest:
bfb4bb866ad252cee07d80b46e82b8e3482616482f605a59c965b5ec39a01098 - Sigstore transparency entry: 929113877
- Sigstore integration time:
-
Permalink:
crroush/pyopenlayersqt@2852fd3dd7da26c8a3262ad50461dfa2a660f74c -
Branch / Tag:
refs/tags/v0.6.1 - Owner: https://github.com/crroush
-
Access:
public
-
Token Issuer:
https://token.actions.githubusercontent.com -
Runner Environment:
github-hosted -
Publication workflow:
publish.yml@2852fd3dd7da26c8a3262ad50461dfa2a660f74c -
Trigger Event:
push
-
Statement type:
File details
Details for the file pyopenlayersqt-0.6.1-py3-none-any.whl.
File metadata
- Download URL: pyopenlayersqt-0.6.1-py3-none-any.whl
- Upload date:
- Size: 288.8 kB
- Tags: Python 3
- Uploaded using Trusted Publishing? Yes
- Uploaded via: twine/6.1.0 CPython/3.13.7
File hashes
| Algorithm | Hash digest | |
|---|---|---|
| SHA256 |
aeff86fedebc3b64ab47d9fae76fe8fc7a5451a86f0a1a1e8b1b26c1f50ee096
|
|
| MD5 |
038938ae5f1aa04309f87325d44a2103
|
|
| BLAKE2b-256 |
30d0d61daade9d7e5b2b1638510e3f3c9e95d4cd5609b538e6a07ca8477c58cc
|
Provenance
The following attestation bundles were made for pyopenlayersqt-0.6.1-py3-none-any.whl:
Publisher:
publish.yml on crroush/pyopenlayersqt
-
Statement:
-
Statement type:
https://in-toto.io/Statement/v1 -
Predicate type:
https://docs.pypi.org/attestations/publish/v1 -
Subject name:
pyopenlayersqt-0.6.1-py3-none-any.whl -
Subject digest:
aeff86fedebc3b64ab47d9fae76fe8fc7a5451a86f0a1a1e8b1b26c1f50ee096 - Sigstore transparency entry: 929113878
- Sigstore integration time:
-
Permalink:
crroush/pyopenlayersqt@2852fd3dd7da26c8a3262ad50461dfa2a660f74c -
Branch / Tag:
refs/tags/v0.6.1 - Owner: https://github.com/crroush
-
Access:
public
-
Token Issuer:
https://token.actions.githubusercontent.com -
Runner Environment:
github-hosted -
Publication workflow:
publish.yml@2852fd3dd7da26c8a3262ad50461dfa2a660f74c -
Trigger Event:
push
-
Statement type:






