Generate SVG Entity Relationship Diagrams from PostgreSQL database dump files
Verified details
These details have been verified by PyPIProject links
GitHub Statistics
Maintainers

Project description
pypgsvg - Lightweight PostgreSQL ERD Generator
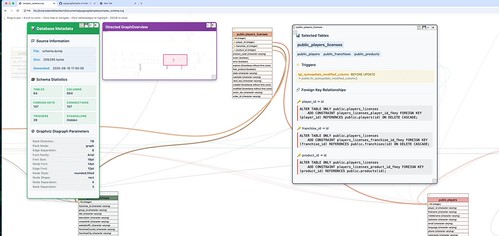
pypgsvg is a lightweight Python tool that generates a JS/CSS/SVG interactive Entity Relationship Diagrams (ERDs) from PostgreSQL schema dump files. With only Graphviz as a dependency, manually run or place in CI/CD pipelines, fast rapid deployment verification scenarios.
Installation
Can be found on pypi:
-
Install
pypgsvg:pip install pypgsvg
-
Install Graphviz (external dependency):
- macOS:
brew install graphviz - Ubuntu/Debian:
sudo apt-get install graphviz - CentOS/RHEL:
sudo yum install graphviz - Windows: Download from Graphviz.org
- macOS:
That's it!
Quick Demo
Feature Demonstrations
Smart Navigation & Initial View
On load, the diagram automatically identifies and focuses on your schema's most connected table, providing immediate insight into the database architecture.
Double-Click to Explore Relationships
Double-click any table to instantly zoom and center on all its connected relationships. Perfect for exploring complex schemas interactively.
Real-Time Graphviz Settings
Modify layout parameters in real-time through the Metadata Panel. Change rank direction, spacing, and packmode settings to visualize your schema from different perspectives.
Focused ERD Generation
Select specific tables and generate a simplified, focused diagram. Customize layout settings and create clean sub-diagrams for documentation or presentations.
Database Querying & Switching
When connected to a PostgreSQL server, browse available databases with table counts and switch between them seamlessly without restarting.
Print-Friendly Export
Generate clean, professional diagrams optimized for printing, PDFs, and documentation by automatically hiding interactive UI elements.
Try it yourself:
# Download sample and generate interactive ERD
wget https://github.com/blackburnd/pypgsvg/raw/main/Samples/complex_schema.dump
pypgsvg schema.dump --output demo_erd --view
️ Enterprise Usage
Quick Start - Schema Analysis
# Generate interactive ERD from schema dump
pypgsvg schema.dump --output database_erd --view

# Connect directly to PostgreSQL database with interactive features
pypgsvg --host localhost --port 5432 --database mydb --user postgres --output live_erd --view

# Enterprise automation (CI/CD ready)
pypgsvg Samples/complex_schema.dump --output Samples/complex_schema --rankdir LR --node-sep 4
Advanced Enterprise Options
# Large schema optimization
pypgsvg Samples/complex_schema.dump --output Samples/complex_schema --rankdir LR --node-sep 4

# Direct database connection with custom layout
pypgsvg --host prod-db.company.com --port 5432 --database analytics \
  --user readonly --node-shape=ellipse --show-standalone=false \
  --output=./docs/analytics_schema --rankdir LR --node-sep 2 --packmode graph

# Custom layout for presentations and documentation
pypgsvg schema.dump --rankdir LR --fontsize 20 --node-fontsize 16 --output presentation_erd

# Interactive mode for database exploration
pypgsvg --host localhost --database mydb --user postgres --view
# Then use the UI to:
# - Browse and switch between databases
# - Modify Graphviz settings in real-time
# - Generate focused ERDs of specific subsystems
# - Export print-friendly versions for documentation
Usage
Option 1: From Schema Dump File
Get Your PostgreSQL Schema
If you don't have a schema dump, generate one with pg_dump:
# Standard schema export (most common)
pg_dump -h your-host -d database -U username -s --no-owner --no-privileges > schema.dump

# Comprehensive export with triggers and functions
pg_dump -h your-host -d database -U username -s -O -F plain --disable-triggers --encoding=UTF8 > schema.dump
Or use our sample schema for testing.
Generate Interactive ERD
Basic usage:
pypgsvg schema.dump --output my_database_erd --view
Advanced usage:
pypgsvg schema.dump \
  --output docs/database_architecture \
  --rankdir TB \
  --node-sep 4 \
  --packmode graph \
  --rank-sep 3 \
  --hide-standalone
Option 2: Direct Database Connection
Connect directly to a live PostgreSQL database for interactive exploration:
Basic connection:
pypgsvg --host localhost --port 5432 --database mydb --user postgres --view
Production database (read-only):
pypgsvg --host prod-db.company.com --port 5432 \
  --database production --user readonly \
  --output prod_schema --view
Benefits of database connection mode:
- 🗄️ Query available databases - Browse all databases you have access to
- 🔄 Switch databases dynamically - No need to regenerate or restart
- 📊 View table counts - See database size before loading
- ⚡ Real-time schema - Always see the current database structure
Interactive features in --view mode:
- Browse and switch between databases on the server
- Modify Graphviz settings and regenerate layouts in real-time
- Select tables to create focused sub-diagrams
- Generate print-friendly exports for documentation
- Double-click navigation and smart initial zoom
The generated SVG includes:
- 🎯 Smart initial zoom - Automatically selects and focuses on the table with most connections
- 🖱️ Double-click navigation - Double-click any table to zoom to all connected relationships
- 📊 Real-time diagram regeneration - Modify Graphviz settings and regenerate instantly
- 🔍 Focused ERD creation - Select specific tables to generate simplified sub-diagrams
- 🗄️ Database querying - Browse and switch between databases on your PostgreSQL server
- 📱 Miniature navigator - Interactive overview panel for large schemas
- 🖨️ Print-friendly export - Clean diagram output for documentation
- 📋 Copy/download tools - Export SQL definitions and selected elements
- 🎨 Resizable panels - Fully customizable workspace layout
- ⌨️ Keyboard shortcuts - ESC/R to reset view, pan and zoom controls
Note: For full interactivity, open the SVG file locally in your browser. GitHub restricts JavaScript for security.
Scriptable API
Perfect for automation and enterprise workflows:
from pypgsvg import parse_sql_dump, generate_erd_with_graphviz

# Parse schema dump
with open("schema.dump", "r", encoding='utf-8') as file:
    sql_content = file.read()

# Extract database structure
tables, foreign_keys, triggers, errors = parse_sql_dump(sql_content)

# Generate interactive ERD
if not errors:
    generate_erd_with_graphviz(
        tables=tables,
        foreign_keys=foreign_keys,
        output_file="enterprise_diagram",
        rankdir='TB',
        packmode='graph'
    )
    print("✅ Enterprise ERD generated successfully!")
else:
    print("⚠️ Parsing errors:", errors)
⚙️ Complete Command-Line Reference
Core Arguments
| Argument | Type | Default | Description |
|---|---|---|---|
input_file |
Optional | - | Path to the PostgreSQL dump file (optional if using database connection) |
-o, --output |
String | schema_erd |
Output file name (without extension) |
--view |
Flag | false |
Open the generated SVG in a browser with full interactive features |
--show-standalone |
String | true |
Show/hide tables with no foreign key relationships |
Database Connection Arguments
For connecting directly to a PostgreSQL database instead of using a dump file:
| Argument | Type | Default | Description |
|---|---|---|---|
--host |
String | - | PostgreSQL server hostname or IP address |
--port |
Integer | 5432 |
PostgreSQL server port |
--database |
String | - | Database name to connect to |
--user |
String | - | Database username for authentication |
Note: When using database connection mode with --view, you can:
- Query and browse all databases you have access to
- Switch between databases without restarting
- See table counts for each database
- Generate ERDs from live database schemas
Layout & Positioning
| Argument | Type | Default | Options | Description |
|---|---|---|---|---|
--packmode |
String | array |
array, cluster, graph |
Graphviz packmode - Controls how components are packed together |
--rankdir |
String | TB |
TB, LR, BT, RL |
Graphviz rankdir - Graph direction (Top-Bottom, Left-Right, etc.) |
--esep |
String | 8 |
Any number | Graphviz esep - Edge separation distance in points |
--node-sep |
String | 0.5 |
Any number | Graphviz nodesep - Minimum distance between nodes |
--rank-sep |
String | 1.2 |
Any number | Graphviz ranksep - Distance between ranks/levels |
Typography & Styling
| Argument | Type | Default | Description |
|---|---|---|---|
--fontname |
String | Arial |
Font family for all text elements |
--fontsize |
Integer | 18 |
Font size for graph title/labels |
--node-fontsize |
Integer | 14 |
Font size for table names and column text |
--edge-fontsize |
Integer | 12 |
Font size for relationship labels |
--node-style |
String | rounded,filled |
Graphviz node style (e.g., filled, rounded,filled) |
--node-shape |
String | rect |
Graphviz node shape (e.g., rect, ellipse, box) |
Color & Visual Enhancement
| Argument | Type | Default | Description |
|---|---|---|---|
--saturate |
Float | 1.8 |
Color saturation multiplier for table backgrounds |
--brightness |
Float | 1.0 |
Brightness adjustment for table colors |
Understanding Graphviz Parameters
Packmode Options
array(default): Tables arranged in a regular grid patterncluster: Groups related tables together spatiallygraph: Optimizes overall graph layout, best for complex schemas
Rankdir Options
TB(Top-Bottom): Traditional vertical flow, tables flow downwardLR(Left-Right): Horizontal flow, good for wide displaysBT(Bottom-Top): Reverse vertical flowRL(Right-Left): Reverse horizontal flow
Distance Parameters
esep: Controls spacing between edges (relationship lines)node-sep: Minimum distance between table nodesrank-sep: Distance between different levels/ranks of tables
Advanced Filtering
Tables are automatically excluded based on common patterns:
- Views:
vw_*,*_view - Temporary:
*_temp,*_tmp,temp_* - Backup:
*_bk,*_backup,*_old - Audit/Log:
*_log,*_audit,audit_* - Duplicates:
*_dups,*_duplicates - Archives:
*_archive,archive_*
Use --show-standalone false to hide tables with no foreign key relationships.
🎯 Interactive Features
The generated SVG provides a rich interactive experience with powerful navigation and analysis capabilities:
🎬 Smart Initial View
On load, the diagram automatically:
- Identifies the table with the most connections and selects it
- Zooms to show all related tables for immediate context
- Highlights relationships to visualize the data flow
This intelligent starting point helps you quickly understand the core of your database architecture.
🖱️ Interactive Navigation
Double-Click Navigation:
- Double-click any table to instantly zoom and center the view on that table and all its connected relationships
- Automatically highlights all foreign key connections for visual clarity
- Perfect for exploring complex schemas and understanding table dependencies
Mouse & Keyboard Controls:
- Click and drag to pan around the diagram
- Scroll wheel to zoom in/out
- Press ESC or R to reset the view to initial zoom level
- Click tables/edges to view detailed SQL information
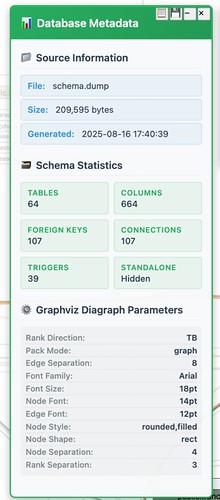
📊 Interactive Panels
All panels can be moved, resized, minimized, and positioned to suit your workflow:
Metadata Panel
Comprehensive database schema information and controls:
- Schema statistics (table count, columns, relationships)
- ⚙️ Graphviz Settings - Modify and regenerate the diagram layout in real-time
- Change rank direction (TB, LR, BT, RL)
- Adjust node and rank separation
- Modify packmode settings
- Apply changes instantly to see different visualizations
- 🗄️ Database Connection - Query live databases (when using
--viewmode)- Connect to PostgreSQL servers
- Browse available databases with table counts
- Switch between databases seamlessly
- 🖨️ Print-Friendly View - Generate clean diagrams for documentation
- Generation parameters and file information
Miniature Overview
Navigate large schemas effortlessly:
- Interactive minimap with real-time viewport indicator
- Click to jump to specific schema areas instantly
- Drag viewport rectangle for precise navigation
- Resizable panel for detailed or compact overview
Selection Details Panel
View, analyze, and export SQL definitions:
- Table definitions with complete column details and constraints
- Foreign key relationships with full SQL syntax
- Trigger information including execution details
- 🔍 Generate Focused ERD - Create a new diagram with only selected tables
- Select multiple tables and edges
- Customize Graphviz settings for the focused view
- Generate a clean, simplified diagram of just the relevant parts
- 📋 Copy button for instant clipboard access
- 💾 Download button for formatted text export
- Enterprise-friendly output options
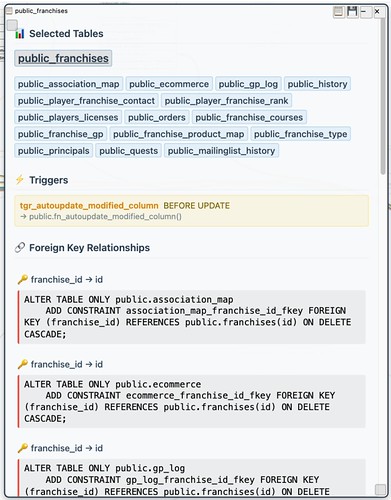
Example selection output:
📊 Selected Tables
==================
public_franchises
public_association_map
public_ecommerce
...

🔗 Foreign Key Relationships
============================
🔑 franchise_id → id
ALTER TABLE ONLY public.association_map
    ADD CONSTRAINT association_map_franchise_id_fkey
    FOREIGN KEY (franchise_id) REFERENCES public.franchises(id)
    ON DELETE CASCADE;
🔄 Dynamic Diagram Generation
Graphviz Settings Modification:
- Access settings through the Metadata Panel
- Modify layout parameters in real-time:
- Rank Direction: Control graph flow (TB=Top-Bottom, LR=Left-Right, BT=Bottom-Top, RL=Right-Left)
- Node Separation: Adjust spacing between tables (numeric value, default 0.5)
- Rank Separation: Control distance between hierarchy levels (numeric value, default 1.2)
- Packmode: Choose how components are arranged (array=grid pattern, cluster=group related, graph=optimize layout)
- Apply Settings button regenerates the diagram instantly
- No need to restart or regenerate from command line
Focused ERD Generation:
- Select specific tables and relationships in the diagram
- Click "Generate Focused ERD" in the Selection Panel
- Customize layout settings for the focused view
- Creates a new, simplified diagram with only selected elements
- Perfect for documentation, presentations, or analyzing specific subsystems
🗄️ Database Server Integration
When using --view mode with database connection parameters:
- Query available databases on the PostgreSQL server
- Browse databases with table counts to understand schema size
- Switch databases on-the-fly without restarting
- Test connections before loading schemas
- Real-time schema loading directly from the database
🖨️ Print-Friendly Export
Generate clean, professional diagrams for documentation:
- Print button in the Metadata Panel
- Automatically hides interactive UI elements
- Resets zoom to show full ERD optimally
- Clean output suitable for:
- PDF generation
- Documentation
- Presentations
- Architecture reviews
For detailed testing instructions, see the Testing Guide.
Quality metrics:
- ✅ 95%+ code coverage
- ✅ 70+ comprehensive tests
- ✅ Cross-platform compatibility
🏗️ Architecture & Performance
Lightweight Design
📦 pypgsvg/
├── 🐍 Pure Python core (~450 lines)
├── 🎨 CSS styling (~200 lines)
├── ⚡ JavaScript interactivity (~2000 lines)
├── 🧪 Comprehensive tests (~1000+ lines)
└── 📚 Zero runtime dependencies (except Graphviz)
Performance characteristics:
- Fast parsing - Processes large schemas in seconds
- Memory efficient - Minimal footprint for enterprise deployment
- Scalable output - Handles schemas with hundreds of tables
- Quick startup - No database connections or heavy frameworks
Enterprise-Ready Features
- 🔒 Security-focused - No network requirements, processes local files only
- 📋 Audit-friendly - Deterministic output for version control
- 🚀 Container-ready - Minimal Docker image size
- ⚙️ Configurable - Extensive customization options
- 📊 Monitoring - Built-in error reporting and validation
⚙️ Configuration & Customization
Advanced Layout Options
# Horizontal layout for wide displays
pypgsvg schema.dump --rankdir LR --node-sep 3 --rank-sep 2

# Compact layout for presentations
pypgsvg schema.dump --packmode graph --fontsize 16 --node-fontsize 14

# Large schema optimization
pypgsvg schema.dump --hide-standalone --esep 8 --rank-sep 4
Table Filtering (Automatic)
Enterprise-focused exclusions for cleaner diagrams:
- Views (
vw_*) - Database views - Backup tables (
*_bk,*_backup) - Temporary backup data - Utility tables (
*_temp,*_tmp) - Temporary processing tables - Log tables (
*_log,*_audit) - Audit and logging tables - Duplicate tables (
*_dups,*_duplicates) - Data cleanup tables - Version tables (
*_old,*_archive) - Historical data tables
Color & Accessibility
- WCAG-compliant color palette with proper contrast ratios
- Automatic text color calculation for readability
- Color-blind friendly palette selection
- High-contrast mode for professional presentations
🚨 Error Handling & Reliability
Error management:
- Graceful degradation - Continues processing despite individual parsing errors
- Detailed error reporting - Specific line numbers and context
- Encoding resilience - Handles various character encodings
- Malformed SQL recovery - Attempts to extract partial information
- Validation checks - Ensures output integrity
Logging:
# Built-in error collection for monitoring
tables, foreign_keys, triggers, errors = parse_sql_dump(sql_content)

if errors:
    for error in errors:
        log.warning(f"Schema parsing issue: {error}")
    # Continue with partial results
🤝 Contributing
Welcome users and contributors:
- Code quality - Follow PEP 8 and maintain >95% test coverage
- Enterprise focus - Consider automation and deployment scenarios
- Performance - Optimize for large schemas and CI/CD usage
- Documentation - Update examples for enterprise use cases
- Testing - Add tests for new SQL patterns and edge cases
Required
- Python 3.8+ (standard in most enterprise environments)
- Graphviz (system package, widely available)
Development/Testing Only
- Node.js/npm - Required for running browser tests only
pytest>=7.0.0- Testing frameworkpytest-cov>=4.0.0- Coverage reportingplaywright>=1.37.0- Browser testing framework
Development Setup
Quick Install (From Source)
If you're cloning the repository for development, use the automated installer:
# Clone the repository
git clone https://github.com/blackburnd/pypgsvg.git
cd pypgsvg

# Run the automated installer
./install.sh
The installer will:
- Detect your operating system (macOS, Ubuntu/Debian, CentOS/RHEL)
- Install Graphviz system package
- Install Node.js and npm
- Create Python virtual environment
- Install Python dependencies
- Install Playwright browser binaries
Supported platforms: macOS (with Homebrew), Ubuntu/Debian, CentOS/RHEL
Manual Setup
If the automated installer doesn't support your system:
# 1. Install system dependencies
brew install graphviz node  # macOS
# or
sudo apt-get install graphviz nodejs npm  # Ubuntu/Debian

# 2. Create virtual environment and install Python dependencies
python3 -m venv venv
source venv/bin/activate
pip install -e ".[test]"

# 3. Install Playwright browsers
npx playwright install
Testing
The project includes both unit tests (Python) and functional tests (browser-based).
Quick Start
Use the provided test runner script which handles environment setup:
# Run unit tests
./run-tests.sh

# Run browser tests
./run-tests.sh --browser
Project details
Verified details
These details have been verified by PyPIProject links
GitHub Statistics
Maintainers
Release history Release notifications | RSS feed


Download files
Download the file for your platform. If you're not sure which to choose, learn more about installing packages.
Source Distribution
Built Distribution
Filter files by name, interpreter, ABI, and platform.
If you're not sure about the file name format, learn more about wheel file names.
Copy a direct link to the current filters
File details
Details for the file pypgsvg-1.2.4.tar.gz.
File metadata
- Download URL: pypgsvg-1.2.4.tar.gz
- Upload date:
- Size: 1.6 MB
- Tags: Source
- Uploaded using Trusted Publishing? Yes
- Uploaded via: twine/6.1.0 CPython/3.13.7
File hashes
| Algorithm | Hash digest | |
|---|---|---|
| SHA256 |
c48a68837574828cfd5f64ace92f5a80c6b03435ddca993eaad334f048648dff
|
|
| MD5 |
2f260d219bedcd244faba462384294bb
|
|
| BLAKE2b-256 |
480a27e6b82d114d79068f6ad36609750b15e0517aaedaa00fe165381735731f
|
Provenance
The following attestation bundles were made for pypgsvg-1.2.4.tar.gz:
Publisher:
publish.yml on blackburnd/pypgsvg
-
Statement:
-
Statement type:
https://in-toto.io/Statement/v1 -
Predicate type:
https://docs.pypi.org/attestations/publish/v1 -
Subject name:
pypgsvg-1.2.4.tar.gz -
Subject digest:
c48a68837574828cfd5f64ace92f5a80c6b03435ddca993eaad334f048648dff - Sigstore transparency entry: 778225542
- Sigstore integration time:
-
Permalink:
blackburnd/pypgsvg@aaf4e3d128ff7960371516bdaba2066a9d47f339 -
Branch / Tag:
refs/tags/v1.2.4 - Owner: https://github.com/blackburnd
-
Access:
public
-
Token Issuer:
https://token.actions.githubusercontent.com -
Runner Environment:
github-hosted -
Publication workflow:
publish.yml@aaf4e3d128ff7960371516bdaba2066a9d47f339 -
Trigger Event:
push
-
Statement type:
File details
Details for the file pypgsvg-1.2.4-py3-none-any.whl.
File metadata
- Download URL: pypgsvg-1.2.4-py3-none-any.whl
- Upload date:
- Size: 94.6 kB
- Tags: Python 3
- Uploaded using Trusted Publishing? Yes
- Uploaded via: twine/6.1.0 CPython/3.13.7
File hashes
| Algorithm | Hash digest | |
|---|---|---|
| SHA256 |
d8a87190ea2d92a3d6a73655eaec817636182740523e03d035a8f6213127ab2d
|
|
| MD5 |
1e25125a97c628fbd953ba76d4c960ea
|
|
| BLAKE2b-256 |
32301bd070885d580c76e6ad32768433ba0358e48e8c949a0f2aee33b54c98f2
|
Provenance
The following attestation bundles were made for pypgsvg-1.2.4-py3-none-any.whl:
Publisher:
publish.yml on blackburnd/pypgsvg
-
Statement:
-
Statement type:
https://in-toto.io/Statement/v1 -
Predicate type:
https://docs.pypi.org/attestations/publish/v1 -
Subject name:
pypgsvg-1.2.4-py3-none-any.whl -
Subject digest:
d8a87190ea2d92a3d6a73655eaec817636182740523e03d035a8f6213127ab2d - Sigstore transparency entry: 778225552
- Sigstore integration time:
-
Permalink:
blackburnd/pypgsvg@aaf4e3d128ff7960371516bdaba2066a9d47f339 -
Branch / Tag:
refs/tags/v1.2.4 - Owner: https://github.com/blackburnd
-
Access:
public
-
Token Issuer:
https://token.actions.githubusercontent.com -
Runner Environment:
github-hosted -
Publication workflow:
publish.yml@aaf4e3d128ff7960371516bdaba2066a9d47f339 -
Trigger Event:
push
-
Statement type:


