
Matplotlib sixel backend.
It can draw matplotlib figures in SIXEL available terminal.
Install
pip install matplotlib
pip install pyplotsixel
Example
Add a matplotlib.use() line as follows.
import matplotlib
import matplotlib.pyplot as plt
import numpy as np

matplotlib.use('module://pyplotsixel')


x = np.linspace(0, 1)
y = x**2
plt.plot(x, y)
plt.show();
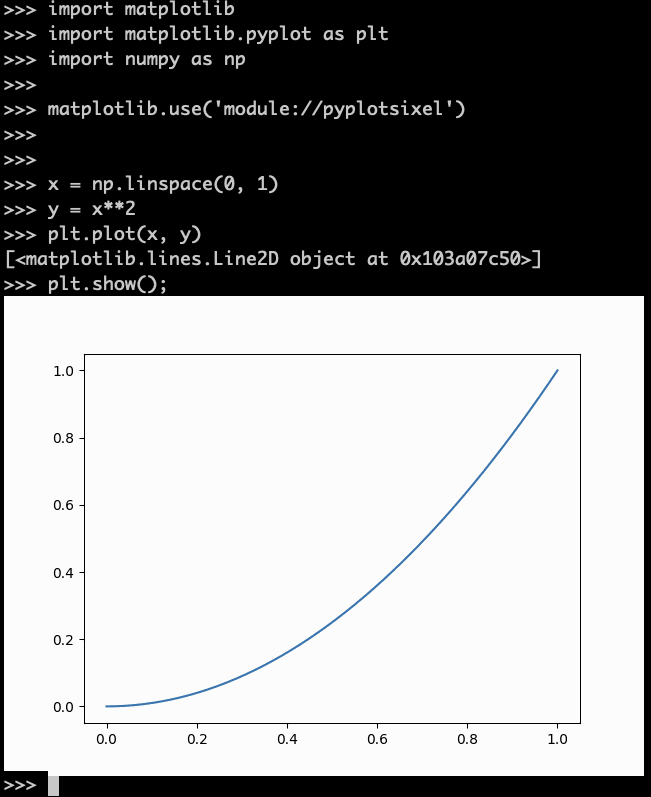
Configuration
In the matplotlibrc , if you wrote backend configuration
backend: module://pyplotsixel
you can omit additional matplotlib.use() line.
1 maintainer

Metadata
1 maintainer
Release files for pyplotsixel 0.3.1
For a detailed explanation of source distributions (sdists) and built distributions (wheels), please see the package formats documentation.
Source distribution (sdist)
| File | Size | Uploaded | |
|---|---|---|---|
| pyplotsixel-0.3.1.tar.gz | 4.2 kB | Details |
Release files / pyplotsixel-0.3.1.tar.gz
| Download URL | pyplotsixel-0.3.1.tar.gz |
|---|---|
| Size | 4.2 kB |
| Tags | Source |
|
SHA-256 checksum How to use checksums |
5d3e3ac095f75cc59839c4e7b1f227d84ef30986819e2f720daf4801971fdf8e
|
|
BLAKE2b-256 checksum How to use checksums |
d5b2b585d9cb57e54bf13c33214ad64036ce193b3f5239bece67bcb0a41d6df8
|
| Upload date | |
|
Uploaded using Trusted Publishing? What is trusted publishing? |
No |
| Uploaded via |
twine/6.2.0 CPython/3.14.3
|














