Matplotlib sixel backend

Project description
Matplotlib sixel backend.
It can draw matplotlib figures in SIXEL available terminal.
Install
pip install matplotlib
pip install pyplotsixel
Example
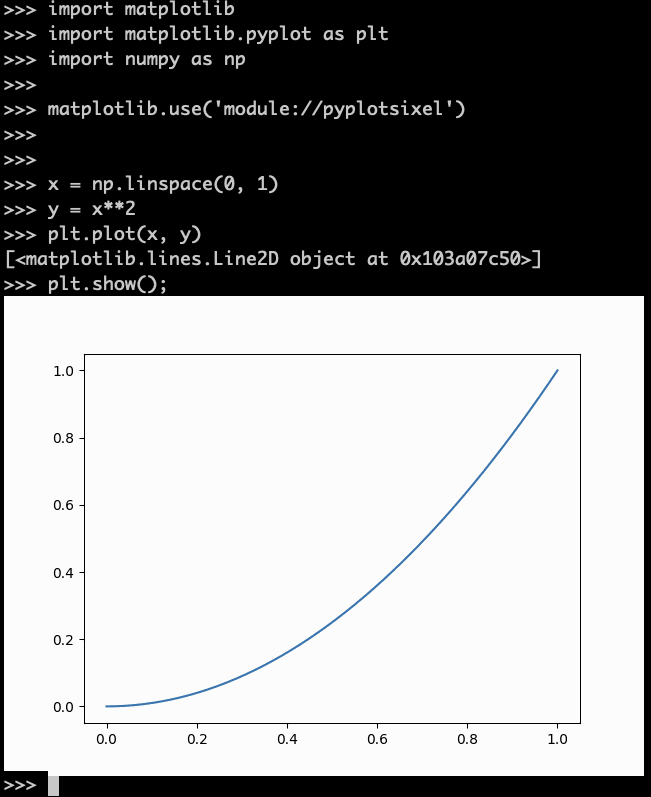
Add a matplotlib.use() line as follows.
import matplotlib
import matplotlib.pyplot as plt
import numpy as np

matplotlib.use('module://pyplotsixel')


x = np.linspace(0, 1)
y = x**2
plt.plot(x, y)
plt.show();
Configuration
In the matplotlibrc , if you wrote backend configuration
backend: module://pyplotsixel
you can omit additional matplotlib.use() line.


Download files
Download the file for your platform. If you're not sure which to choose, learn more about installing packages.
Source Distribution
pyplotsixel-0.3.0.tar.gz
(3.2 kB
view details)
File details
Details for the file pyplotsixel-0.3.0.tar.gz.
File metadata
- Download URL: pyplotsixel-0.3.0.tar.gz
- Upload date:
- Size: 3.2 kB
- Tags: Source
- Uploaded using Trusted Publishing? No
- Uploaded via: twine/6.2.0 CPython/3.14.3
File hashes
| Algorithm | Hash digest | |
|---|---|---|
| SHA256 |
58ea89a17a481c6e69bda4ddac4e6be586c59e5349fc615fe512593909903ac3
|
|
| MD5 |
7cacdde427410730c3ee758d5073f27b
|
|
| BLAKE2b-256 |
d2554b714225692596b219614e5ed12d638890f71ab2113cbb1e6273e3b56256
|


