SVG Hiveplot Python API


Project description
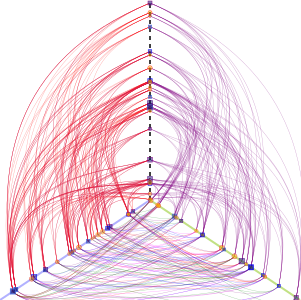
A nice way of visualizing complex networks are Hiveplots.
This library uses svgwrite to programbatically create images like this one:
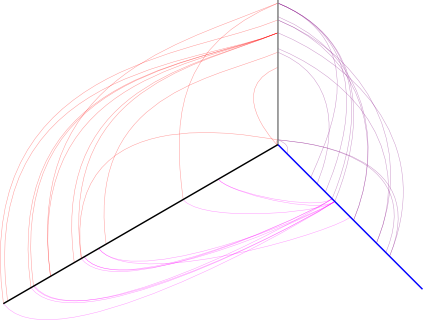
A short example
Create a plot from a network, randomly selecting whichever axis to place 50 nodes.:
from pyveplot import *
import networkx, random

# a network
g = networkx.barabasi_albert_graph(50, 2)

# our hiveplot object
h = Hiveplot( 'short_example.svg')
            # start      end
axis0 = Axis( (200,200), (200,100), stroke="grey")
axis1 = Axis( (200,200), (300,300), stroke="blue")
axis2 = Axis( (200,200), (10,310),  stroke="black")

h.axes = [ axis0, axis1, axis2 ]

# randomly distribute nodes in axes
for n in g.nodes():
    node = Node(n)
    random.choice( h.axes ).add_node( node, random.random() )

for e in g.edges():
    if (e[0] in axis0.nodes) and (e[1] in axis1.nodes):       # edges from axis0 to axis1
        h.connect(axis0, e[0], 45,
                  axis1, e[1], -45,
                  fill='none', stroke_width='0.34', stroke_opacity='0.4',
                  stroke='purple')
    elif (e[0] in axis0.nodes) and (e[1] in axis2.nodes):     # edges from axis0 to axis2
        h.connect(axis0, e[0], -45,
                  axis2, e[1], 45,
                  fill='none', stroke_width='0.34', stroke_opacity='0.4',
                  stroke='red')
    elif (e[0] in axis1.nodes) and (e[1] in axis2.nodes):     # edges from axis1 to axis2
        h.connect(axis1, e[0], 15,
                  axis2, e[1], -15,
                  fill='none', stroke_width='0.34', stroke_opacity='0.4',
                  stroke='magenta')

h.save()
The more elaborate example.py shows how to use shapes for nodes, placement of the control points and attributes of edges, and the attributes of axes.
Installation
Install library, perhaps within a virtualenv:
$ pip install pyveplot


Download files
Download the file for your platform. If you're not sure which to choose, learn more about installing packages.
Source Distribution
pyveplot-0.4.tar.gz
(3.1 kB
view details)
File details
Details for the file pyveplot-0.4.tar.gz.
File metadata
- Download URL: pyveplot-0.4.tar.gz
- Upload date:
- Size: 3.1 kB
- Tags: Source
- Uploaded using Trusted Publishing? No
File hashes
| Algorithm | Hash digest | |
|---|---|---|
| SHA256 |
179ef5fd694ff43e74947938c206a12c400115ba9645d6c8fcb3c62fe397f89c
|
|
| MD5 |
e2ceda1ddab2b8c27a3abc55fc8fff7f
|
|
| BLAKE2b-256 |
afed418e8df4749da44b765636a35746a659e3e72db7e9680378af7ea1c48a95
|


