
quickchart-python


A Python client for the quickchart.io image charts web service.
Installation
Use the quickchart library in this project, or install through pip:
pip install quickchart.io
Version 3.0.0 and later require Python 3.9 or later. If you need support for Python 3.7 or 3.8, use version 2.0.0; for earlier versions of Python, use version 1.0.1.
Usage
This library provides a QuickChart class. Import and instantiate it. Then set properties on it and specify a Chart.js config:
from quickchart import QuickChart

qc = QuickChart()
qc.width = 500
qc.height = 300
qc.config = {
    "type": "bar",
    "data": {
        "labels": ["Hello world", "Test"],
        "datasets": [{
            "label": "Foo",
            "data": [1, 2]
        }]
    }
}
Use get_url() on your quickchart object to get the encoded URL that renders your chart:
print(qc.get_url())
# https://quickchart.io/chart?c=%7B%22chart%22%3A+%7B%22type%22%3A+%22bar%22%2C+%22data%22%3A+%7B%22labels%22%3A+%5B%22Hello+world%22%2C+%22Test%22%5D%2C+%22datasets%22%3A+%5B%7B%22label%22%3A+%22Foo%22%2C+%22data%22%3A+%5B1%2C+2%5D%7D%5D%7D%7D%7D&w=600&h=300&bkg=%23ffffff&devicePixelRatio=2.0&f=png
If you have a long or complicated chart, use get_short_url() to get a fixed-length URL using the quickchart.io web service (note that these URLs only persist for a short time unless you have a subscription):
print(qc.get_short_url())
# https://quickchart.io/chart/render/f-a1d3e804-dfea-442c-88b0-9801b9808401
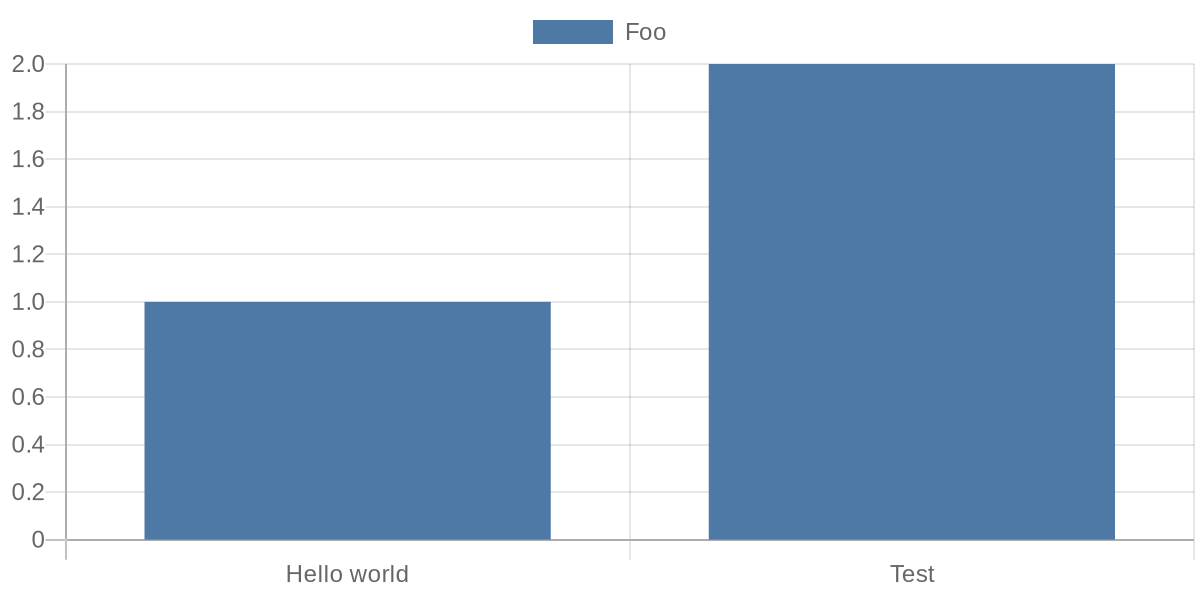
The URLs will render an image of a chart:
Using Javascript functions in your chart
Chart.js sometimes relies on Javascript functions (e.g. for formatting tick labels). There are a couple approaches:
- Build chart configuration as a string instead of a Python object. See
examples/simple_example_with_function.py. - Build chart configuration as a Python object and include a placeholder string for the Javascript function. Then, find and replace it.
- Use the provided
QuickChartFunctionclass. Seeexamples/using_quickchartfunction.pyfor a full example.
A short example using QuickChartFunction:
qc = QuickChart()
qc.config = {
    "type": "bar",
    "data": {
        "labels": ["A", "B"],
        "datasets": [{
            "label": "Foo",
            "data": [1, 2]
        }]
    },
    "options": {
        "scales": {
            "yAxes": [{
                "ticks": {
                    "callback": QuickChartFunction('(val) => val + "k"')
                }
            }],
            "xAxes": [{
                "ticks": {
                    "callback": QuickChartFunction('''function(val) {
                      return val + '???';
                    }''')
                }
            }]
        }
    }
}

print(qc.get_url())
Customizing your chart
You can set the following properties:
config: dict or str
The actual Chart.js chart configuration.
If your chart configuration is JSON-compatible, it's usually easiest to pass an object (example). If your chart configuration contains a Javascript function, you may pass it as a string (example) or use QuickChartFunction (example).
width: int
Width of the chart image in pixels. Defaults to 500
height: int
Height of the chart image in pixels. Defaults to 300
format: str
Format of the chart. Defaults to png. svg is also valid.
background_color: str
The background color of the chart. Any valid HTML color works. Defaults to #ffffff (white). Also takes rgb, rgba, and hsl values.
device_pixel_ratio: float
The device pixel ratio of the chart. This will multiply the number of pixels by the value. This is usually used for retina displays. Defaults to 1.0.
version: str
The version of Chart.js to use. Acceptable values are documented here. Usually used to select Chart.js 3+.
scheme: str
The protocol to use. Defaults to https.
host: str
Override the host of the chart render server. Defaults to quickchart.io.
key: str
Set an API key that will be included with the request.
timeout: float
Timeout in seconds for the network requests made by get_bytes(), get_short_url(), and to_file(). Defaults to 60.0. Set to None to disable the timeout.
Getting URLs
There are two ways to get a URL for your chart object.
get_url(): str
Returns a URL that will display the chart image when loaded.
get_short_url(): str
Uses the quickchart.io web service to create a fixed-length chart URL that displays the chart image. Returns a URL such as https://quickchart.io/chart/render/f-a1d3e804-dfea-442c-88b0-9801b9808401.
Note that short URLs expire after a few days for users of the free service. You can subscribe to keep them around longer.
Other functionality
get_bytes()
Returns the bytes representing the chart image.
to_file(path: str)
Writes the chart image to a file path.
More examples
Checkout the examples directory to see other usage.
Development
This project uses Poetry for packaging and dependency management.
# Install dependencies (including dev tools)
poetry install --with dev

# Run the test suite
poetry run python -m pytest tests.py

# Lint and format
poetry run ruff check .
poetry run ruff format .
The tests that hit the live quickchart.io service are skipped by default. Set QUICKCHART_NETWORK_TESTS=1 to run them:
QUICKCHART_NETWORK_TESTS=1 poetry run python -m pytest tests.py
1 maintainer

Metadata
1 maintainer
Release files for quickchart.io 3.0.0
For a detailed explanation of source distributions (sdists) and built distributions (wheels), please see the package formats documentation.
Source distribution (sdist)
| File | Size | Uploaded | |
|---|---|---|---|
| quickchart_io-3.0.0.tar.gz | 5.7 kB | Details |
Built distribution (wheel)
| File | Interpreter | ABI | Platform | Reset |
|---|---|---|---|---|
| quickchart_io-3.0.0-py3-none-any.whl | Python 3 | none | any | Details |
Total release size: 11.9 kB
Release files / quickchart_io-3.0.0.tar.gz
| Download URL | quickchart_io-3.0.0.tar.gz |
|---|---|
| Size | 5.7 kB |
| Tags | Source |
|
SHA-256 checksum How to use checksums |
e72bdf64b77d77cca1f4c7ccab60f635fd6b3f8166113ab1e936112dcbdbed8a
|
|
BLAKE2b-256 checksum How to use checksums |
78ce62dafeee4462b814e9585accef8c442bb686c9ce743a3f675d56122606d2
|
| Upload date | |
|
Uploaded using Trusted Publishing? What is trusted publishing? |
No |
| Uploaded via |
twine/6.2.0 CPython/3.13.12
|
Release files / quickchart_io-3.0.0-py3-none-any.whl
| Download URL | quickchart_io-3.0.0-py3-none-any.whl |
|---|---|
| Size | 6.2 kB |
| Tags | Python 3 |
|
SHA-256 checksum How to use checksums |
587b3fef7e2a325933606672ff582982f98092a5aa1f5dec171cb180516c440e
|
|
BLAKE2b-256 checksum How to use checksums |
81f2fbfc7b48bac39535cae3116d7558fa74a477e4de5dc989b7877b64fa52a5
|
| Upload date | |
|
Uploaded using Trusted Publishing? What is trusted publishing? |
No |
| Uploaded via |
twine/6.2.0 CPython/3.13.12
|














