
Beautiful raincloud plots for Python

Project description
raincloudpy 🌧️☁️



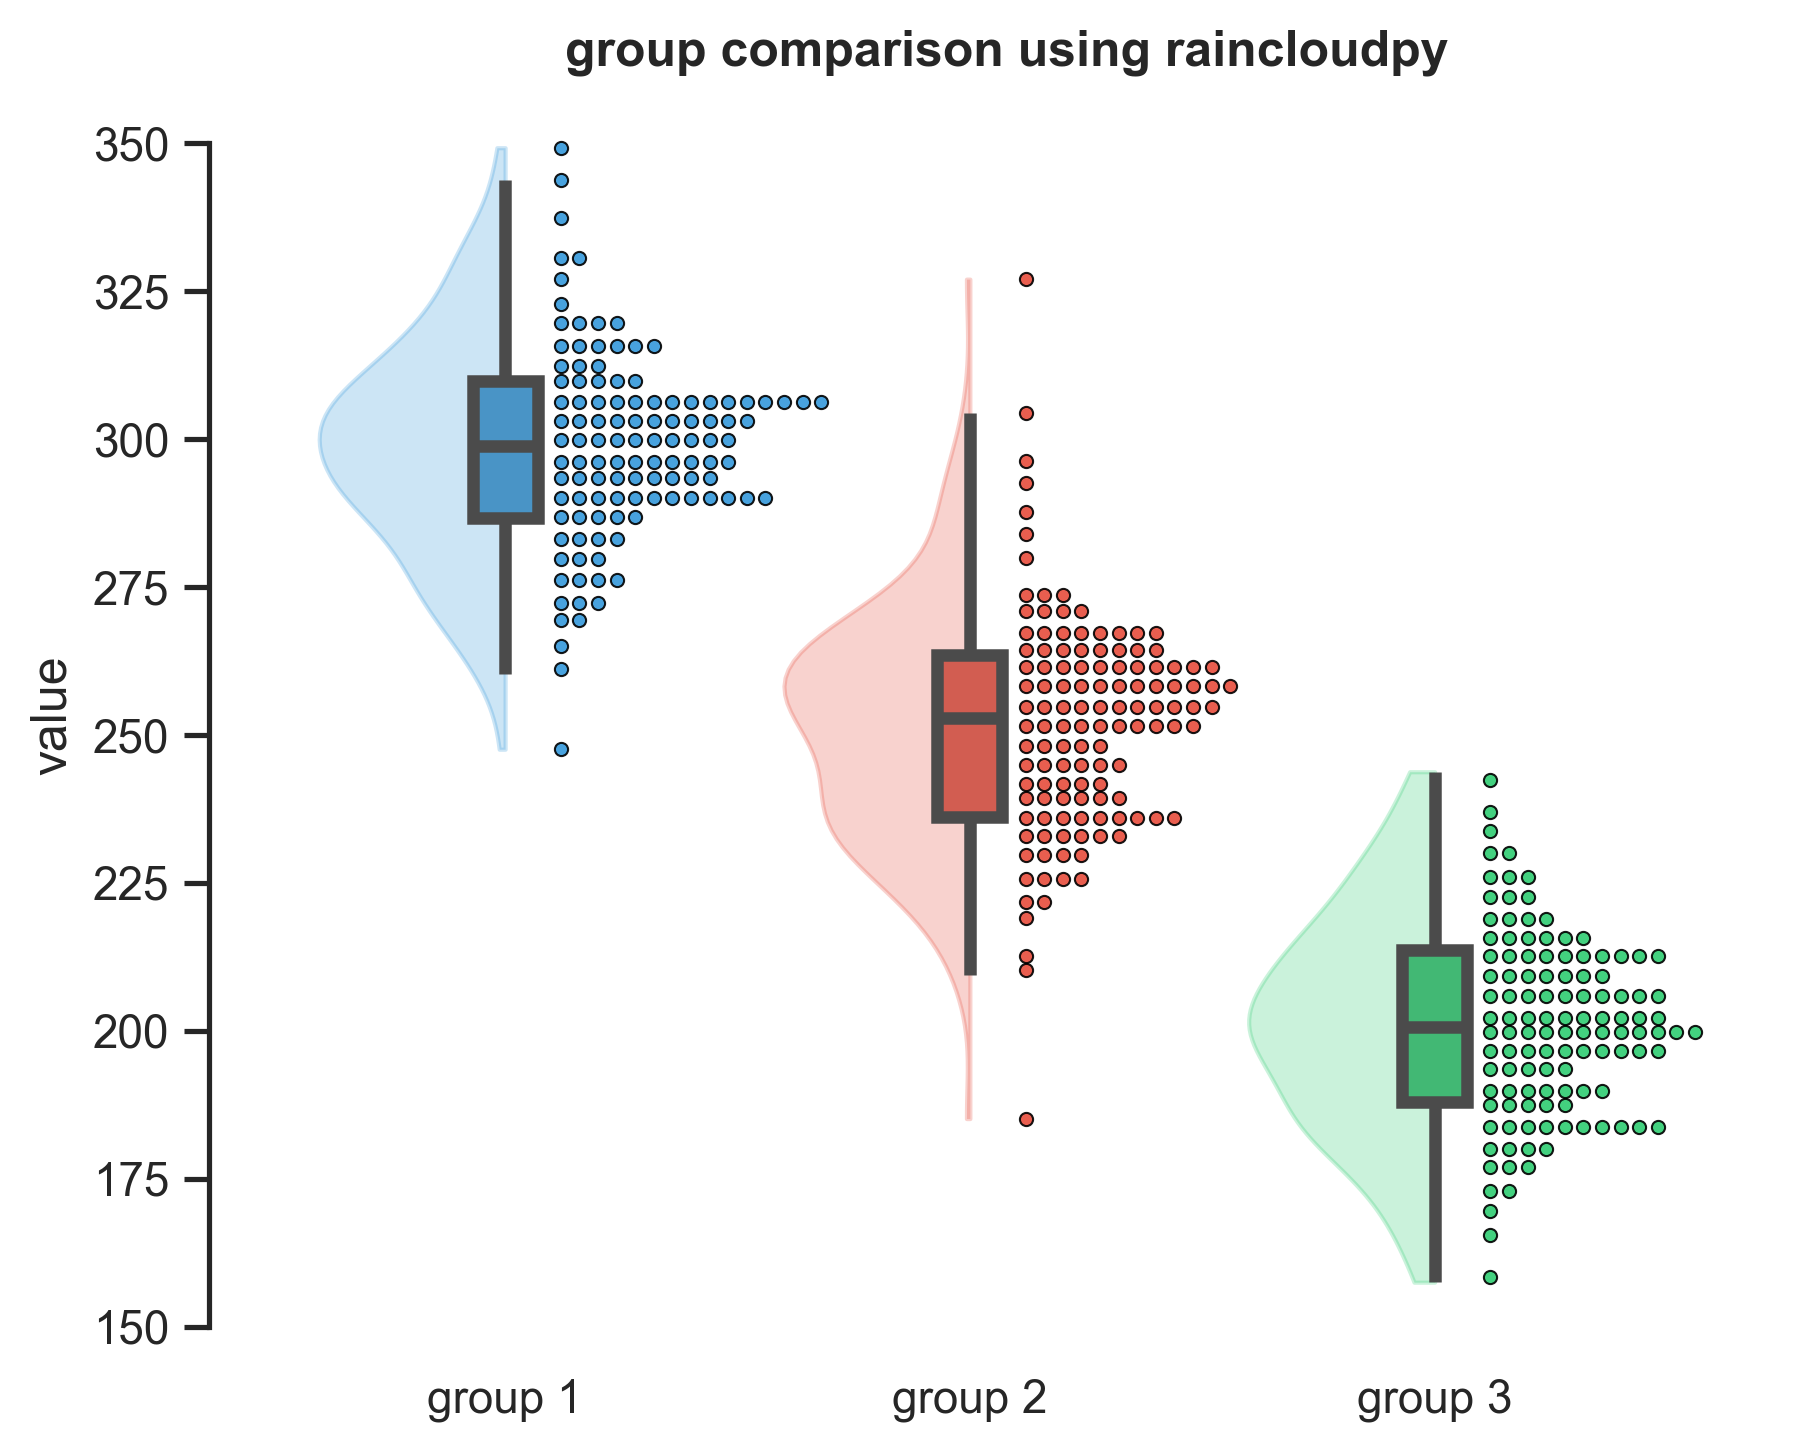
Beautiful raincloud plots for Python, combining boxplots, half-violin plots, and density-aligned scatter plots to create comprehensive and visually appealing data visualizations.
What is a Raincloud Plot?
Raincloud plots are a hybrid visualization that combines:
- 📊 Box plots - showing quartiles and outliers
- 🎻 Half-violin plots - displaying the probability density
- 🔴 Scatter plots - showing individual data points aligned by density
This creates a "rain cloud" effect that provides maximum information about your data distribution.
Example
Installation
pip install raincloudpy
Quick Start
basic
import numpy as np
import pandas as pd
import matplotlib.pyplot as plt
from raincloudpy import raincloudplot
import seaborn as sns

# Set random seed for reproducibility
np.random.seed(42)

# Create sample data
df = pd.DataFrame({
    'group': ['A'] * 50 + ['B'] * 50 + ['C'] * 50,
    'value': np.concatenate([
        np.random.randn(50) + 2,
        np.random.randn(50) + 3,
        np.random.randn(50) + 2.5
    ])
})

# Create raincloud plot
# fig, ax = plt.subplots(figsize=(10, 6))
plt.figure(figsize=(10, 6))
sns.set_context('talk')
raincloudplot(data=df, x='group', y='value', palette='Set2')
plt.title('basic raincloud plot example')
plt.ylabel('value')
plt.xlabel('group')
plt.tight_layout()
plt.show()
advanced
import numpy as np
import pandas as pd
import matplotlib.pyplot as plt

import seaborn as sns

# Set random seed for reproducibility
np.random.seed(42)

# Create sample data mimicking value comparison
N = 150
df_fit = pd.DataFrame({
    'group': ['group 1'] * N + ['group 2'] * N + ['group 3'] * N,
    'value': np.concatenate([
        np.random.normal(loc=300, scale=20, size=N),
        np.random.normal(loc=250, scale=20, size=N),
        np.random.normal(loc=200, scale=20, size=N)
    ])
})

sns.set_style("ticks")
sns.set_context("notebook")

# Create customized raincloud plot
plt.figure(figsize=(6, 5), dpi=300)
raincloudplot(
    data=df_fit,
    x='group',
    y='value',
    order=['group 1', 'group 2', 'group 3'],
    palette=['#3498db', '#e74c3c', '#2ecc71'],
    box_width=0.14,
    violin_width=0.4,
    dot_size=10,
    dot_spacing=0.04,
    y_threshold=3,
    box_kwargs={'linewidth': 3},
    scatter_kwargs={'alpha': 0.9, 'edgecolor': 'black', 'linewidth': 0.5},
    violin_kwargs={'alpha': 0.25},
)


plt.title('group comparison using raincloudpy', fontweight='bold')
plt.ylabel('value')
plt.xlabel('')
plt.tight_layout()
sns.despine(offset=10, trim=True, bottom=True)
plt.tick_params(axis='x', which='both', bottom=False, top=False)
plt.show()
Hiding Components
# Only show violin and scatter
raincloudplot(
    data=df,
    x='group',
    y='value',
    show_box=False,
    show_violin=True,
    show_scatter=True
)
Features
- 🎨 Customizable colors - Use any seaborn color palette or custom colors
- 📏 Flexible sizing - Control box width, violin width, and dot sizes
- 🎯 Density-aligned scatter - Points are intelligently positioned based on data density
- 🔧 Component control - Show/hide individual components (box, violin, scatter)
- 📊 Works with pandas - Seamless integration with pandas DataFrames
- 🎭 Matplotlib-based - Fully compatible with matplotlib customization
Parameters
| Parameter | Type | Default | Description |
|---|---|---|---|
data |
DataFrame | None | Input data (required) |
x |
str | None | Column name for categorical variable |
y |
str | None | Column name for continuous variable |
order |
list | None | Order to plot categorical levels |
palette |
str/list | None | Colors for different groups |
ax |
Axes | None | Matplotlib axes object |
box_width |
float | 0.15 | Width of boxplot boxes |
violin_width |
float | 0.3 | Maximum width of violin plot |
dot_size |
float | 7 | Size of scatter points |
dot_spacing |
float | 0.03 | Horizontal spacing between dots |
box_dots_spacing |
float | 0.05 | Gap between boxplot and scatter points |
y_threshold |
float | None | Threshold for grouping y-values (absolute); 5% when set to None |
n_bins |
int | 40 | Number of bins for density estimation |
box_kwargs |
dict | None | Additional boxplot arguments |
violin_kwargs |
dict | None | Additional violin plot arguments |
scatter_kwargs |
dict | None | Additional scatter plot arguments |
show_box |
bool | True | Whether to show boxplot |
show_violin |
bool | True | Whether to show violin plot |
show_scatter |
bool | True | Whether to show scatter plot |
orient |
str | 'v' | Plot orientation ('v' or 'h') |
Requirements
- Python >= 3.7
- numpy >= 1.19.0
- matplotlib >= 3.3.0
- scipy >= 1.5.0
- pandas >= 1.1.0
- seaborn >= 0.11.0
Contributing
Contributions are welcome! Please feel free to submit a Pull Request.
License
This project is licensed under the MIT License - see the LICENSE file for details.
Citation
If you use this package in your research, please cite:
@software{raincloudpy2025,
  author = {Basile Garcia},
  title = {raincloudpy: Beautiful raincloud plots for Python},
  year = {2025},
  url = {https://github.com/bsgarcia/raincloudpy}
}
Acknowledgments
Inspired by the original raincloud plots concept and various implementations in R and Python.
References
- Allen, M., Poggiali, D., Whitaker, K., Marshall, T. R., & Kievit, R. A. (2019). Raincloud plots: a multi-platform tool for robust data visualization. Wellcome Open Research, 4.
Release history Release notifications | RSS feed


Download files
Download the file for your platform. If you're not sure which to choose, learn more about installing packages.
Source Distribution
Built Distribution
Filter files by name, interpreter, ABI, and platform.
If you're not sure about the file name format, learn more about wheel file names.
Copy a direct link to the current filters
File details
Details for the file raincloudpy-0.4.3.tar.gz.
File metadata
- Download URL: raincloudpy-0.4.3.tar.gz
- Upload date:
- Size: 354.9 kB
- Tags: Source
- Uploaded using Trusted Publishing? No
- Uploaded via: twine/6.2.0 CPython/3.9.12
File hashes
| Algorithm | Hash digest | |
|---|---|---|
| SHA256 |
835411bf88a2eaa7f194cfd648ef68903043fbe7b918790d7a90e9a2450695a2
|
|
| MD5 |
cc9750ee2c3ee14820c939f03f70649f
|
|
| BLAKE2b-256 |
1805552481dd68833d56ba86667f238f091939e78e6c10de567b9d11e82413d6
|
File details
Details for the file raincloudpy-0.4.3-py3-none-any.whl.
File metadata
- Download URL: raincloudpy-0.4.3-py3-none-any.whl
- Upload date:
- Size: 9.5 kB
- Tags: Python 3
- Uploaded using Trusted Publishing? No
- Uploaded via: twine/6.2.0 CPython/3.9.12
File hashes
| Algorithm | Hash digest | |
|---|---|---|
| SHA256 |
462cdf0efc7f442d6e8b7a62e7e37551cc9cc7319afb5b5a38e3cdd8565b7750
|
|
| MD5 |
79800384bca85acda74c1bba2d25de65
|
|
| BLAKE2b-256 |
ec9e23fe3b95fc89b4f3d90b7216b2a4390c69ae8df33cd3c78e953c1ac0be7c
|






