Summarize geospatial raster datasets based on vector geometries

Project description

rasterstats is a Python module for summarizing geospatial raster datasets based on vector geometries. It includes functions for zonal statistics and interpolated point queries. The command-line interface allows for easy interoperability with other GeoJSON tools.
Documentation
For details on installation and usage, visit the documentation at http://pythonhosted.org/rasterstats.
What does it do?
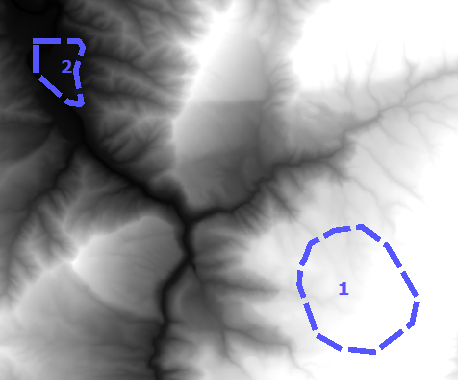
Given a vector layer and a raster band, calculate the summary statistics of each vector geometry. For example, with a polygon vector layer and a digital elevation model (DEM) raster, compute the mean elevation of each polygon.
Command Line Quick Start
The command line interfaces to zonalstats and point_query are rio subcommands which read and write geojson features
$ fio cat polygon.shp | rio zonalstats -r elevation.tif

$ fio cat points.shp | rio pointquery -r elevation.tif
See the CLI Docs. for more detail.
Python Quick Start
For zonal statistics
>>> from rasterstats import zonal_stats
>>> stats = zonal_stats("tests/data/polygons.shp", "tests/data/slope.tif")
>>> stats[0].keys()
dict_keys(['min', 'max', 'mean', 'count'])
>>> [f['mean'] for f in stats]
[14.660084635416666, 56.60576171875]
and for point queries
>>> from rasterstats import point_query
>>> point = {'type': 'Point', 'coordinates': (245309.0, 1000064.0)}
>>> point_query(point, "tests/data/slope.tif")
[74.09817594635244]
Issues
Find a bug? Report it via github issues by providing
a link to download the smallest possible raster and vector dataset necessary to reproduce the error
python code or command to reproduce the error
information on your environment: versions of python, gdal and numpy and system memory
Release history Release notifications | RSS feed


Download files
Download the file for your platform. If you're not sure which to choose, learn more about installing packages.
Source Distribution
Built Distribution
Filter files by name, interpreter, ABI, and platform.
If you're not sure about the file name format, learn more about wheel file names.
Copy a direct link to the current filters
File details
Details for the file rasterstats-0.21.0.tar.gz.
File metadata
- Download URL: rasterstats-0.21.0.tar.gz
- Upload date:
- Size: 76.8 kB
- Tags: Source
- Uploaded using Trusted Publishing? No
- Uploaded via: twine/6.2.0 CPython/3.14.5
File hashes
| Algorithm | Hash digest | |
|---|---|---|
| SHA256 |
2b955f6775b7f641c8094d00bc4381492184ba162b5dba1baa69df8db98efa5f
|
|
| MD5 |
850f13eb73f02ef3b6030565e86189db
|
|
| BLAKE2b-256 |
3e5d52d2c6985c6ff3cefdd31876bd3e6e8ac09a5fc6d52703ed4dfa3b228062
|
File details
Details for the file rasterstats-0.21.0-py3-none-any.whl.
File metadata
- Download URL: rasterstats-0.21.0-py3-none-any.whl
- Upload date:
- Size: 19.1 kB
- Tags: Python 3
- Uploaded using Trusted Publishing? No
- Uploaded via: twine/6.2.0 CPython/3.14.5
File hashes
| Algorithm | Hash digest | |
|---|---|---|
| SHA256 |
6157d8bd1cc2fe3b3714abfa53b6a18c299efa7f70e8d9af71d3ef0408ac5c5d
|
|
| MD5 |
2dd17c2705dbf19a311b4d45f45af3e2
|
|
| BLAKE2b-256 |
052e7c85f00260aa332fbab9caba209290a07be645ee1d5691415ae635a7382a
|


