
Lightweight HTTP request/response logger and debugger for Python web frameworks

Project description

reqtrace-py
Lightweight HTTP request/response logger for Python web frameworks. Designed for developers who need clear, structured debug output without writing print() everywhere.
Features
- Auto-log every request & response via middleware
- Colorized terminal output with status color coding
- File output in JSON (NDJSON) or plain text format
- Configurable output mode: terminal, file, or both
- Auto-diff mode — detects response changes per endpoint automatically
- Filter log by route, method, or status code (whitelist & blacklist)
- Press
cto clear terminal while server is running - Authorization header auto-masking
- Web UI log viewer via CLI (
reqtrace view)
Installation
pip install reqtrace-py
The package is installed as
reqtrace-pybut imported asreqtrace.
Quickstart
from fastapi import FastAPI
from reqtrace import ReqTrace
from reqtrace.middleware import ReqTraceMiddleware

rt = ReqTrace(output="terminal")

app = FastAPI()
app.add_middleware(ReqTraceMiddleware, config=rt.config)
That's it — every request will be logged automatically.
Output Modes
# Terminal only (default)
rt = ReqTrace(output="terminal")

# File only — JSON format
rt = ReqTrace(output="file", file_path="logs/trace.json")

# File only — plain text
rt = ReqTrace(output="file", file_path="logs/trace.txt", file_format="txt")

# Both terminal and file
rt = ReqTrace(output="both", file_path="logs/trace.json")

# Disabled (useful for production)
rt = ReqTrace(output="terminal", enabled=False)
Web UI Viewer
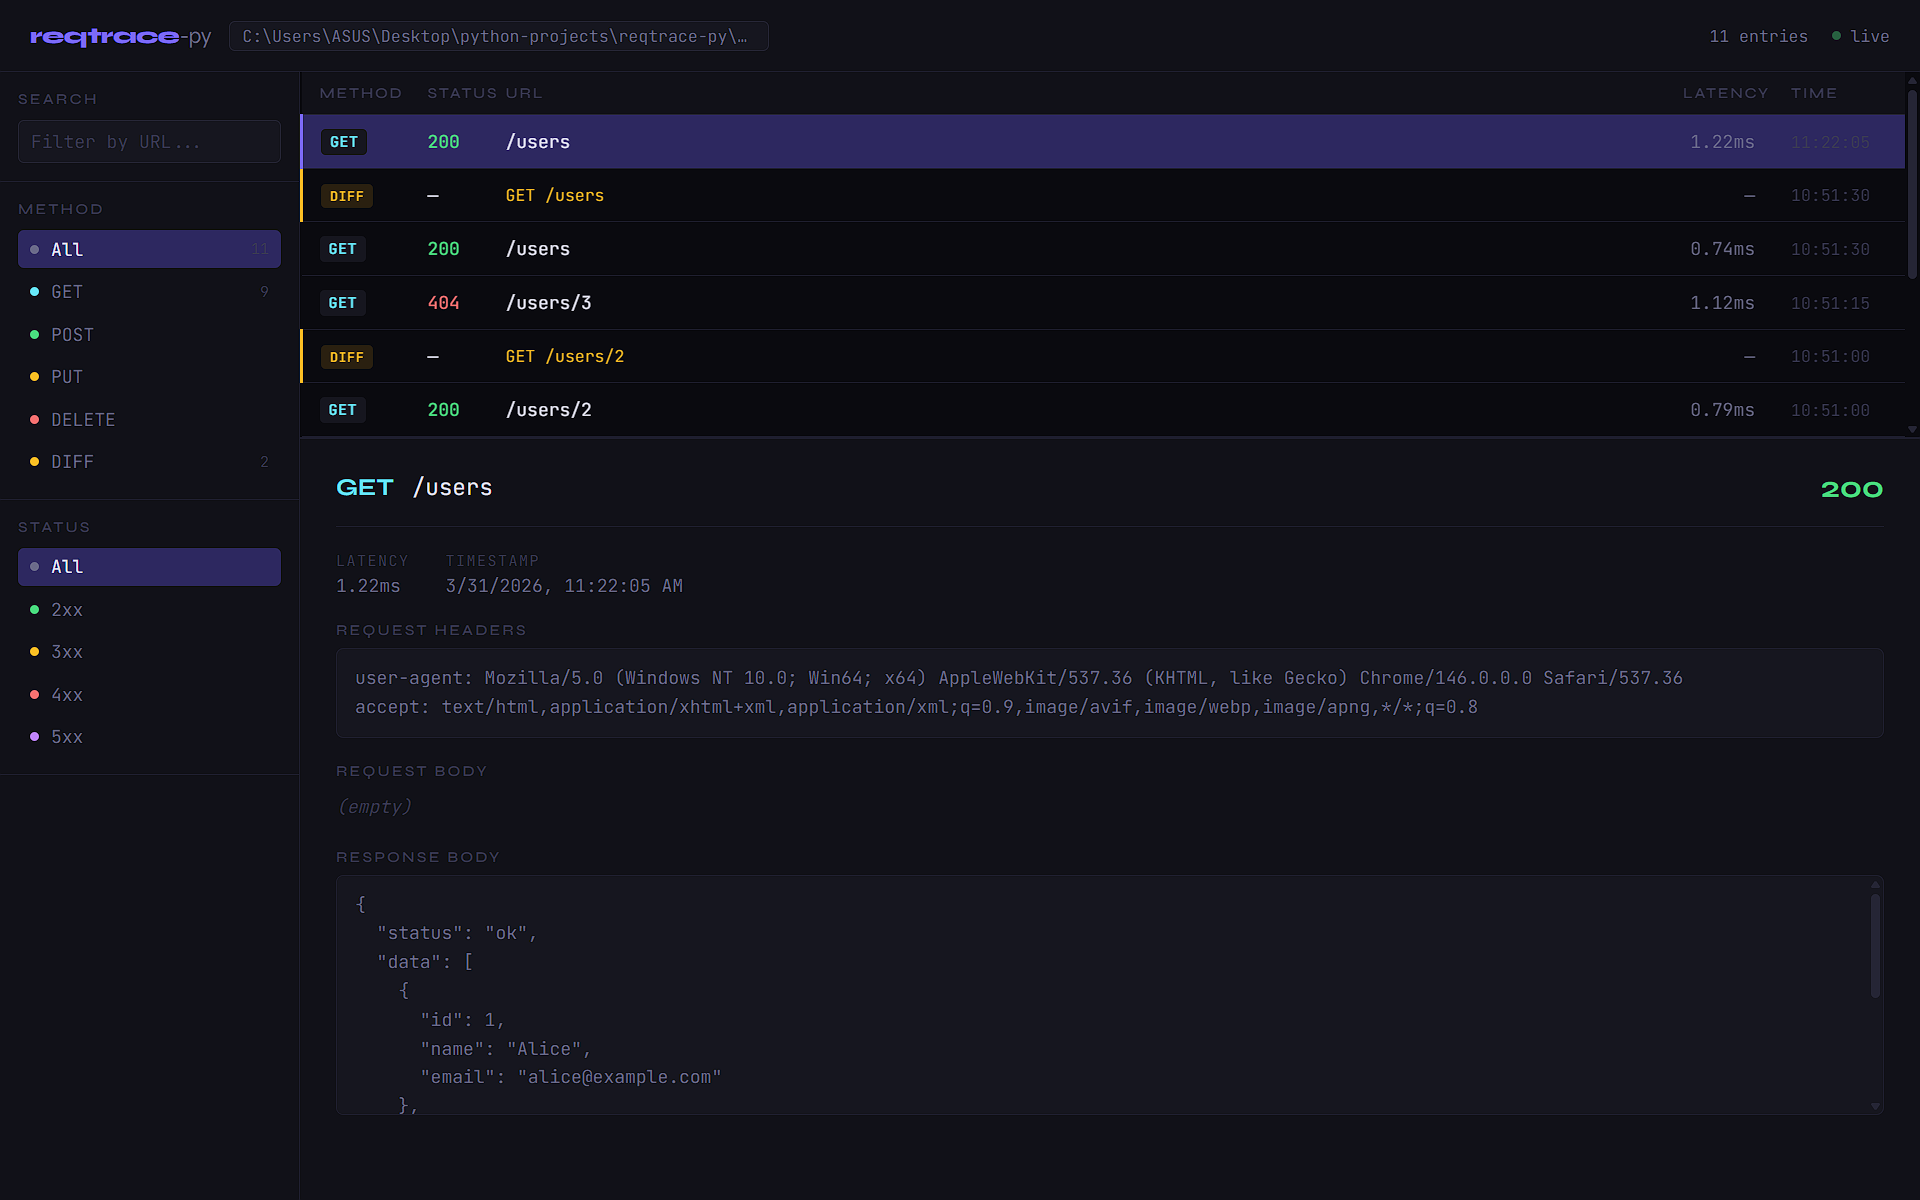
Visualize your log file in a browser-based UI with real-time updates, filtering, search, and diff viewer.
First, configure reqtrace to write to a file:
rt = ReqTrace(output="file", file_path="logs/trace.json")
# or both terminal and file
rt = ReqTrace(output="both", file_path="logs/trace.json", diff=True)
Then open the viewer from your terminal:
reqtrace view logs/trace.json
The UI will open automatically at http://localhost:8765.
# Custom port
reqtrace view logs/trace.json --port 8080

# Don't open browser automatically
reqtrace view logs/trace.json --no-browser
UI features:
- Table view of all log entries, sorted newest first
- Click any row to inspect full request/response detail
- Resizable detail panel — drag the handle between table and detail
- Filter by method (GET, POST, PUT, DELETE, DIFF) and status code (2xx–5xx)
- Search by URL
- Diff viewer — shows added, removed, and changed fields
- Live updates via SSE — new entries appear automatically without refresh
Filter
Control which requests are logged using whitelist or blacklist mode.
from reqtrace import ReqTrace, ReqTraceFilter

# Whitelist — only log errors
rt = ReqTrace(
    output="terminal",
    filters=ReqTraceFilter(
        mode="whitelist",
        status_codes=["4xx", "5xx"],
    )
)

# Whitelist — only log specific methods
rt = ReqTrace(
    output="terminal",
    filters=ReqTraceFilter(
        mode="whitelist",
        methods=["POST", "PUT", "DELETE"],
    )
)

# Blacklist — hide docs routes and all 200 responses
rt = ReqTrace(
    output="terminal",
    filters=ReqTraceFilter(
        mode="blacklist",
        routes=["/docs", "/redoc", "/openapi.json"],
        status_codes=[200],
    )
)
Filter rules:
- whitelist — only log requests that match the filter. Empty whitelist logs nothing.
- blacklist — log everything except requests that match the filter. Empty blacklist logs everything.
- Filters can be combined:
routes,methods, andstatus_codesare evaluated with OR logic. status_codesaccepts specific codes (404) or ranges ("4xx","5xx"), or mixed ([404, "5xx"]).
Auto-Diff
Enable auto-diff to automatically compare each response against the previous one for the same endpoint. Useful for detecting unintended changes after modifying your code.
rt = ReqTrace(output="terminal", diff=True)

# With file output
rt = ReqTrace(output="both", file_path="logs/trace.json", diff=True)
On the first request to an endpoint, reqtrace saves a snapshot. On every subsequent request to the same endpoint, it compares and displays what changed:
┌─ DIFF GET /users ────────────────────────────────────────────
  +1  -0  ~0
  + data[2]     {'id': 3, 'name': 'Diz', 'email': 'diz@example.com'}
└──────────────────────────────────────────────────────────────
Diff symbols:
+— field or item added-— field or item removed~— value or type changed
Terminal Output Example
┌─ REQUEST ────────────────────────────────────────────────────
  POST    /api/users
  content-type: application/json
  Body:
    {
      "name": "Diz",
      "email": "diz@mail.com"
    }
├─ RESPONSE ───────────────────────────────────────────────────
  Status :  422  43.2ms
  Body:
    {
      "detail": [{"loc": ["body", "email"], "msg": "value is not a valid email"}]
    }
└──────────────────────────────────────────────────────────────
Status codes are color-coded:
- 🟢
2xx— green - 🟡
3xx— yellow - 🔴
4xx— red - 🟣
5xx— magenta
Clear Terminal
While the server is running, press c to clear the terminal output. The key can be customized or disabled:
# Custom key
rt = ReqTrace(output="terminal", clear_key="r")

# Disable
rt = ReqTrace(output="terminal", clear_key=None)
JSON Log Format
Each log entry is one JSON object per line (NDJSON), easy to stream and parse:
{"timestamp": "2026-03-23T10:15:00+00:00", "method": "POST", "url": "/api/users", "status_code": 422, "latency_ms": 43.2, "request_headers": {...}, "request_body": {"name": "Diz"}, "response_body": {...}}
Diff entries are written as a separate record with "type": "diff":
{"timestamp": "2026-03-23T10:16:00+00:00", "type": "diff", "method": "GET", "url": "/users", "changes": {"added": [{"path": "data[2]", "value": {...}}], "removed": [], "changed": []}, "has_changes": true}
Configuration Reference
| Parameter | Type | Default | Description |
|---|---|---|---|
output |
"terminal" | "file" | "both" |
"terminal" |
Where to send log output |
file_path |
str |
None |
Log file path. Required if output is "file" or "both" |
file_format |
"json" | "txt" |
"json" |
Log file format |
enabled |
bool |
True |
Master on/off switch |
diff |
bool |
False |
Enable auto-diff per endpoint |
clear_key |
str | None |
"c" |
Terminal clear shortcut. None to disable |
filters |
ReqTraceFilter | None |
None |
Filter which requests are logged |
ReqTraceFilter Reference
| Parameter | Type | Default | Description |
|---|---|---|---|
mode |
"whitelist" | "blacklist" |
"blacklist" |
Filter mode |
routes |
list[str] |
[] |
Routes to filter. Supports exact and prefix match |
methods |
list[str] |
[] |
HTTP methods to filter. Case-insensitive |
status_codes |
list[int | str] |
[] |
Status codes to filter. Accepts 404 or "4xx" |
Requirements
- Python >= 3.10
- Starlette >= 0.27.0
Changelog
v0.4.0
- Web UI log viewer via
reqtrace view <file>CLI command - Table layout with resizable detail panel
- Real-time updates via SSE — new entries appear without refresh
- Filter by method, status code, and URL search in the UI
- Diff viewer in detail panel
- Log entries sorted newest first
v0.3.0
- Filter log by route, method, and status code
- Whitelist and blacklist mode
status_codessupports specific codes and ranges ("4xx","5xx")
v0.2.0
- Auto-diff mode (
diff=True) — compares responses per endpoint automatically - Diff output in both terminal and file
- Press
cto clear terminal (configurable viaclear_key) - Fix:
CTRL+Cnow works correctly whenclear_keyis active
v0.1.0
- Initial release
- Request/response logging via middleware
- Terminal (colorized) and file (JSON/txt) output
Roadmap
v0.5.0— Flask/Django support
License
MIT
Release history Release notifications | RSS feed


Download files
Download the file for your platform. If you're not sure which to choose, learn more about installing packages.
Source Distribution
Built Distribution
Filter files by name, interpreter, ABI, and platform.
If you're not sure about the file name format, learn more about wheel file names.
Copy a direct link to the current filters
File details
Details for the file reqtrace_py-0.4.0.tar.gz.
File metadata
- Download URL: reqtrace_py-0.4.0.tar.gz
- Upload date:
- Size: 495.4 kB
- Tags: Source
- Uploaded using Trusted Publishing? No
- Uploaded via: twine/6.2.0 CPython/3.13.12
File hashes
| Algorithm | Hash digest | |
|---|---|---|
| SHA256 |
d809810e250a96e4727b12019bb1090a07a6b4b9234b7c30628423e5284e301f
|
|
| MD5 |
362064d14df0a74aa991d2fc3028d447
|
|
| BLAKE2b-256 |
5874df232531170fd3a1db26fbddd8734c84dc84d6126c25fb1a2c0d31925ccc
|
File details
Details for the file reqtrace_py-0.4.0-py3-none-any.whl.
File metadata
- Download URL: reqtrace_py-0.4.0-py3-none-any.whl
- Upload date:
- Size: 25.2 kB
- Tags: Python 3
- Uploaded using Trusted Publishing? No
- Uploaded via: twine/6.2.0 CPython/3.13.12
File hashes
| Algorithm | Hash digest | |
|---|---|---|
| SHA256 |
e295d4996ce3b24600db067139cc56ba2e174f78a86008358440388c6d3b6743
|
|
| MD5 |
2a20b7395be38ea9fc9613f51ec88f03
|
|
| BLAKE2b-256 |
e1b618867eb13cad288593d81a0d048d47ac25e828603c97b21eb6f5fab55caf
|






