Lightweight Python package for monitoring process and system resource usage with optional Metaflow integration for cloud cost optimization.
Project description
resource-tracker
A lightweight, zero-dependency Python package for monitoring resource usage across processes and at the server level. Designed with batch jobs in mind (like Metaflow steps), it provides simple tools to track CPU, memory, GPU, network, and disk utilization with minimal setup -- e.g. using a step decorator in Metaflow to automatically track resource usage and generate a card with data visualizations on historical resource usage and cloud server recommendations for future runs.
Installation
You can install the stable version of the package from PyPI:
pip install resource-tracker
Development version can be installed directly from the repository:
pip install git+https://github.com/sparecores/resource-tracker.git
Note that depending on your operating system, you might need to also install psutil (e.g. on MacOS and Windows).
Operating System Support
The package was originally created to work on Linux systems (as the most
commonly used operating system on cloud servers) using procfs directly and
without requiring any further Python dependencies, but to support other
operating systems as well, now it can also use psutil when available.
To make sure the resource tracker works on non-Linux systems, install via:
pip install resource-tracker[psutil]
Minor inconsistencies between operating systems are expected, e.g. using PSS (Proportional Set Size) instead of RSS (Resident Set Size) as the process-level memory usage metric on Linux, as it is evenly divides the shared memory usage between the processes using it, making it more representative of the memory usage of the monitored applications. Mac OS X and Windows use USS (Unique Set Size) instead.
CI/CD is set up to run tests on the below operating systems:
- Ubuntu latest LTS (24.04)
- MacOS latest (13)
- Windows latest (Windows Server 2022)

Python Version Support
The package supports Python 3.9 and above.
CI/CD is set up to run tests on the below Python versions on Ubuntu latest LTS, Windows Server 2022 and MacOS latest:
- 3.9
- 3.10
- 3.11
- 3.12
- 3.13
Performance
The performance of the procfs and the psutil implementations is similar, see
e.g.
benchmark.py
for a comparison of the two implementations when looking at process-level stats:
PSUtil implementation: 0.082130s avg (min: 0.067612s, max: 0.114606s)
ProcFS implementation: 0.084533s avg (min: 0.081533s, max: 0.111782s)
Speedup factor: 0.97x (psutil faster)
On a heavy application with many descendants (such as Google Chrome with hundreds of processes and open tabs):
PSUtil implementation: 0.201849s avg (min: 0.193392s, max: 0.214061s)
ProcFS implementation: 0.182557s avg (min: 0.174610s, max: 0.192760s)
Speedup factor: 1.11x (procfs faster)
The server-level stats are much cheaper to collect, and there is no effective difference in performance between the two implementations.
Why have both implementations then? The psutil implementation works on all
operating systems at the cost of the extra dependency, while the procfs
implementation works without any additional dependencies, but only on Linux.
This latter can be useful when deploying cloud applications in limited
environments without easy control over the dependencies (e.g. Metaflow step
decorator without explicit @pypi config).
Standalone Usage
The package comes with helper functions and classes for tracking resource usage,
such as PidTracker and SystemTracker, both using either procfs or psutil
under the hood, depending on which is available, with a preference for psutil
when both are present.
from resource_tracker import SystemTracker
tracker = SystemTracker()
SystemTracker tracks system-wide resource usage, including CPU, memory, GPU, network
traffic, disk I/O and space usage every 1 second, and write CSV to the standard
output stream by default. Example output:
"timestamp","processes","utime","stime","cpu_usage","memory_free","memory_used","memory_buffers","memory_cached","memory_active","memory_inactive","disk_read_bytes","disk_write_bytes","disk_space_total_gb","disk_space_used_gb","disk_space_free_gb","net_recv_bytes","net_sent_bytes","gpu_usage","gpu_vram","gpu_utilized"
1741785685.6762981,1147955,40,31,0.7098,37828072,26322980,16,1400724,13080320,1009284,86016,401408,5635.25,3405.81,2229.44,10382,13140,0.24,1034.0,1
1741785686.676473,1147984,23,49,0.7199,37836696,26316404,16,1398676,13071060,1009284,86016,7000064,5635.25,3405.81,2229.44,1369,1824,0.15,1033.0,1
1741785687.6766264,1148012,38,34,0.7199,37850036,26301016,16,1400724,13043036,1009284,40960,49152,5635.25,3405.81,2229.44,10602,9682,0.26,1029.0,1
The default stream can be redirected to a file by passing a path to the csv_file_path
argument, and can use different intervals for sampling via the interval
argument.
The PidTracker class tracks resource usage of a running process and optionally
all its children (recursively), in a similar manner, although somewhat limited in
functionality, as e.g. nvidia-smi pmon can only track up-to 4 GPUs, and
network traffic monitoring is not available.
Helper functions are also provided, e.g. get_pid_stats and get_system_stats
from both the tracker_procfs and tracker_psutil modules, which are used
internally by the above classes after diffing values between subsequent calls.
See more details in the API References.
Discovery Helpers
The packages also comes with helpers for discovering the cloud environment and basic server hardware specs. Quick example on an AWS EC2 instance:
from resource_tracker import get_cloud_info, get_server_info
get_cloud_info()
# {'vendor': 'aws', 'instance_type': 'g4dn.xlarge', 'region': 'us-west-2', 'discovery_time': 0.1330404281616211}
get_server_info()
# {'vcpus': 4, 'memory_mb': 15788.21, 'gpu_count': 1, 'gpu_names': ['Tesla T4'], 'gpu_memory_mb': 15360.0}
Spare Cores integration can do further lookups for the current server type, e.g. to calculate the cost of running the current job and recommend cheaper cloud server types for future runs.
Metaflow Integration
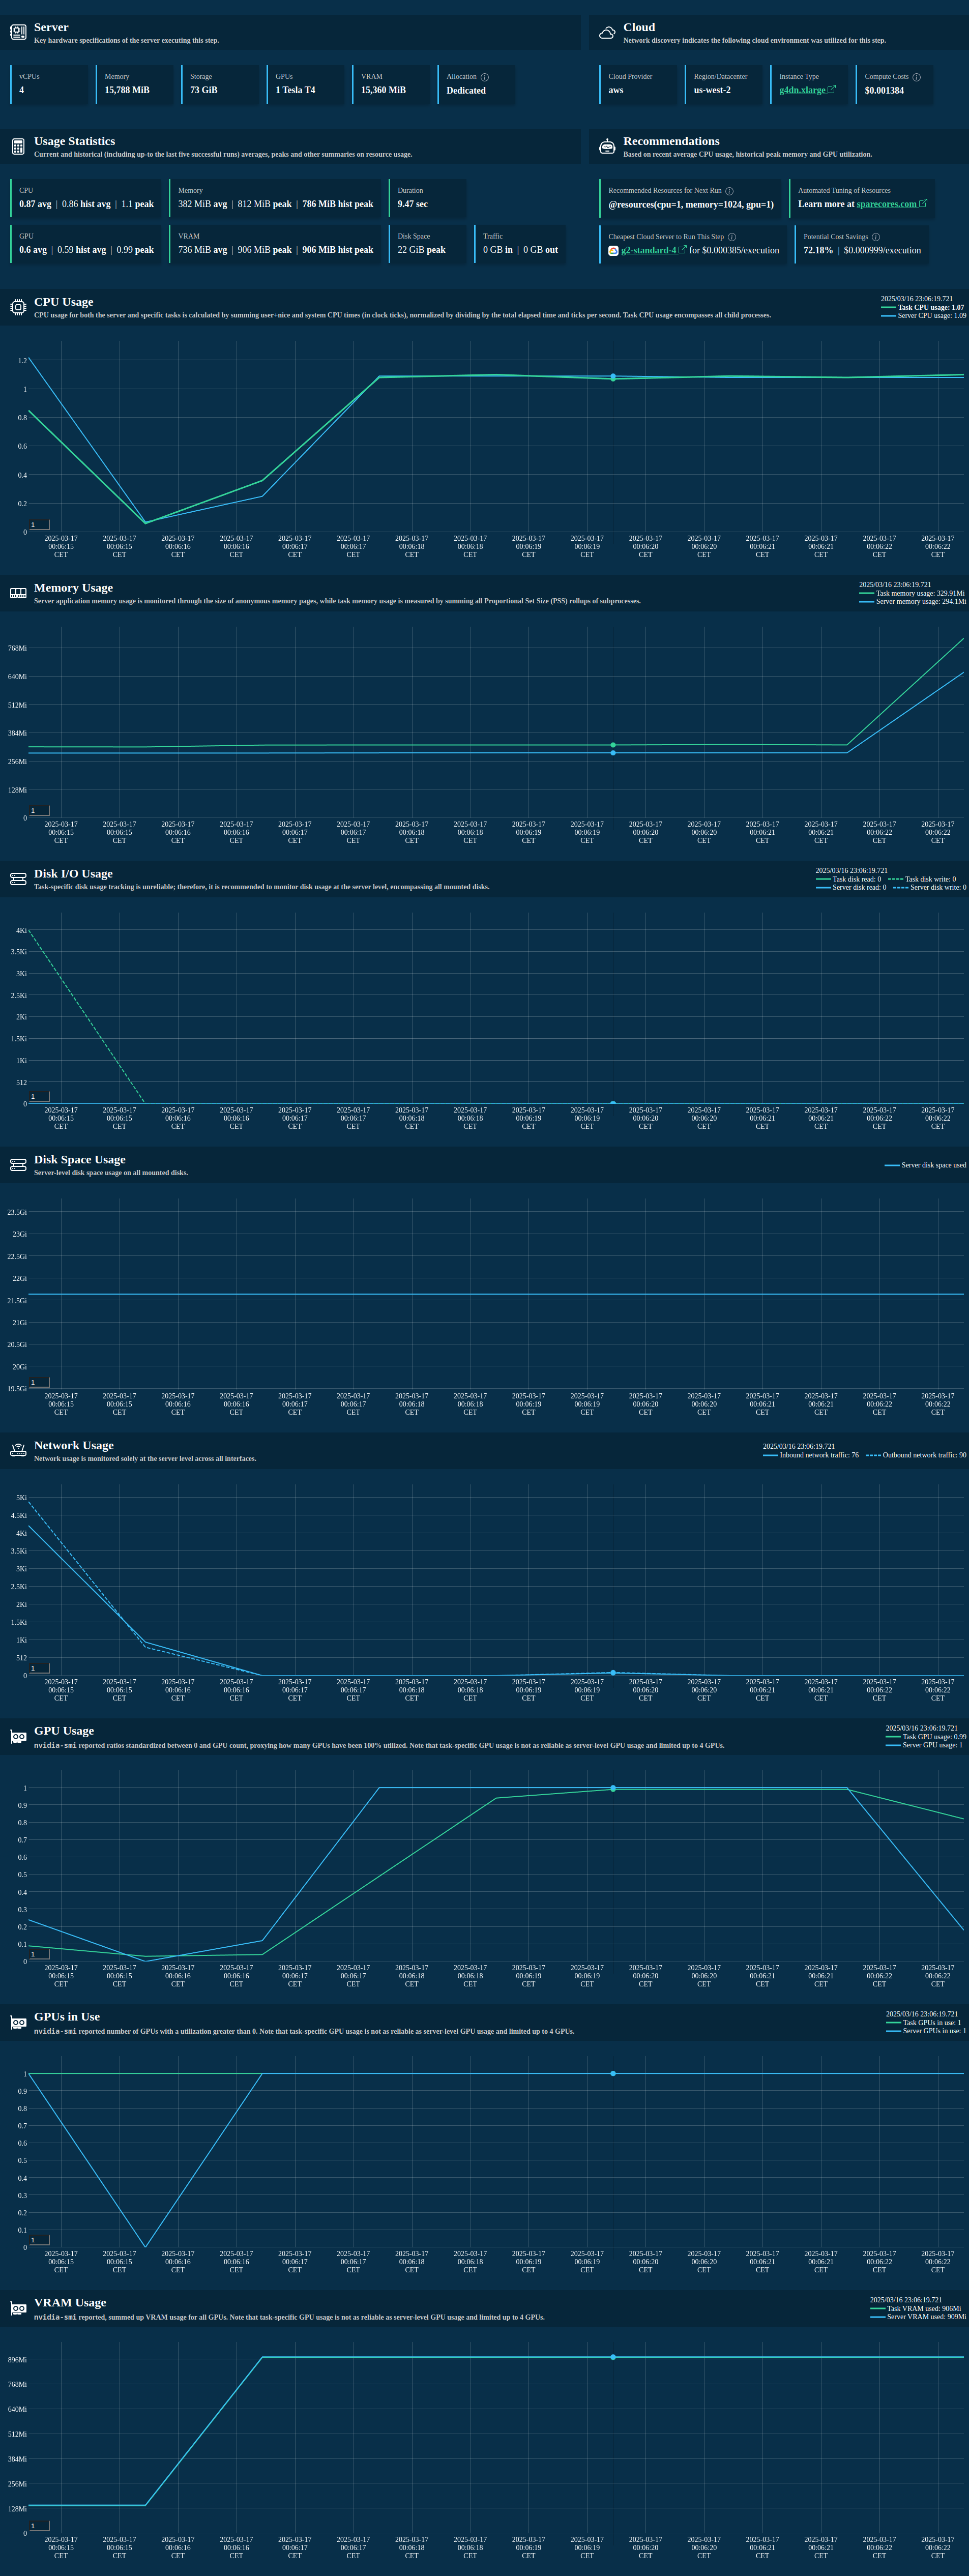
The package also comes with a Metaflow extension for tracking resource usage of
Metaflow steps, including the visualization of the collected data in a card with
recommended @resources and cheapest cloud server type for future runs, along
with basic cost estimates.
To get started, import the track_resources decorator from metaflow and use
it to decorate your Metaflow steps:
from metaflow import Flow, FlowSpec, step, track_resources

class ResourceTrackingFlow(FlowSpec):
    @step
    def start(self):
        print("Starting step")
        self.next(self.my_sleeping_data)

    @track_resources
    @step
    def my_sleeping_data(self):
        data = bytearray(500 * 1024 * 1024)  # 500MB
        sleep(3)
        self.next(self.end)

    @step
    def end(self):
        print("Step finished")
        pass

if __name__ == "__main__":
    ResourceTrackingFlow()
Note that if you are using --environment=pypi or other means of custom package management on a non-Linux system, you might need to install psutil there.
Example output of an auto-generated Metaflow card:
Example data collected and then stored as an artifact of the step:
from metaflow import Flow
from rich import print as pp

artifact = Flow("ResourceTrackingFlow").latest_run.data.resource_tracker_data
pp(artifact)
# {
#     'pid_tracker': TinyDataFrame with 9 rows and 12 columns. First row as a dict: {'timestamp': 1741732803.3076203, 'pid':
# 777691.0, 'children': 3.0, 'utime': 95.0, 'stime': 13.0, 'cpu_usage': 1.0796, 'pss': 563273.0, 'read_bytes': 52260.0,
# 'write_bytes': 0.0, 'gpu_usage': 0.0, 'gpu_vram': 0.0, 'gpu_utilized': 0.0},
#     'system_tracker': TinyDataFrame with 9 rows and 21 columns. First row as a dict: {'timestamp': 1741732803.2471318,
# 'processes': 777773.0, 'utime': 225.0, 'stime': 53.0, 'cpu_usage': 2.7797, 'memory_free': 38480700.0, 'memory_used':
# 24338580.0, 'memory_buffers': 4792.0, 'memory_cached': 2727720.0, 'memory_active': 15931396.0, 'memory_inactive':
# 0.0, 'disk_read_bytes': 380928.0, 'disk_write_bytes': 10088448.0, 'disk_space_total_gb': 5635.25, 'disk_space_used_gb':
# 3405.11, 'disk_space_free_gb': 2230.14, 'net_recv_bytes': 8066.0, 'net_sent_bytes': 8593.0, 'gpu_usage': 0.29, 'gpu_vram':
# 998.0, 'gpu_utilized': 1.0},
#     'cloud_info': {
#         'vendor': 'unknown',
#         'instance_type': 'unknown',
#         'region': 'unknown',
#         'discovery_time': 1.0617177486419678
#     },
#     'server_info': {
#         'vcpus': 12,
#         'memory_mb': 64015.42,
#         'gpu_count': 1,
#         'gpu_names': ['Quadro T1000'],
#         'gpu_memory_mb': 4096.0
#     },
#     'stats': {
#         'cpu_usage': {'mean': 1.42, 'max': 6.11},
#         'memory_usage': {'mean': 342509.0, 'max': 591621.0},
#         'gpu_usage': {'mean': 0.0, 'max': 0.0},
#         'gpu_vram': {'mean': 0.0, 'max': 0.0},
#         'gpu_utilized': {'mean': 0.0, 'max': 0.0},
#         'disk_usage': {'max': 3405.11},
#         'traffic': {'inbound': 77383.0, 'outbound': 58481.0},
#         'duration': 9.89
#     },
#     'historical_stats': {
#         'available': True,
#         'runs_analyzed': 5,
#         'avg_cpu_mean': 1.52,
#         'max_memory_max': 597372.0,
#         'avg_gpu_mean': 0.0,
#         'max_vram_max': 0.0,
#         'max_gpu_count': 0.0,
#         'avg_duration': 10.2
#     }
# }
Find more examples in the examples directory, including multiple Metaflow flows with different resource usage patterns, e.g. GPU jobs as well.
References
- PyPI: https://pypi.org/project/resource-tracker
- Documentation: https://sparecores.github.io/resource-tracker
- Source code: https://github.com/SpareCores/resource-tracker
- Project roadmap and feedback form: https://sparecores.com/feedback/metaflow-resource-tracker
Project details
Release history Release notifications | RSS feed


Download files
Download the file for your platform. If you're not sure which to choose, learn more about installing packages.
Source Distribution
Built Distribution
Filter files by name, interpreter, ABI, and platform.
If you're not sure about the file name format, learn more about wheel file names.
Copy a direct link to the current filters
File details
Details for the file resource_tracker-0.2.0.tar.gz.
File metadata
- Download URL: resource_tracker-0.2.0.tar.gz
- Upload date:
- Size: 100.6 kB
- Tags: Source
- Uploaded using Trusted Publishing? No
- Uploaded via: twine/6.1.0 CPython/3.13.1
File hashes
| Algorithm | Hash digest | |
|---|---|---|
| SHA256 |
058a8d652b32486e9887b984a470c3a0efdbdfb3c3e9efe59d6d8111f051b685
|
|
| MD5 |
b16e94093e4278a5c346182a5b752781
|
|
| BLAKE2b-256 |
61b84bc40b3e64b3781c379c1dfcaa1fc53c53e897637ec443e12db6b6162ee1
|
File details
Details for the file resource_tracker-0.2.0-py3-none-any.whl.
File metadata
- Download URL: resource_tracker-0.2.0-py3-none-any.whl
- Upload date:
- Size: 109.9 kB
- Tags: Python 3
- Uploaded using Trusted Publishing? No
- Uploaded via: twine/6.1.0 CPython/3.13.1
File hashes
| Algorithm | Hash digest | |
|---|---|---|
| SHA256 |
9e74717e58f99470b035c71ad45e0543ea8dda27abff6c397fcbe44c5068737d
|
|
| MD5 |
b59969b23557cad17b907cb322234dd6
|
|
| BLAKE2b-256 |
67397d244ad7973e107263ce005b0751591f342892735b99cb041549650ba418
|


