
Plotting ridgeplots with matplotlib

Project description
ridgeplot-py




This is a simple module for plotting ridgeplot with the scipy ecosystem.
Ridgeplot is a great data visualization technique to compare distributions from multiple groups at the same time, and was first introduced in 2017 as joy plot:
I hereby propose that we call these "joy plots" #rstats https://t.co/uuLGpQLAwY
— Jenny Bryan (@JennyBryan) April 25, 2017
ridgeplot-py provides a simple API to produce matplotlib-compatible ridgeplots, as well as a handy ColorEncoder class with scikit-learn syntax for manipulating color annotations in a consistent way [through out manuscripts or presentations].
Install
git clone git@github.com:wckdouglas/ridgeplot-py.git
cd ridgeplot-py
python setup.py install
or via conda:
conda install -c conda-forge ridgeplot-py
or via pypi:
pip install ridgeplot-py
Usage
from ridgeplot import ridgeplot
from ridgeplot.colors import ColorEncoder, ColorPalette
import numpy as np
import matplotlib.pyplot as plt

# mocking some data
# the input data should be a dict of
# - keys: group names for the distributions
# - values: list of values
data = {}
for i in range(8):
    data['data_{}'.format(i)] = np.random.randn(100) * (i+1)

# make the plot
fig = plt.figure()
ax = fig.add_subplot(111)
ridgeplot(
    ax,
    data,
    xlim=(-20,20),
    label_size=15
)
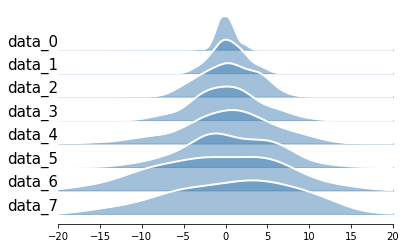
Example
A notebook showing quick howto is included in this repo!
Build on Apple silicon
scipy may cause error and may be able to solved by the this stackoverflow answer:
brew install openblas
export OPENBLAS="$(brew --prefix openblas)"
poetry install
Release history Release notifications | RSS feed


Download files
Download the file for your platform. If you're not sure which to choose, learn more about installing packages.
Source Distribution
Built Distribution
Filter files by name, interpreter, ABI, and platform.
If you're not sure about the file name format, learn more about wheel file names.
Copy a direct link to the current filters
File details
Details for the file ridgeplot_py-0.6.4.tar.gz.
File metadata
- Download URL: ridgeplot_py-0.6.4.tar.gz
- Upload date:
- Size: 83.8 kB
- Tags: Source
- Uploaded using Trusted Publishing? No
- Uploaded via: twine/5.1.1 CPython/3.12.8
File hashes
| Algorithm | Hash digest | |
|---|---|---|
| SHA256 |
0ebc9a1913b17d058e33b90150e8cd8c8aaf62f7f8e79a4dd47e443539651e79
|
|
| MD5 |
ddda365c5112bd746def672e04b902fb
|
|
| BLAKE2b-256 |
60b116ac81cf74df27e8f07021681fb5caf352665f5553a589a4972c4bd338e0
|
File details
Details for the file ridgeplot_py-0.6.4-py3-none-any.whl.
File metadata
- Download URL: ridgeplot_py-0.6.4-py3-none-any.whl
- Upload date:
- Size: 12.5 kB
- Tags: Python 3
- Uploaded using Trusted Publishing? No
- Uploaded via: twine/5.1.1 CPython/3.12.8
File hashes
| Algorithm | Hash digest | |
|---|---|---|
| SHA256 |
5b990703ab4ea68c47a6509170bfd36992a3229cd1e7a68fc71226c52f5bb484
|
|
| MD5 |
331f5099b9af5d8256b53577810276a4
|
|
| BLAKE2b-256 |
9eae8d87ba2672508d09f36a8ca8b71077b497f3d355b7e32cf6d04e35efbb99
|






