A rio-tiler plugin to create tile for arbitraty grid


Project description
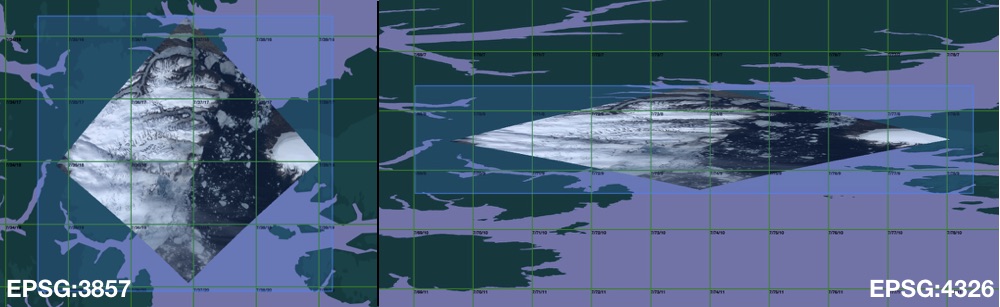
rio-tiler-crs
A rio-tiler plugin to create tiles in different projection


Install
$ pip install pip -U
$ pip install rio-tiler-crs

# Or using source

$ pip install git+http://github.com/cogeotiff/rio-tiler-crs
How To
rio-tiler-crs uses morecantile to define the custom tiling grid schema.
- Define grid system
import morecantile
from rasterio.crs import CRS

# Use default TMS
tms = morecantile.tms.get("WorldCRS84Quad")

# or create a custom TMS
crs = CRS.from_epsg(3031)  # Morecantile TileMatrixSet uses Rasterio CRS object
extent = [-948.75, -543592.47, 5817.41, -3333128.95]  # From https:///epsg.io/3031
tms = morecantile.TileMatrixSet.custom(extent, crs)
- read tile
from rio_tiler_crs import COGReader

# Read tile x=10, y=10, z=4
with COGReader("myfile.tif", tms=tms) as cog:
    tile, mask = cog.tile( 10, 10, 4)
API
class COGReader:
    """
    Cloud Optimized GeoTIFF Reader.

    Examples
    --------
    with CogeoReader(src_path) as cog:
        cog.tile(...)

    with rasterio.open(src_path) as src_dst:
        with WarpedVRT(src_dst, ...) as vrt_dst:
            with CogeoReader(None, dataset=vrt_dst) as cog:
                cog.tile(...)

    with rasterio.open(src_path) as src_dst:
        with CogeoReader(None, dataset=src_dst) as cog:
            cog.tile(...)

    Attributes
    ----------
    filepath: str
        Cloud Optimized GeoTIFF path.
    dataset: rasterio.DatasetReader, optional
        Rasterio dataset.
    tms: morecantile.TileMatrixSet, optional
        TileMatrixSet to use, default is WebMercatorQuad.

    Properties
    ----------
    minzoom: int
        COG minimum zoom level in TMS projection.
    maxzoom: int
        COG maximum zoom level in TMS projection.
    bounds: tuple[float]
        COG bounds in WGS84 crs.
    center: tuple[float, float, int]
        COG center + minzoom
    colormap: dict
        COG internal colormap.
    info: dict
        General information about the COG (datatype, indexes, ...)

    Methods
    -------
    tile(0, 0, 0, indexes=(1,2,3), expression="
B1/B2", tilesize=512, resampling_methods="nearest")
        Read a map tile from the COG.
    part((0,10,0,10), indexes=(1,2,3,), expression="
B1/B20", max_size=1024)
        Read part of the COG.
    preview(max_size=1024)
        Read preview of the COG.
    point((10, 10), indexes=1)
        Read a point value from the COG.
    stats(pmin=5, pmax=95)
        Get Raster statistics.
    meta(pmin=5, pmax=95)
        Get info + raster statistics

    """
Properties
- dataset: Return the rasterio dataset
- colormap: Return the dataset's internal colormap
- minzoom: Return minimum TMS Zoom
- maxzoom: Return maximum TMS Zoom
- bounds: Return the dataset bounds in WGS84
- center: Return the center of the dataset + minzoom
- spatial_info: Return the bounds, center and zoom infos
- info: Return simple metadata about the dataset
with COGReader("myfile.tif") as cog:
    print(cog.info)
{
    "bounds": [-119.05915661478785, 13.102845359730287, -84.91821332299578, 33.995073647795806],
    "center": [-101.98868496889182, 23.548959503763047, 3],
    "minzoom": 3,
    "maxzoom": 12,
    "band_metadata": [[1, {}]],
    "band_descriptions": [[1,"band1"]],
    "dtype": "int8",
    "colorinterp": ["palette"],
    "nodata_type": "Nodata",
    "colormap": {
        "0": [0, 0, 0, 0],
        "1": [0, 61, 0, 255],
        ...
    }
}
Methods
- tile(): Read map tile from a raster
tms = morecantile.tms.get("WorldCRS84Quad")
with COGReader("myfile.tif", tms=tms) as cog:
    tile, mask = cog.tile(1, 2, 3, tilesize=256)

# With indexes
with COGReader("myfile.tif", tms=tms) as cog:
    tile, mask = cog.tile(1, 2, 3, tilesize=256, indexes=1)

# With expression
with COGReader("myfile.tif", tms=tms) as cog:
    tile, mask = cog.tile(1, 2, 3, tilesize=256, expression="B1/B2")
- part(): Read part of a raster
Note: tms has no effect on part read.
tms = morecantile.tms.get("WorldCRS84Quad")
with COGReader("myfile.tif", tms=tms) as cog:
    data, mask = cog.part((10, 10, 20, 20))

# Limit output size (default is set to 1024)
with COGReader("myfile.tif", tms=tms) as cog:
    data, mask = cog.part((10, 10, 20, 20), max_size=2000)

# Read high resolution
with COGReader("myfile.tif", tms=tms) as cog:
    data, mask = cog.part((10, 10, 20, 20), max_size=None)

# With indexes
with COGReader("myfile.tif", tms=tms) as cog:
     data, mask = cog.part((10, 10, 20, 20), indexes=1)

# With expression
with COGReader("myfile.tif", tms=tms) as cog:
    data, mask = cog.part((10, 10, 20, 20), expression="B1/B2")
- preview(): Read a preview of a raster
Note: tms has no effect on part read.
with COGReader("myfile.tif") as cog:
    data, mask = cog.preview()

# With indexes
with COGReader("myfile.tif") as cog:
    data, mask = cog.preview(indexes=1)

# With expression
with COGReader("myfile.tif") as cog:
    data, mask = cog.preview(expression="B1+2,B1*4")
- point(): Read point value of a raster
Note: tms has no effect on part read.
with COGReader("myfile.tif") as cog:
    print(cog.point(-100, 25))

# With indexes
with COGReader("myfile.tif") as cog:
    print(cog.point(-100, 25, indexes=1))
[1]

# With expression
with COGReader("myfile.tif") as cog:
    print(cog.point(-100, 25, expression="B1+2,B1*4"))
[3, 4]
- stats(): Return image statistics (Min/Max/Stdev)
Note: tms has no effect on stats.
with COGReader("myfile.tif") as cog:
    print(cog.stats())
{
    "1": {
        "pc": [1, 16],
        "min": 1,
        "max": 18,
        "std": 4.069636227214257,
        "histogram": [
            [...],
            [...]
        ]
    }
}
- metadata(): Return COG info + statistics
with COGReader("myfile.tif") as cog:
    print(cog.metadata())
{
    "bounds": [-119.05915661478785, 13.102845359730287, -84.91821332299578, 33.995073647795806],
    "center": [-101.98868496889182, 23.548959503763047, 3],
    "minzoom": 3,
    "maxzoom": 12,
    "band_metadata": [[1, {}]],
    "band_descriptions": [[1,"band1"]],
    "dtype": "int8",
    "colorinterp": ["palette"],
    "nodata_type": "Nodata",
    "colormap": {
        "0": [0, 0, 0, 0],
        "1": [0, 61, 0, 255],
        ...
    }
    "statistics" : {
        1: {
            "pc": [1, 16],
            "min": 1,
            "max": 18,
            "std": 4.069636227214257,
            "histogram": [
                [...],
                [...]
            ]
        }
    }
}
API - STAC
Previously in its own module stac-tiler, STACReader has been moved in rio-tiler-crs.
from rio_tiler_crs import STACReader

with STACReader("stac.json") as stac:
    tile, mask = stac.tile(1, 2, 3, tilesize=256, assets=["red", "green"])
class STACReader:
    """
    STAC + Cloud Optimized GeoTIFF Reader.

    Examples
    --------
    with STACReader(stac_path) as stac:
        stac.tile(...)

    my_stac = {
        "type": "Feature",
        "stac_version": "1.0.0",
        ...
    }
    with STACReader(None, item=my_stac) as stac:
        stac.tile(...)

    Attributes
    ----------
    filepath: str
        STAC Item path, URL or S3 URL.
    item: Dict, optional
        STAC Item dict.
    tms: morecantile.TileMatrixSet, optional
        TileMatrixSet to use, default is WebMercatorQuad.
    minzoom: int, optional
        Set minzoom for the tiles.
    minzoom: int, optional
        Set maxzoom for the tiles.
    include_assets: Set, optional
        Only accept some assets.
    exclude_assets: Set, optional
        Exclude some assets.
    include_asset_types: Set, optional
        Only include some assets base on their type
    include_asset_types: Set, optional
        Exclude some assets base on their type

    Properties
    ----------
    bounds: tuple[float]
        STAC bounds in WGS84 crs.
    center: tuple[float, float, int]
        STAC item center + minzoom

    Methods
    -------
    tile(0, 0, 0, assets="B01", expression="
B01/B02")
        Read a map tile from the COG.
    part((0,10,0,10), assets="B01", expression="
B1/B20", max_size=1024)
        Read part of the COG.
    preview(assets="B01", max_size=1024)
        Read preview of the COG.
    point((10, 10), assets="B01")
        Read a point value from the COG.
    stats(assets="B01", pmin=5, pmax=95)
        Get Raster statistics.
    info(assets="B01")
        Get Assets raster info.
    metadata(assets="B01", pmin=5, pmax=95)
        info + stats

    """
- tile(): Read map tile from STAC assets
with STACReader("stac.json") as stac:
    tile, mask = stac.tile(1, 2, 3, tilesize=256, assets=["red", "green"])

# With expression
with STACReader("stac.json") as stac:
    tile, mask = cog.tile(1, 2, 3, tilesize=256, expression="red/green")
- part(): Read part of STAC assets
with STACReader("stac.json") as stac:
    data, mask = stac.part((10, 10, 20, 20), assets=["red", "green"])

# Limit output size (default is set to 1024)
with STACReader("stac.json") as stac:
    data, mask = stac.part((10, 10, 20, 20), max_size=2000, assets=["red", "green"])

# Read high resolution
with STACReader("stac.json") as stac:
    data, mask = stac.part((10, 10, 20, 20), max_size=None, assets=["red", "green"])

# With expression
with STACReader("stac.json") as stac:
    data, mask = stac.part((10, 10, 20, 20), expression="red/green")
- preview(): Read a preview of STAC assets
with STACReader("stac.json") as stac:
    data, mask = stac.preview(assets=["red", "green"])

# With expression
with STACReader("stac.json") as stac:
    data, mask = stac.preview(expression="red/green")
- point(): Read point value of STAC assets
with STACReader("stac.json") as stac:
    pts = stac.point(-100, 25, assets=["red", "green"])


# With expression
with STACReader("stac.json") as stac:
    pts = stac.point(-100, 25, expression="red/green")
- info(): Return simple metadata for STAC assets
with STACReader("stac.json") as stac:
    info = stac.info("B01")
{
    "B01": {
        "bounds": [23.10607624352815, 31.50517374437416, 24.296464503939944, 32.51933487169619],
        "center": [23.701270373734047, 32.012254308035175, 8],
        "minzoom": 8,
        "maxzoom": 11,
        "band_metadata": [[1, {}]],
        "band_descriptions": [[1, "band1"]],
        "dtype": "uint16",
        "colorinterp": ["gray"],
        "nodata_type": "Nodata"
    }
}
- stats(): Return statistics for STAC assets (Min/Max/Stdev)
with STACReader("stac.json") as stac:
    print(stac.stats(["B01"]))
{
    "B01": {
        "1": {
            "pc": [
                324,
                5046
            ],
            "min": 133,
            "max": 8582,
            "std": 1230.6977195618235,
            "histogram": [
                [
                    199042, 178438, 188457, 118369, 57544, 20622, 9275, 2885, 761, 146
                ],
                [
                    133, 977.9, 1822.8, 2667.7, 3512.6, 4357.5, 5202.4, 6047.3, 6892.2, 7737.099999999999, 8582
                ]
            ]
        }
    }
}
- metadata(): Return info and statistics for STAC assets
with STACReader("stac.json") as stac:
    print(stac.metadata(["B01"], pmin=5, pmax=95))
{
    "B01": {
        "bounds": [23.10607624352815, 31.50517374437416, 24.296464503939944, 32.51933487169619],
        "center": [23.701270373734047, 32.012254308035175, 8],
        "minzoom": 8,
        "maxzoom": 11,
        "band_metadata": [[1, {}]],
        "band_descriptions": [[1, "band1"]],
        "dtype": "uint16",
        "colorinterp": ["gray"],
        "nodata_type": "Nodata"
        "statistics": {
            "1": {
                "pc": [
                    324,
                    5046
                ],
                "min": 133,
                "max": 8582,
                "std": 1230.6977195618235,
                "histogram": [
                    [
                        199042, 178438, 188457, 118369, 57544, 20622, 9275, 2885, 761, 146
                    ],
                    [
                        133, 977.9, 1822.8, 2667.7, 3512.6, 4357.5, 5202.4, 6047.3, 6892.2, 7737.099999999999, 8582
                    ]
                ]
            }
        }
    }
Example
See /demo
Contribution & Development
Issues and pull requests are more than welcome.
dev install
$ git clone https://github.com/cogeotiff/rio-tiler-crs.git
$ cd rio-tiler-crs
$ pip install -e .[dev]
Python >=3.7 only
This repo is set to use pre-commit to run isort, flake8, pydocstring, black ("uncompromising Python code formatter") and mypy when committing new code.
$ pre-commit install

$ git add .

$ git commit -m'my change'
isort....................................................................Passed
black....................................................................Passed
Flake8...................................................................Passed
Verifying PEP257 Compliance..............................................Passed
mypy.....................................................................Passed

$ git push origin
Release history Release notifications | RSS feed


Download files
Download the file for your platform. If you're not sure which to choose, learn more about installing packages.
Source Distribution
File details
Details for the file rio-tiler-crs-3.0b3.tar.gz.
File metadata
- Download URL: rio-tiler-crs-3.0b3.tar.gz
- Upload date:
- Size: 9.6 kB
- Tags: Source
- Uploaded using Trusted Publishing? No
- Uploaded via: twine/3.2.0 pkginfo/1.5.0.1 requests/2.24.0 setuptools/40.8.0 requests-toolbelt/0.9.1 tqdm/4.48.0 CPython/3.7.2
File hashes
| Algorithm | Hash digest | |
|---|---|---|
| SHA256 |
e2d8fa0fe76b1b6ad618dbfdccdba94090788f541d008f2b2f8de54cd5a0202e
|
|
| MD5 |
7a66dfaafb816f3869075c4b8d1a7a67
|
|
| BLAKE2b-256 |
c992c26be23c1c31631bbd47f1f6cbff1cf554807196943ba47b186f2eedee13
|


