
Opinionated OSM-theme road/edge map styling for folium, lonboard & the web (data-driven palettes, casing, themes)
Verified details
These details have been verified by PyPIProject links
GitHub Statistics
Maintainers

Project description
roadstyle



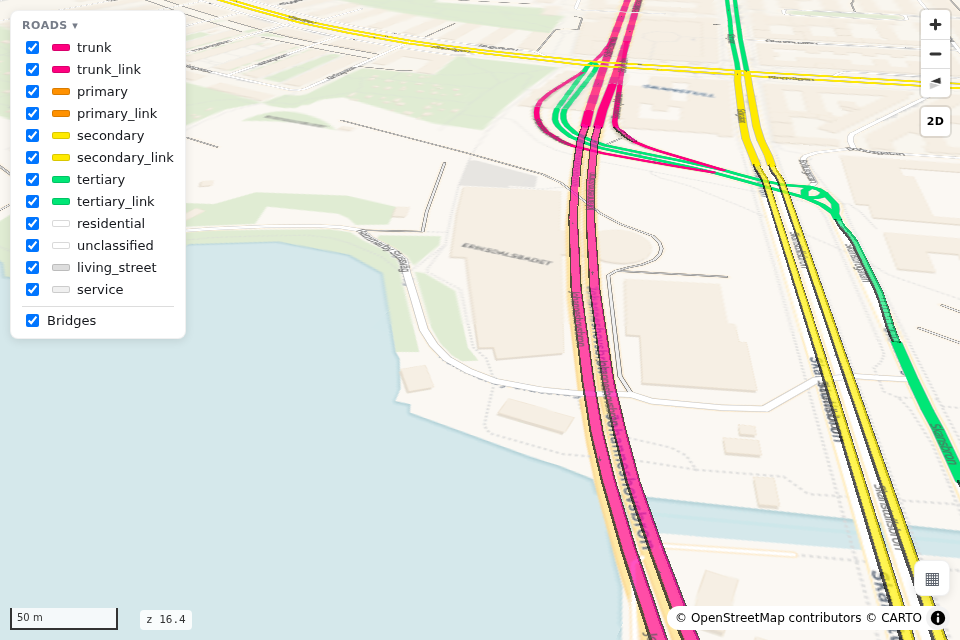
Turn a GeoDataFrame of road edges into a styled, interactive, self-contained map — proper road cartography (the casing + fill "geometry sandwich", per-zoom widths, street names, one-way arrows, tunnel/bridge grade separation, optional 3D bridge decks) in one offline HTML file, with a scriptable JavaScript API.
Contents: Features · Installation · Quickstart · The studio (no code) · Rendering parameters · Data contract · Recipes · JavaScript API · Settings · Command line · Documentation
Features
- Real road cartography — casing + fill sandwich, importance-ordered junctions, per-zoom widths (openstreetmap-carto model), two-way lanes, curved street names, one-way arrows.
- Grade separation — tunnels faded + dashed underneath, bridges on decks on top (stacked
structures ordered by their OSM
layer), and an optional 3D view with extruded bridge decks. - One offline file — MapLibre and the data are bundled into the saved HTML; it opens by
double-click, no server, no internet (with the
blankbasemap: zero network requests). - Data-driven styling — colour/width by any column (categorical or numeric ramps), per-edge colour tables, and multiple colour layers switchable client-side.
- Big networks —
tiles=Truepacks the roads as an embedded vector tileset (PMTiles): ~10⁵-edge maps open in seconds and stay responsive, still one offline file. - A JavaScript API — every control is scriptable (
rsQuery,rsFilter,rsColor,rsSelect, …) withrs:*events, so the saved map can power your own dashboard. - Three backends —
web(MapLibre, the flagship),folium(Leaflet, legends),lonboard(GPU, millions of edges).
Installation
Python ≥ 3.10. Core dependencies (geopandas, shapely, folium, branca) install
automatically.
pip install roadstyle                # from PyPI (v0.2.0+)

# or the latest development state straight from GitHub:
pip install "roadstyle @ git+https://github.com/Khoshkhah/roadstyle.git"
Optional features are extras — install only what you need:
| Extra | Enables | Pulls in |
|---|---|---|
numeric |
continuous colour ramps + classification (color_by on numbers) |
mapclassify, matplotlib |
tiles |
tiles=True — embedded vector tiles for big networks |
mapbox-vector-tile, pmtiles |
lonboard |
the GPU backend for very large edge sets | lonboard |
duckdb |
from_duckdb() — read edges straight from DuckDB |
duckdb |
arrow |
read edges from a pyarrow Table | pyarrow |
basemaps |
any XYZ provider from the xyzservices registry | xyzservices |
pip install "roadstyle[numeric,tiles]"
Development install (clone + editable + test tools):
git clone https://github.com/Khoshkhah/roadstyle.git && cd roadstyle
pip install -e ".[dev]"
# or with conda: conda env create -f environment.yml && conda activate roadstyle && pip install -e ".[dev]"
pytest                               # 160 tests; browser tests need `pip install playwright`
Uninstall: pip uninstall roadstyle. Your personal settings overrides
(~/.config/roadstyle/roadstyle.json, project-local roadstyle.json) are your files — pip
leaves them in place; delete them yourself if you want a clean slate.
Quickstart
import geopandas as gpd
import roadstyle as rs

edges = gpd.read_file("edges.gpkg")          # any CRS; needs a `highway` class column

rs.render_edges(edges).save("map.html")                          # done — open map.html
That one line gives you the full treatment: per-zoom widths, two-way lanes, arrows, street names, hover/select with popups, a base-map switcher, a class filter panel, grade separation. Common variations:
rs.render_edges(edges, basemap="dark_matter", view_3d=True).save("map3d.html")   # dark + 3D bridges
rs.render_edges(edges, palette="carto", basemap="positron").save("carto.html")   # the classic OSM look
rs.render_edges(edges, include=["motorway", "trunk", "primary"]).save("major.html")
rs.render_edges(edges, color_by="aadt", cmap="viridis").save("traffic.html")     # colour by your data
rs.render_edges(edges, tiles=True).save("big.html")                              # 10⁵-edge networks

rs.render_dashboard(edges).save("dashboard.html")   # a full query-sidebar dashboard page, one call
rs.render_report(edges).save("report.html")         # a stats-sidebar report page
Palettes: highsat (high-saturation, maximum legibility), carto (the muted
openstreetmap-carto look), mono (grayscale — quiet backdrop for data overlays).
The studio — the library behind knobs, no code
The gentlest way in. The studio is a small Streamlit app bundled in the repo (not part of the pip package):
git clone https://github.com/Khoshkhah/roadstyle.git && cd roadstyle
pip install roadstyle streamlit
streamlit run ui/studio/app.py
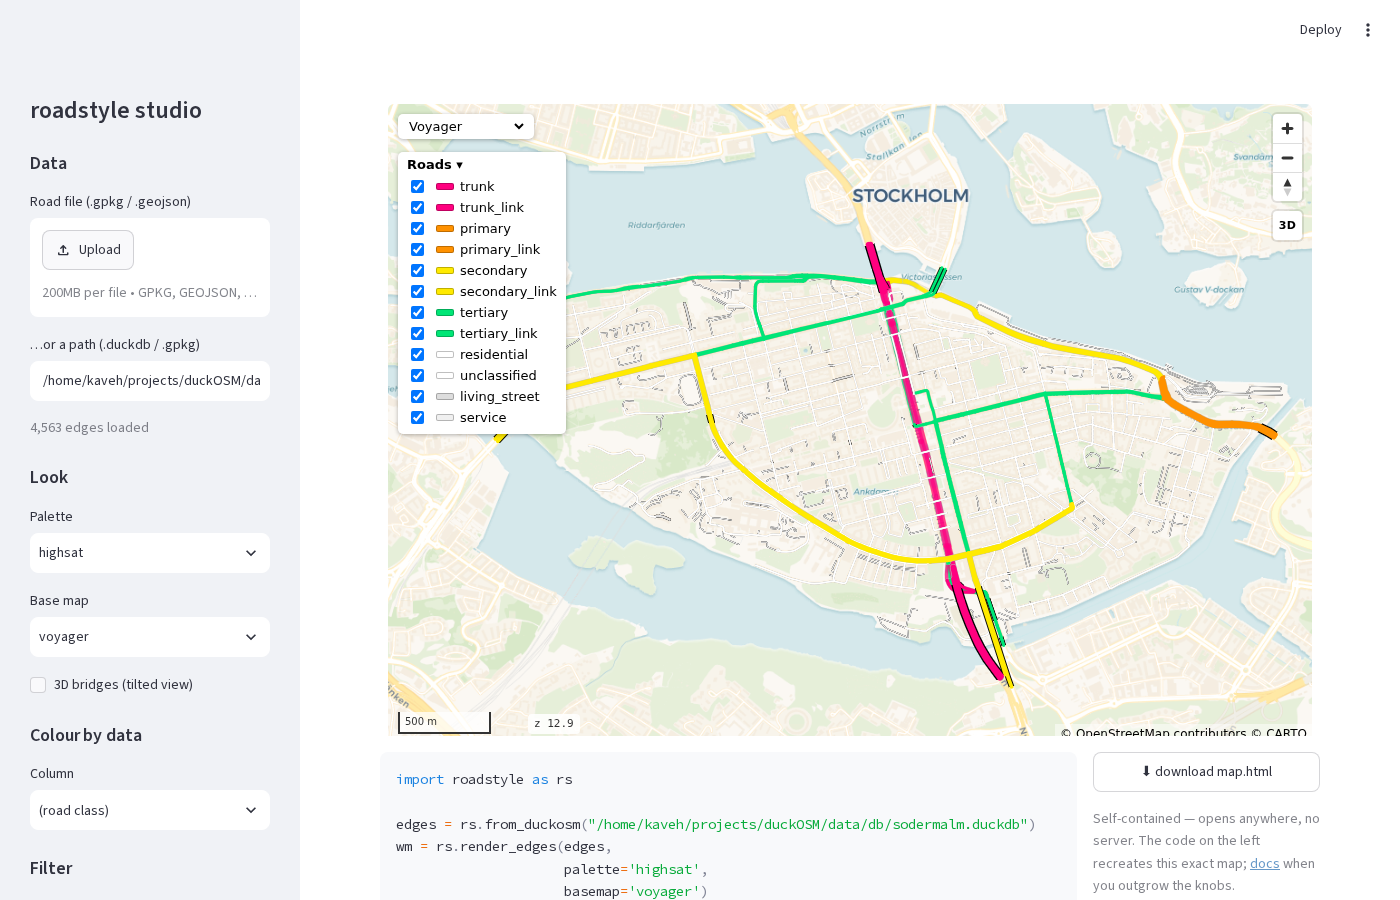
Three pages, same idea — every knob updates the live map and the exact Python code that reproduces it:
- Map — upload a road file (
.gpkg/.geojson) or pick a bundled Södermalm sample, then click through palette, base map, 3D, vector tiles, colour-by-data, class filter, minzoom, labels/arrows, popups and overlays. Copy the generatedrender_edges(...)code out, or download the self-containedmap.html. - Dashboard — the same knobs, but the product is a sidebar dashboard (query box, verb
buttons, results table, detail panel) built on the JavaScript API. Preview it live, download
dashboard.html. The generated code is a one-liner:rs.render_dashboard(edges, ...). - Report — a stats sidebar instead (KPI cards, the colour-by legend, a checkbox filter,
search, a selected-road read-out). Generated as
rs.render_report(edges, ...).
Both sidebar pages are shipped in the library — rs.render_dashboard(edges).save("dashboard.html")
and rs.render_report(edges) build them in one call, no repo checkout needed (see below).
Rendering parameters
The keywords of rs.render_edges(gdf, ...) — the ones you'll actually reach for. Full
reference with every type and edge case: docs/parameters.md.
Core
| Parameter | Default | What it does |
|---|---|---|
backend |
"web" |
"web" (MapLibre, the flagship) / "folium" (Leaflet + legends) / "lonboard" (GPU) |
palette |
"highsat" |
Class colour palette: "highsat" / "carto" / "mono", or your own |
basemap |
"voyager" |
Background map: voyager, positron, dark_matter, osm, satellite, blank, blank_dark |
basemaps |
all built-ins | The set offered in the in-map base-layer dropdown |
name |
"roadstyle" |
Page / layer title |
settings |
None |
Per-call settings override (dict or path) — see Settings |
Filtering
| Parameter | Default | What it does |
|---|---|---|
include / exclude |
None |
Keep / drop road classes (include=["motorway","primary"]); _link variants follow automatically |
filter_col |
None |
Let the filter panel list a different column than the one that drives styling |
minzoom |
None (off) |
Hide minor classes when zoomed out: True for the built-in table, or a {class: zoom} dict. Applies to the vector tiles too |
Colour by data
| Parameter | Default | What it does |
|---|---|---|
color_by |
None |
Colour by a column instead of road class |
colors |
None |
Categorical {value: "#hex"} map, or "self" to use the column's value as the literal colour |
cmap / vmin / vmax |
None |
Numeric colour ramp ("viridis", …) and its value range |
width_by |
None |
(min_px, max_px) — scale line width with the numeric value |
color_table |
None |
Per-edge colours: {edge_id: "#hex"} dict / Series / DataFrame (gray fallback, class widths kept) |
color_options |
None |
Bake several colour layers + a client-side Colour by dropdown: {"Traffic": {"color_by": "aadt", "cmap": "viridis"}, ...} |
Camera & 3D (web backend)
| Parameter | Default | What it does |
|---|---|---|
view_3d |
False |
Tilted camera + extruded, ramped, cased 3D bridge decks + an on-map 2D/3D toggle |
pitch / bearing |
settings | Starting camera tilt / rotation |
UI toggles (web backend)
| Parameter | Default | What it does |
|---|---|---|
arrows |
True |
One-way direction chevrons |
labels |
True |
Curved street-name labels |
filter_control |
True |
The collapsible road-class filter panel (doubles as a colour legend) |
basemap_switcher |
True |
The base-layer dropdown |
road_popup |
True |
Click popup: True (curated fields) / [fields] / "all" / "panel" (docked read-out) / False |
tooltip |
None (off) |
Hover tooltip fields (list of columns) |
hover_color / select_color |
violet | Highlight colours for hovered / selected roads |
Extra content (web backend)
| Parameter | Default | What it does |
|---|---|---|
overlays |
None |
Your own layers (Overlay(...)) — zones under the roads, POIs on top, clickable, with a Layers toggle |
boundary |
None |
Dashed outline of the clip area, drawn on top |
selected |
None |
Pre-highlighted edges (folium backend) |
Output & scale
| Parameter | Default | What it does |
|---|---|---|
compress |
True |
Gzip the inlined data (3–4× smaller files; compress=False for plain JSON) |
tiles |
False |
Embedded-PMTiles vector tileset — for ~10⁵-edge networks (needs the tiles extra) |
Column mapping
| Parameter | Default | What it does |
|---|---|---|
highway_col |
"highway" |
The road-class column that drives styling |
tunnel_col / bridge_col / layer_col |
"tunnel" / "bridge" / "layer" |
Grade-separation columns |
Everything stylistic — the actual colours, widths, casing, label/arrow cosmetics, camera defaults, bridge-deck geometry — is deliberately not a keyword but a setting.
Data contract — which column powers what
Only two things are required; every other column lights up a feature when present and is skipped when absent:
| Column | Values | Powers |
|---|---|---|
| geometry | LineString (any CRS) | required — the edges themselves |
highway |
OSM class (motorway…service) |
required — colour, width, casing, draw order |
name |
text | street-name labels + the popup title |
oneway |
True/False / yes/no |
direction arrows (without it, one-way is inferred from reverse-geometry twins) |
bridge / tunnel |
truthy | grade separation: tunnels below, bridges on decks above, 3D decks in view_3d |
layer |
int | stacking order of bridges/tunnels; negative → below ground even without tunnel |
edge_id |
id (64-bit safe) | popups + click-to-copy; ids > 2⁵³ are kept exact as strings |
| anything else | anything | shown in the click popup / hover tooltip, queryable from JavaScript |
Networks exported by duckOSM (duckosm export-gis)
carry exactly this column set.
Recipes
Each of these is one call — details behind the links.
# colour each edge from your own table (cluster / route / metric per edge)
rs.render_edges(edges, color_table={"4897…": "#e6194B", "5193…": "#3cb44b"})

# several colour layers in one map, switchable client-side (no re-render)
rs.render_edges(edges, palette="mono", color_options={
    "Road class": {},
    "Traffic":    {"color_by": "aadt", "cmap": "viridis"},
    "Speed":      {"color_by": "maxspeed_kmh", "cmap": "magma"}})

# your own layers under/over the roads
rs.render_edges(edges, overlays=[
    rs.Overlay(zones,   placement="under", color="#2d6cdf", opacity=0.25, label="Zones",
               popup=["taz_id", "population"]),
    rs.Overlay(sensors, placement="over",  color="#ffd166", radius=6, label="Sensors")])

# your own tile server as a base map
rs.register_basemap(rs.Basemap(key="lm", label="Lantmäteriet",
                               url="https://tiles.example.se/{z}/{x}/{y}.png", attr="© LM"))

# a static PNG for a paper, through a real headless browser (pip install playwright)
rs.snapshot(rs.render_edges(edges, view_3d=True), "fig.png",
            center=(18.076, 59.303), zoom=16, pitch=60)

# roads straight from DuckDB
edges = rs.from_duckdb(con, "SELECT edge_id, highway, name, ST_AsWKB(geom) AS geometry FROM edges")
More: the gallery — one screenshot + recipe per look.
Drive the map from JavaScript
Every in-map control is a thin UI over a window.rs* function, and the baked features are a
queryable table — so a saved map can power your own dashboard with plain HTML:
const ids = rsQuery(p => p.lanes >= 2 && p.maxspeed_kmh > 30);   // WHERE clause → id set
rsFilter(ids);                 // show only these         rsFilter(null) resets
rsColor(ids, "#ff00aa");       // paint them one colour   rsColor(null) resets
rsHighlight(ids);              // selection glow
rsGetProps(ids);               // the rows behind the ids — table-ready
rsFocus(ids);                  // fly the camera to fit them
rsSelect(id);                  // select + popup, like a click

rsSetBasemap("dark_matter");   rsSetClasses(["primary","secondary"]);
rsSetColorField("Traffic");    rsSetOverlay("Zones", false);      rsSetView3D(true);

document.addEventListener("rs:select", e => showSidebar(e.detail.properties));
Everything works the same on overlays (pass the overlay's label as the last argument) and on tiled maps. Full API table: docs/web-backend.md.
Two ready-made sidebars ship inside the package, built entirely on this API — one call each:
rs.render_dashboard(edges).save("dashboard.html")   # query box, colour-by, class filter + legend, table
rs.render_report(edges).save("report.html")          # KPI cards, colour-by legend, filter, search
color_options={...} populates their Colour by picker; every render_edges keyword passes
through. To reshape one, rs.sidebar_html("dashboard") (or "report") returns the HTML/CSS/JS
fragment — edit it and re-inject before </body>. The same fragments live in
ui/ with a build.py per template.
Settings — one defaults file, your overrides on top
EVERY styling default — palettes, opacities, casing, the width/draw-order model, base map,
camera, labels, arrows, bridge decks — ships in one file, roadstyle/data/defaults.json. You
never edit it; you state only what changes, at any of five levels (later wins):
~/.config/roadstyle/roadstyle.json— personal defaults./roadstyle.json— project-local$ROADSTYLE_CONFIG=/path/to/file.json— per runrs.use_settings({...})— from code, applies immediatelyrender_edges(..., settings={...})— this one call only
{
  "palettes":  { "highsat": { "service": { "fill": "#E0E0E0" } } },   // retint one class
  "config":    { "basemap": "dark_matter", "labels": { "color": "#8899aa" } },
  "roads":     { "z_order": { "service": 5 }, "width": { "secondary": { "18": 14 } } }
}
Details: docs/palettes.md.
Command line
No Python required — point the roadstyle command at any road file:
roadstyle edges.gpkg -o map.html --basemap dark_matter        # styled interactive map
roadstyle edges.gpkg --view-3d --tiles                        # 3D + embedded vector tiles
roadstyle edges.gpkg --include motorway trunk primary
roadstyle edges.gpkg --color-by aadt --cmap viridis --width-by 1 6
roadstyle edges.gpkg -f spec -o map_data.json                 # JSON spec for your own frontend
Every flag mirrors a render_edges keyword; roadstyle --help lists them all.
Documentation
| Gallery | one screenshot + recipe per look |
| Parameter reference | every keyword, type, and default |
| Web backend | grade separation, 3D, vector tiles, colour options, the full JS API |
| Choosing an engine | web vs folium vs lonboard, data-size guidance |
| Palettes & settings | the built-in palettes and the override system |
| When to use roadstyle | vs .explore(), prettymaps, kepler.gl, raw MapLibre |
| Notebooks | a runnable manual, one topic per notebook |
| UI templates | the dashboard scaffolding + the studio |
Full MkDocs site: khoshkhah.github.io/roadstyle
(mkdocs serve locally).
License
MIT. Base-map tiles are third-party services (CARTO, OSM, Esri) with their own attribution and terms; the styling spec is transcribed from the cartographic design docs in the osm-traffic-enrichment project.
Project details
Verified details
These details have been verified by PyPIProject links
GitHub Statistics
Maintainers
Release history Release notifications | RSS feed


Download files
Download the file for your platform. If you're not sure which to choose, learn more about installing packages.
Source Distribution
Built Distribution
Filter files by name, interpreter, ABI, and platform.
If you're not sure about the file name format, learn more about wheel file names.
Copy a direct link to the current filters
File details
Details for the file roadstyle-0.3.0.tar.gz.
File metadata
- Download URL: roadstyle-0.3.0.tar.gz
- Upload date:
- Size: 384.5 kB
- Tags: Source
- Uploaded using Trusted Publishing? Yes
- Uploaded via: twine/6.1.0 CPython/3.13.14
File hashes
| Algorithm | Hash digest | |
|---|---|---|
| SHA256 |
01dc82902582756c3b9924002b49297d7866456a1791f2d2195c9a51925595bf
|
|
| MD5 |
638d27bc76b498e8a77abb78de8b7ef8
|
|
| BLAKE2b-256 |
53c3bda33c9d0878b04d3975cc13f3987ce8f22a5f1448fb4fc86437d2134012
|
Provenance
The following attestation bundles were made for roadstyle-0.3.0.tar.gz:
Publisher:
release.yml on Khoshkhah/roadstyle
-
Statement:
-
Statement type:
https://in-toto.io/Statement/v1 -
Predicate type:
https://docs.pypi.org/attestations/publish/v1 -
Subject name:
roadstyle-0.3.0.tar.gz -
Subject digest:
01dc82902582756c3b9924002b49297d7866456a1791f2d2195c9a51925595bf - Sigstore transparency entry: 2232905180
- Sigstore integration time:
-
Permalink:
Khoshkhah/roadstyle@dc9b1b0cc2cfa0ad004c0e87d0d548cb2b460791 -
Branch / Tag:
refs/tags/v0.3.0 - Owner: https://github.com/Khoshkhah
-
Access:
public
-
Token Issuer:
https://token.actions.githubusercontent.com -
Runner Environment:
github-hosted -
Publication workflow:
release.yml@dc9b1b0cc2cfa0ad004c0e87d0d548cb2b460791 -
Trigger Event:
push
-
Statement type:
File details
Details for the file roadstyle-0.3.0-py3-none-any.whl.
File metadata
- Download URL: roadstyle-0.3.0-py3-none-any.whl
- Upload date:
- Size: 365.9 kB
- Tags: Python 3
- Uploaded using Trusted Publishing? Yes
- Uploaded via: twine/6.1.0 CPython/3.13.14
File hashes
| Algorithm | Hash digest | |
|---|---|---|
| SHA256 |
055e78a293ccadfa980c581e43e950e147e0547cd2f39a06d65c7eaf2418c5ae
|
|
| MD5 |
f285a942eb67e6fc6d138f67ffffd4e3
|
|
| BLAKE2b-256 |
81f2745798659ad84a35249142ad879bd2bed298864fc69c747cb0ff82582842
|
Provenance
The following attestation bundles were made for roadstyle-0.3.0-py3-none-any.whl:
Publisher:
release.yml on Khoshkhah/roadstyle
-
Statement:
-
Statement type:
https://in-toto.io/Statement/v1 -
Predicate type:
https://docs.pypi.org/attestations/publish/v1 -
Subject name:
roadstyle-0.3.0-py3-none-any.whl -
Subject digest:
055e78a293ccadfa980c581e43e950e147e0547cd2f39a06d65c7eaf2418c5ae - Sigstore transparency entry: 2232906004
- Sigstore integration time:
-
Permalink:
Khoshkhah/roadstyle@dc9b1b0cc2cfa0ad004c0e87d0d548cb2b460791 -
Branch / Tag:
refs/tags/v0.3.0 - Owner: https://github.com/Khoshkhah
-
Access:
public
-
Token Issuer:
https://token.actions.githubusercontent.com -
Runner Environment:
github-hosted -
Publication workflow:
release.yml@dc9b1b0cc2cfa0ad004c0e87d0d548cb2b460791 -
Trigger Event:
push
-
Statement type:






