

roadstyle
Beautiful, interactive road maps from Python.
One offline HTML file with real road cartography, Google Street View and a JavaScript API.





Install · Quickstart · Gallery · AI agents · Documentation
Why roadstyle
- Real road cartography. Casing and fill, widths that change with zoom, street names, one-way arrows, tunnels drawn under and bridges over, and optional 3D bridge decks.
- One offline file. Map, data and styling in a single HTML page: open it without a server, email it, or put it on any website.
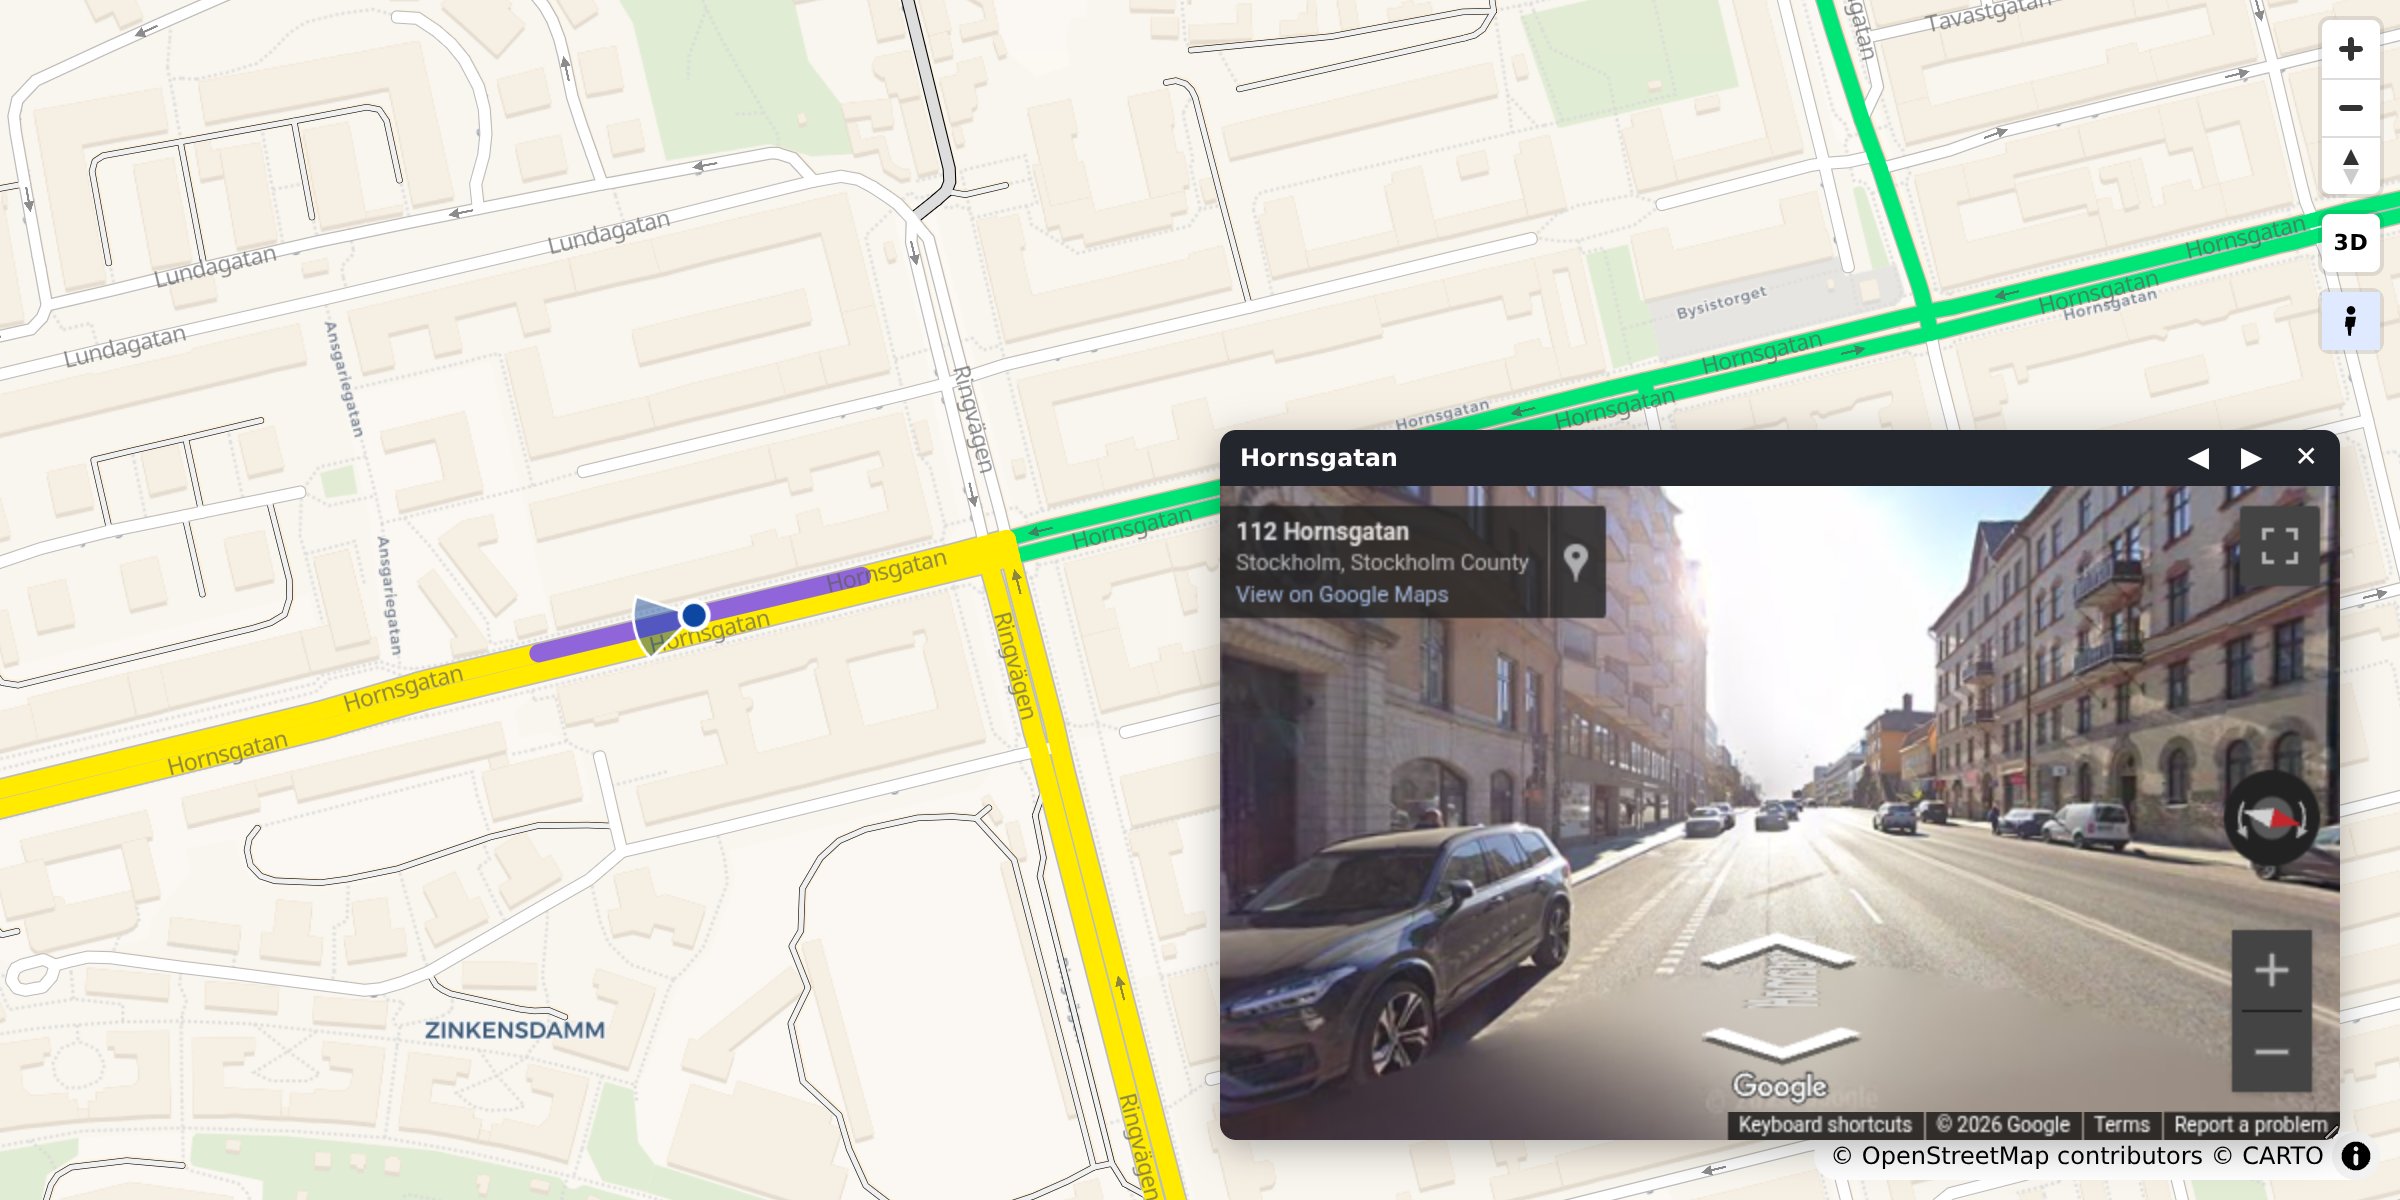
- Street View built in. Click any road to see it in Google Street View, facing the way it runs.
- Any road data. A GeoDataFrame, a file, DuckDB, Arrow, osmnx or duckOSM.
- Colour by your data. Speed, traffic or any column, with a legend and a menu of colourings.
- Scriptable. A
window.rs*JavaScript API and events for your own dashboard. - Ready for AI agents. An MCP server and an agent skill.
Install
pip install roadstyle              # core
pip install "roadstyle[all]"       # + studio, numeric ramps, vector tiles, lonboard, DuckDB, …
Python ≥ 3.10. Individual extras and the dev setup: Install.
Quickstart
From OpenStreetMap, no data needed. Any place, with osmnx (pip install osmnx):
import osmnx as ox
import roadstyle as rs

G = ox.graph_from_place("Tartu, Estonia", network_type="drive", simplify=False)
G = ox.simplify_graph(G, edge_attrs_differ=["bridge", "tunnel"])   # keep tunnels and bridges apart
rs.render_edges(ox.graph_to_gdfs(G, nodes=False)).save("tartu.html")
From your own data. Any file or GeoDataFrame with line geometry and a highway column:
import geopandas as gpd
import roadstyle as rs

edges = gpd.read_file("edges.gpkg")        # LineStrings + a `highway` column, any CRS
rs.render_edges(edges).save("map.html")    # open map.html: no server (Street View needs one)
More looks:
rs.render_edges(edges, basemap="dark_matter", view_3d=True)            # dark, 3D bridge decks
rs.render_edges(edges, palette="carto", basemap="positron")            # the classic OSM look
rs.render_edges(edges, color_by="aadt", cmap="viridis")                # colour by your data
rs.render_edges(edges, palette="mono", color_options={                 # several colourings,
    "Traffic": {"color_by": "aadt", "cmap": "viridis"},                #   switched in the browser
    "Speed":   {"color_by": "maxspeed_kmh", "cmap": "magma"}})
rs.render_edges(edges, tiles=True)                                     # 100k+ edges
rs.render_dashboard(edges).save("dashboard.html")                      # map + query sidebar
rs.render_street_view(edges).save("street_view.html")                  # map and Street View side by side
No Python? roadstyle edges.gpkg -o map.html --basemap dark_matter, or click through it in the
workbench: pip install "roadstyle[studio]" && roadstyle studio.
Gallery
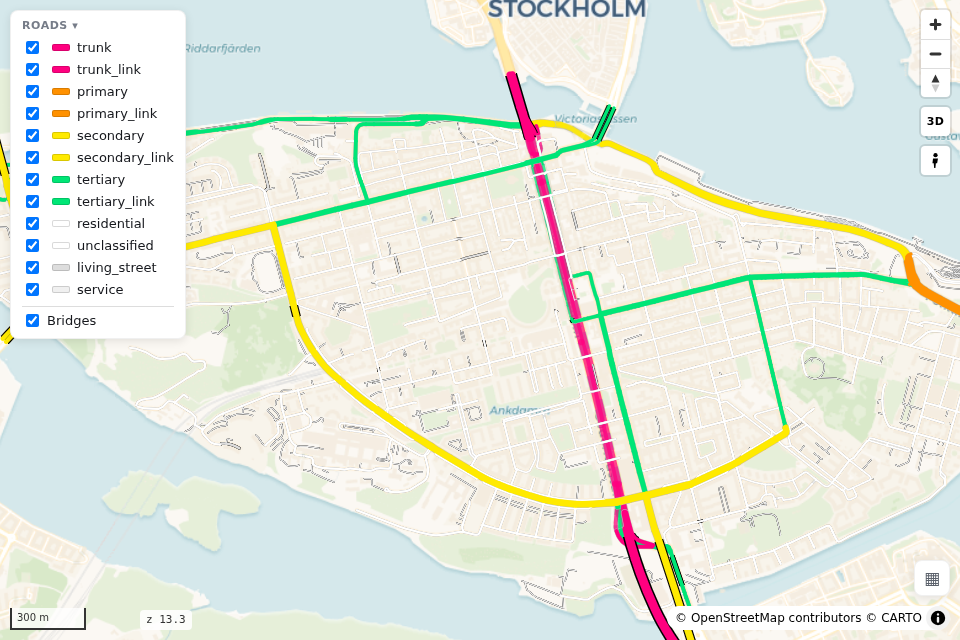 The defaults rs.render_edges(edges) |
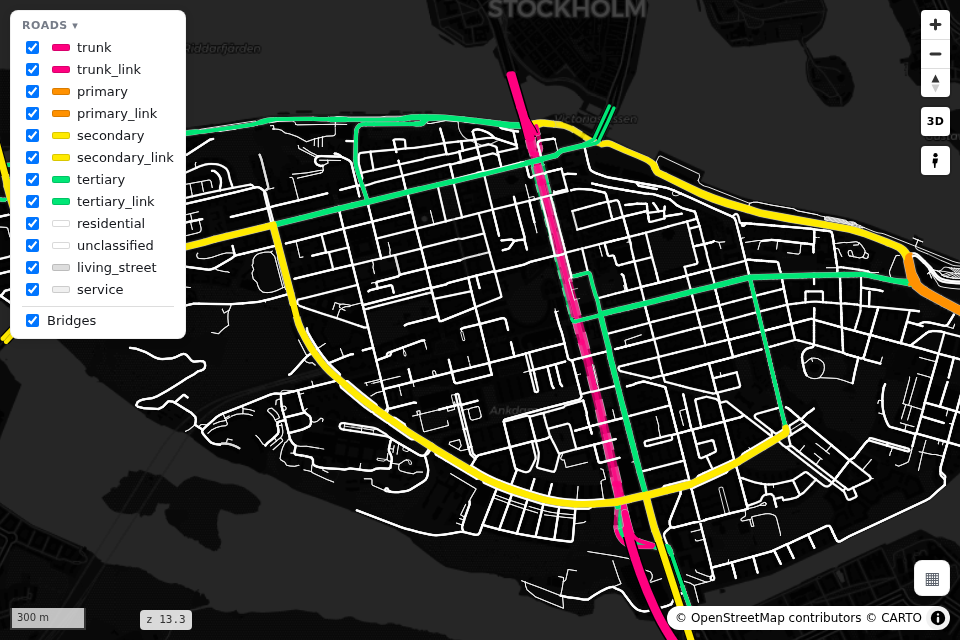 Dark basemap="dark_matter" |
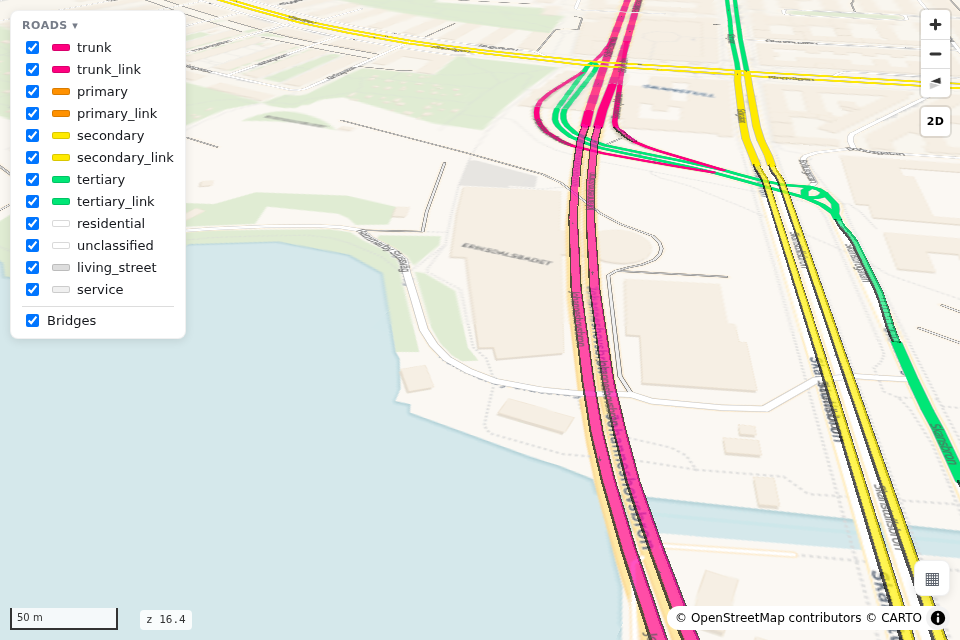 3D bridges view_3d=True |
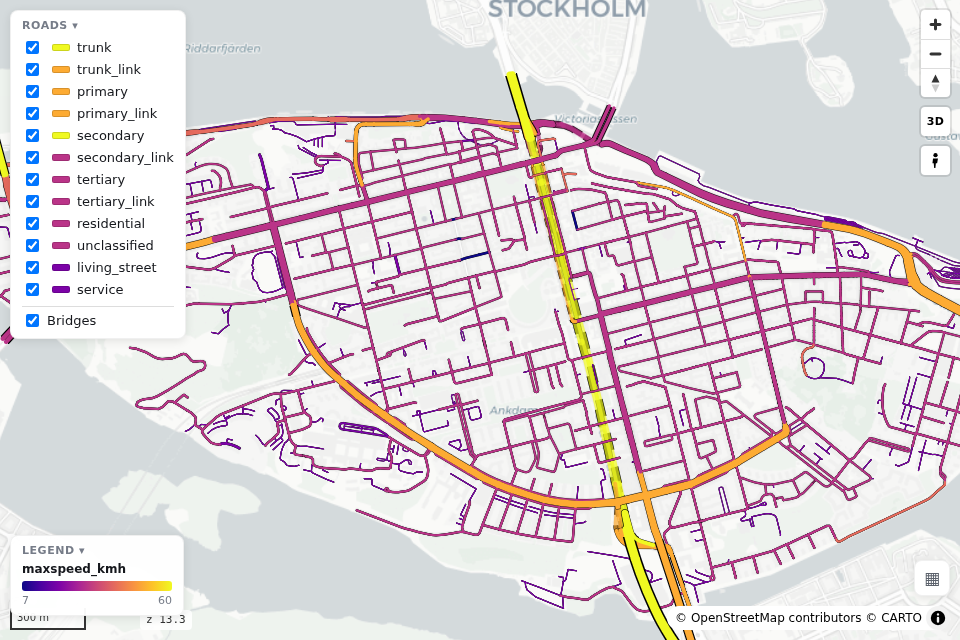 Colour by your data color_by="maxspeed_kmh", cmap="plasma" |
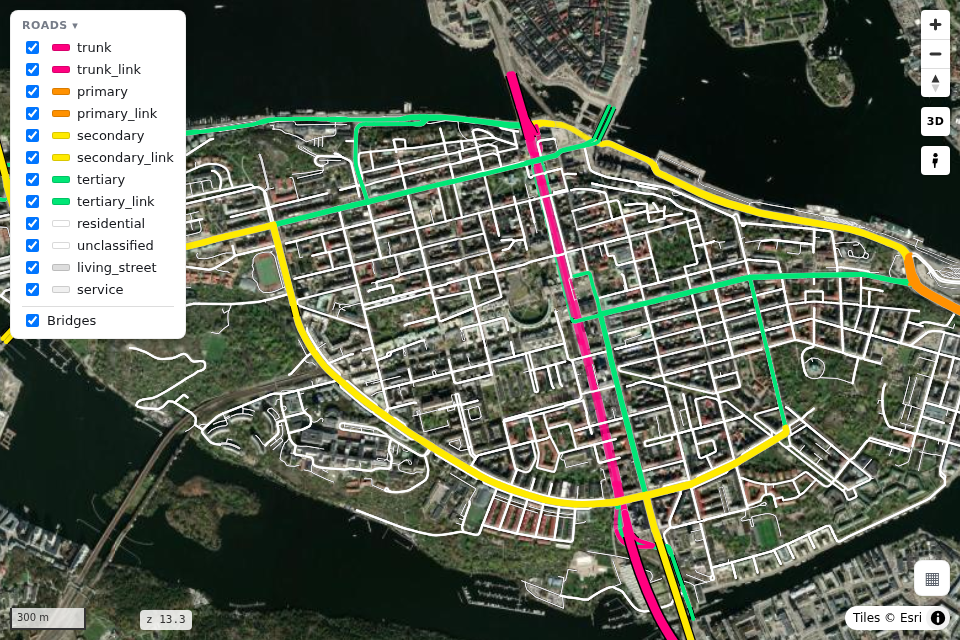 Satellite basemap="satellite" |
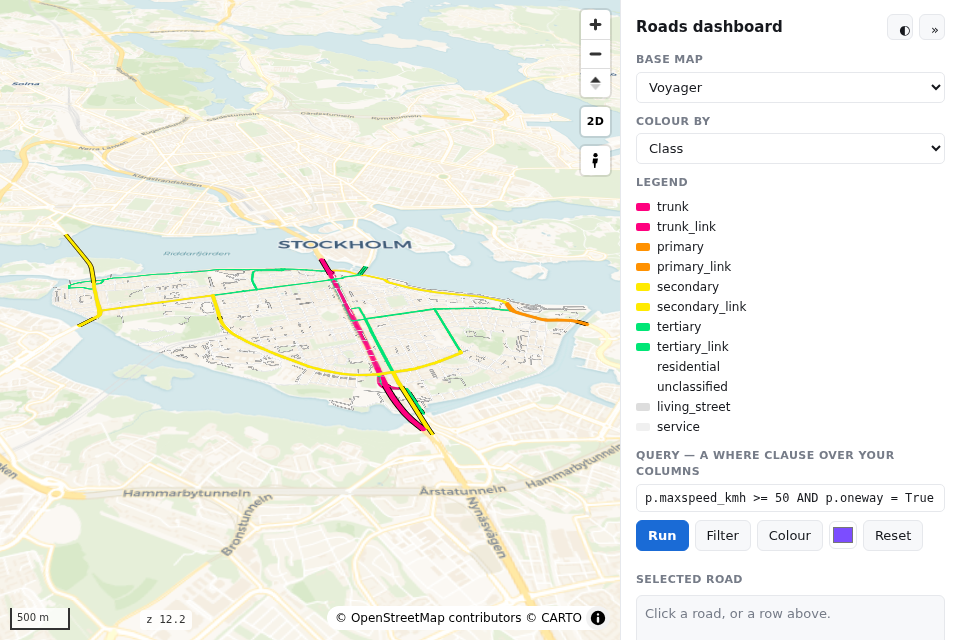 Dashboard rs.render_dashboard(edges) |
Every look with its code: the gallery.
What goes in
Only geometry and highway are required. Other columns switch features on:
| Column | Powers |
|---|---|
geometry (LineString, any CRS) |
the edges. Each edge is directed: a two-way road is two edges with reversed geometry |
highway (OSM class) |
colour, width, casing, draw order |
name |
street labels, popup title |
oneway |
direction arrows |
bridge / tunnel / layer |
grade separation: tunnels below, bridges on decks above |
edge_id |
popups; 64-bit ids stay exact |
| anything else | shown in the popup, queryable from JavaScript |
duckOSM (duckosm export-gis) exports exactly this, and
osmnx edges work as they are: rs.render_edges(ox.graph_to_gdfs(G, nodes=False)).
Drive it from JavaScript
The saved page exposes window.rs* functions and rs:* events:
const ids = rsQuery(p => p.maxspeed_kmh > 30); // feature ids whose properties match
rsColor(ids, "#ff00aa");  rsFocus(ids);       // paint them, fit the camera
document.addEventListener("rs:select", e => console.log(e.detail.properties));
Every function and event: JavaScript API.
For AI agents
MCP server. Lets any MCP-capable AI app (Claude Code, Claude Desktop, Cursor, …) draw road maps
without writing code: render_place("Tartu, Estonia"), render_file("roads.gpkg") and snapshot.
Each saves an HTML map and returns its path plus a PNG preview the agent can look at.
claude mcp add roadstyle -- uvx roadstyle-mcp
Claude Desktop, and where the maps go
In claude_desktop_config.json:
{"mcpServers": {"roadstyle": {"command": "uvx", "args": ["roadstyle-mcp"]}}}
Maps are saved in ~/roadstyle-maps/. The PNG preview needs Chromium, once:
uvx --from roadstyle-mcp playwright install chromium.
Claude Code plugin. The MCP server and the skill below in one install:
/plugin marketplace add Khoshkhah/roadstyle
/plugin install roadstyle@roadstyle
For agents that write code:
skills/roadstyle/SKILL.md: a skill for agents that use roadstyle (the one call, the data contract, the JS API, the traps). Install it for Claude Code:mkdir -p ~/.claude/skills/roadstyle && curl -fsSL -o ~/.claude/skills/roadstyle/SKILL.md \ https://raw.githubusercontent.com/Khoshkhah/roadstyle/main/skills/roadstyle/SKILL.md
AGENTS.md: for agents working on this repo.llms.txt: the docs site as a link list for LLMs.
API keys
Both keys are optional. roadstyle works without them, just with less.
- CARTO, for the default base map. Without a key its tiles are stamped API KEY REQUIRED;
set
CARTO_API_KEY, or use a keyless base map (esri_street,esri_dark_gray,osm,blank). - Google Maps, for Street View. Street View works with no key. A key adds a Linked mode: a real panorama, with the map marker walking and turning with you.
Setting up the CARTO key
The default base map (voyager) and positron and dark_matter come
from CARTO. Without a key, their tiles are stamped API KEY REQUIRED. Get a free key at
carto.com/basemaps/apikey, then use any one of these:
export CARTO_API_KEY="…" # environment variable
{ "config": { "api_keys": { "carto": "…" } } }
Save that JSON as ~/.config/roadstyle/roadstyle.json, or as roadstyle.json in the folder you run
from. In Python you can pass rs.render_edges(edges, api_key="…") instead. With no key at all, use
a keyless base map: esri_street, esri_dark_gray, osm or blank.
Setting up the Google Maps key
Street View works with no key: the keyless Google embed. With a Google Maps JavaScript API key, the Street View panel and window get a Linked / Classic switch. Linked is a real panorama: the map marker walks and turns with you, and only Google's own street photos are shown. Classic is the keyless embed. To get a key:
- In the Google Cloud console, create a project and enable Maps JavaScript API (Google asks for a billing account on the project).
- Under APIs & Services > Credentials, create an API key.
- Restrict it: Application restrictions = Websites, listing your site's addresses
(e.g.
https://example.com/*); API restrictions = Maps JavaScript API only.
Then pass it in:
rs.render_edges(edges, street_view_key="AIza…")         # the floating Street View window
rs.render_street_view(edges, street_view_key="AIza…")   # the side-by-side page
The key is written into the page, as every browser key is, so the site restriction in step 3 is
what protects it. It also means Linked works only on the addresses you listed: to try it on
localhost, add http://localhost:*/* to the list. Keep the key out of git, for example in an
environment variable.
More: settings & base maps · Google Street View.
Documentation
khoshkhah.github.io/roadstyle, with live maps on every page.
| Where | What you find |
|---|---|
| Get started | install, a first map, what your data needs |
| Guides | style the roads · colour by your data · your own layers · Google Street View · big networks · dashboards & JavaScript · on a website |
| Gallery | a picture and one line of code per look |
| Reference | every parameter · JavaScript API · settings & base maps · command line |
| Changelog | what changed in each release |
License
MIT. Base-map tiles come from third-party services (CARTO, OSM, Esri) with their own attribution and terms.
1 maintainer

Release files for roadstyle 0.9.1
For a detailed explanation of source distributions (sdists) and built distributions (wheels), please see the package formats documentation.
Source distribution (sdist)
| File | Size | Uploaded | |
|---|---|---|---|
| roadstyle-0.9.1.tar.gz | 429.6 kB | Details |
Built distribution (wheel)
| File | Interpreter | ABI | Platform | Reset |
|---|---|---|---|---|
| roadstyle-0.9.1-py3-none-any.whl | Python 3 | none | any | Details |
Total release size: 837.1 kB
Release files / roadstyle-0.9.1.tar.gz
| Download URL | roadstyle-0.9.1.tar.gz |
|---|---|
| Size | 429.6 kB |
| Tags | Source |
|
SHA-256 checksum How to use checksums |
187a65c4df4d313eb7ce859f415afd75b5072c7ad843113d341591311d51748a
|
|
BLAKE2b-256 checksum How to use checksums |
02357e9a41fee6a530bf9f450bcf0ee2eff66338b46ca183f1e6a648d0e129ca
|
| Upload date | |
|
Uploaded using Trusted Publishing? What is trusted publishing? |
Yes |
| Uploaded via |
twine/7.0.0 CPython/3.13.14
|
Provenance
Provenance describes where a file came from. On PyPI, provenance is shared via attestations, which provide a verifiable record of the build or publishing details. View details, limitations and caveats.


PyPI Publish Attestation
PyPI verified that this artifact, at this checksum, originated from the publisher listed below.
Signed by GitHub Actions, verified by PyPI on Sep 29, 2026.
Transparency logRelease files / roadstyle-0.9.1-py3-none-any.whl
| Download URL | roadstyle-0.9.1-py3-none-any.whl |
|---|---|
| Size | 407.6 kB |
| Tags | Python 3 |
|
SHA-256 checksum How to use checksums |
b125fbe42dd8d208d7dcf44a096df97b4dc15bb17e4ec75d7e4806d2776813bb
|
|
BLAKE2b-256 checksum How to use checksums |
32edab43bb11c8b47e54a3a661674c86075a61d911bcce83e26811da8715e03f
|
| Upload date | |
|
Uploaded using Trusted Publishing? What is trusted publishing? |
Yes |
| Uploaded via |
twine/7.0.0 CPython/3.13.14
|
Provenance
Provenance describes where a file came from. On PyPI, provenance is shared via attestations, which provide a verifiable record of the build or publishing details. View details, limitations and caveats.
PyPI Publish Attestation
PyPI verified that this artifact, at this checksum, originated from the publisher listed below.
Signed by GitHub Actions, verified by PyPI on Sep 29, 2026.
Transparency log













