
A lightweight health data analytics tool for monthly time-series visualization and distribution analysis.

Project description
📘 rr2graph — Visualize Blood Pressure, Pulse, and Weight Data











rr2graph is a lightweight command‑line tool for processing and visualizing blood pressure, pulse, and weight data stored in Excel files.
It generates monthly plots (box‑swarm, scatter, histogram, violin) and exports them automatically as PNG, PDF, and SVG.
📤 Example Output
Example visualization using scatter and box‑swarm plots:
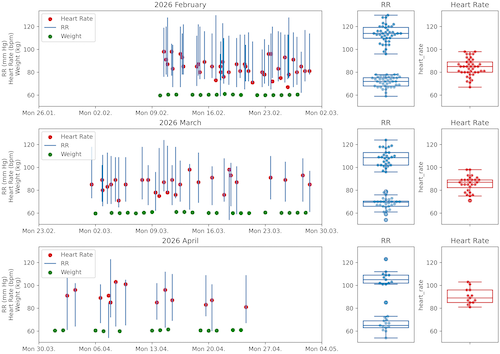
Format: A4 Landscape (11.69 × 8.27 inch)
The CLI prints all generated files:
Heart rows read: 81
Weight rows read: 49
→ Excel file: rr_data.xlsx
→ Months: 3
→ Output folder: plots/
Generating histogram plots…
Generated histogram plots stored at:
– plots/png/(2026-02__2026-04 3 months) per month data and histogram.png
– plots/pdf/(2026-02__2026-04 3 months) per month data and histogram.pdf
– plots/svg/(2026-02__2026-04 3 months) per month data and histogram.svg
…
🐳 Docker Quickstart (End‑User)
🇩🇪 Wenn Sie rr2graph ohne lokale Python‑Installation nutzen möchten, finden Sie eine vollständige Anleitung in:
👉 Docker - Quickstart für End‑User
🐍 Python Quickstart (Virtual Environment, End‑User)
🇩🇪 Wenn Sie rr2graph lokal mit Python in einer isolierten Umgebung nutzen möchten, finden Sie eine vollständige Schritt‑für‑Schritt‑Anleitung in:
👉 .venv - Quickstart (Virtual Environment, End‑User)
⚡ Python Quickstart mit uv (End‑User)
Für Nutzer, die rr2graph mit dem modernen Python‑Tool uv verwenden möchten:
👉 Quickstart mit uv (End‑User)
🚀 Installation
As I'm working with pipenv, the rest of the documentation is for pipenv users:
-
Ensure you are in the project root
~/your/project/directory/
-
Install using Pipenv (editable mode)
pipenv install -e .
This installs:
- the rr2graph package (editable mode)
- all dependencies defined in pyproject.toml
-
Optional: Development dependencies
pipenv install -r requirements_dev.txt
🧰 CLI Usage
After installation, the command rr2graph becomes available.
Show help
rr2graph --help
usage: rr2graph [-h] [-e EXCEL] [-n NUM_OF_MONTHS] [-o OUTPUT] [-c CONFIG] [-v] [-g] [-i]

Reads Excel data and generates plots.

options:
  -h, --help            Show help and exit
  -e, --excel EXCEL     Path to Excel file (default: rr_data.xlsx)
  -n, --num_of_months NUM_OF_MONTHS
                        Number of months 1–6 (default: 3)
  -o, --output OUTPUT   Output folder for generated plots (default: plots/)
  -c, --config CONFIG   Optional YAML configuration file
  -v, --version         Show program version and exit
  -g, --generate-test-data
                        Generate test_rr_data.xlsx and exit
  -i, --info            Show system and configuration information
🧪 Generate Test Data
rr2graph -g
Creates:
test_rr_data.xlsx
with realistic blood pressure, pulse, and weight data.
ℹ️ System & Configuration Info
rr2graph --info
Example output:
rr2graph info
──────────────────────────────────────────────
Version:        1.1.0
Python:         3.11.15
Installed at:   /opt/homebrew/lib/python3.11/site-packages/rr2graph

Working dir:    /Users/your_user/rr2graph_test
System:         Darwin 25.3.0 (arm64)
Terminal:       utf-8

No config file found (config.yaml missing).
──────────────────────────────────────────────
Everything looks good ✓
📝 Configuration File (YAML)
Example config.yaml:
excel: "rr_data.xlsx"
num_of_months: 3
output: "plots/"
| Field | Description |
|---|---|
| excel | Path to the Excel file containing RR data |
| num_of_months | Number of months to analyze |
| output | Output directory for PNG/PDF/SVG plots |
Use it via:
rr2graph -c config.yaml
📊 Output Structure
Running:
rr2graph -c config.yaml
produces:
plots/
├── png/
├── pdf/
└── svg/
📁 Project Structure
/your/project/directory/
.
├── config.yaml
├── examples/example_box_swarm.png
├── Pipfile
├── plots/
│   ├── pdf/
│   ├── png/
│   ├── svg/
│   └── test/
├── pyproject.toml
├── README.md
├── requirements.txt
├── requirements_dev.txt
├── rr_data.xlsx
├── rr2graph/
│   ├── cli.py
│   ├── helpers.py
│   ├── io.py
│   ├── layout.py
│   ├── monthly.py
│   ├── orchestrator.py
│   ├── tools/
│   │   └── bump_version.py
│   └── plots/
│       ├── box_swarm.py
│       ├── hist.py
│       ├── scatter.py
│       └── violin.py
├── test_config.yaml
├── test_rr_data.xlsx
└── tests/
    └── test_rr2graph.py
🧪 Run Tests
pipenv run pytest
🛠 Troubleshooting
❌ UnicodeDecodeError in YAML
You likely passed an Excel file as --config.
Correct:
rr2graph -c config.yaml
Incorrect:
rr2graph -c test_rr_data.xlsx
❌ CLI command not found
Reinstall:
pipenv install -e .
👨💻 Developer Notes
Version bumping is handled via:
make version-patch
make version-minor
make version-major
TestPyPI upload:
make publish-test
Build artifacts:
make build
Manpage installation:
make install-man
make man
📄 License
MIT
Release history Release notifications | RSS feed


Download files
Download the file for your platform. If you're not sure which to choose, learn more about installing packages.
Source Distribution
Built Distribution
Filter files by name, interpreter, ABI, and platform.
If you're not sure about the file name format, learn more about wheel file names.
Copy a direct link to the current filters
File details
Details for the file rr2graph-0.2.2.tar.gz.
File metadata
- Download URL: rr2graph-0.2.2.tar.gz
- Upload date:
- Size: 118.5 kB
- Tags: Source
- Uploaded using Trusted Publishing? No
- Uploaded via: twine/6.2.0 CPython/3.14.4
File hashes
| Algorithm | Hash digest | |
|---|---|---|
| SHA256 |
c90938cae64d6fdc385fe7ad71756a9b18231f0b9f1342156f03ceb8daad81fe
|
|
| MD5 |
78b125268ab0f2ce3fca6049dc5ce96d
|
|
| BLAKE2b-256 |
7f282a4711b7fa071985136f70292885fa26bb4bea4cb5722b06b851b74af3f3
|
File details
Details for the file rr2graph-0.2.2-py3-none-any.whl.
File metadata
- Download URL: rr2graph-0.2.2-py3-none-any.whl
- Upload date:
- Size: 17.8 kB
- Tags: Python 3
- Uploaded using Trusted Publishing? No
- Uploaded via: twine/6.2.0 CPython/3.14.4
File hashes
| Algorithm | Hash digest | |
|---|---|---|
| SHA256 |
6b9e71c939c50560284cbf32b44139d9025cc4a0cac63ce0ae6dc55fb8fdf311
|
|
| MD5 |
68addcba455c24c2884987945e447c49
|
|
| BLAKE2b-256 |
6af1475eb18490ab9fd031fb259a2d1aeb873c10ef3125f40850d265efe4deda
|






