
scope-profiler
Profile Python code regions—and optionally C, Fortran, MPI, NVTX, and LIKWID—with one consistent API and HDF5 output format.
pip install scope-profiler
Quick start
from scope_profiler import ProfileManager

with ProfileManager.session():
    @ProfileManager.profile("main")
    def main():
        with ProfileManager.profile_region("work"):
            sum(range(100))  # replace with the code you want to measure

    main()
# writes profiling_data.h5 and prints a summary
Create independent managers when two profiling sessions need to coexist. Each manager records only calls made through that manager and writes its own output:
compute_profiler = ProfileManager()
io_profiler = ProfileManager()

with compute_profiler.session(file_path="compute.h5", verbose=False):
    with io_profiler.session(file_path="io.h5", verbose=False):
        with compute_profiler.profile_region("solve"):
            solve()
        with io_profiler.profile_region("checkpoint"):
            write_checkpoint()
These are independent nested sessions, not concurrent-thread support.
LIKWID’s marker state is process-global, so only one overlapping session
may use use_likwid=True.
You can also profile a script without changing its source:
scope-profiler run my_script.py
scope-profiler inspect profiling_data.h5
scope-profiler plot default profiling_data.h5 -o figures
scope-profiler report profiling_data.h5 -o report.html
Profiling can be suspended around setup, I/O, or other phases that should not appear in the trace. Pause at scope boundaries and resume when measurement is needed again:
ProfileManager.pause()
simulation.prepare_output()
ProfileManager.resume()
pause() and resume() are safe to call repeatedly. Pausing while a
profiled scope is open raises an error, so a recorded interval can never
silently span the paused period.
For time-stepping simulations, sample_every() provides the same
control with an explicit timestep number:
with ProfileManager.sample_every(10) as profile_step:
    for timestep in range(num_steps):
        with profile_step(timestep):
            simulation.step()
The equivalent fully manual form is useful when the simulation has additional conditions around profiling:
for timestep in range(num_steps):
    if timestep % 10 == 0:
        ProfileManager.resume()
    else:
        ProfileManager.pause()

    with ProfileManager.profile_region("simulation.step"):
        simulation.step()
Here only timesteps 0, 10, 20, and so on are recorded. Call
ProfileManager.setup() before the loop; the initial state is enabled,
so the first resume() is optional but makes the intent explicit.
Reports embed interactive timeline and duration charts when the optional
post-processing dependencies are installed
(pip install "scope-profiler[pproc]").
Example output
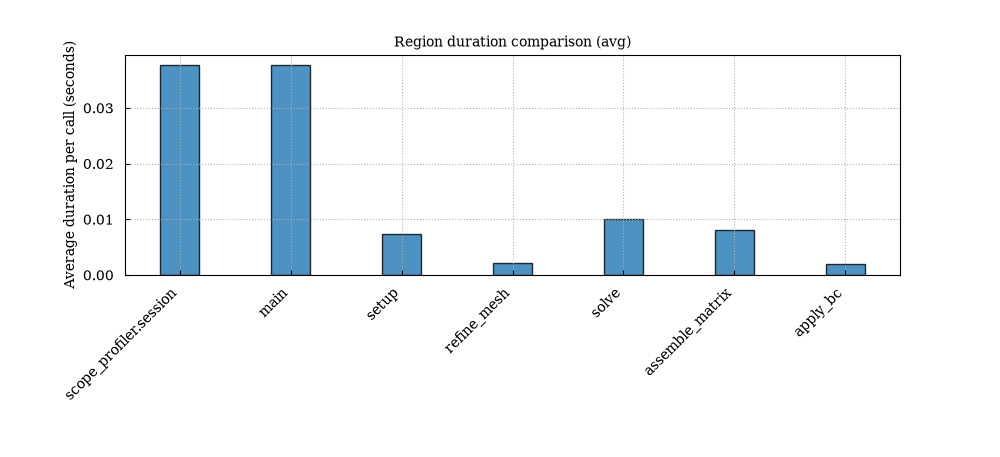
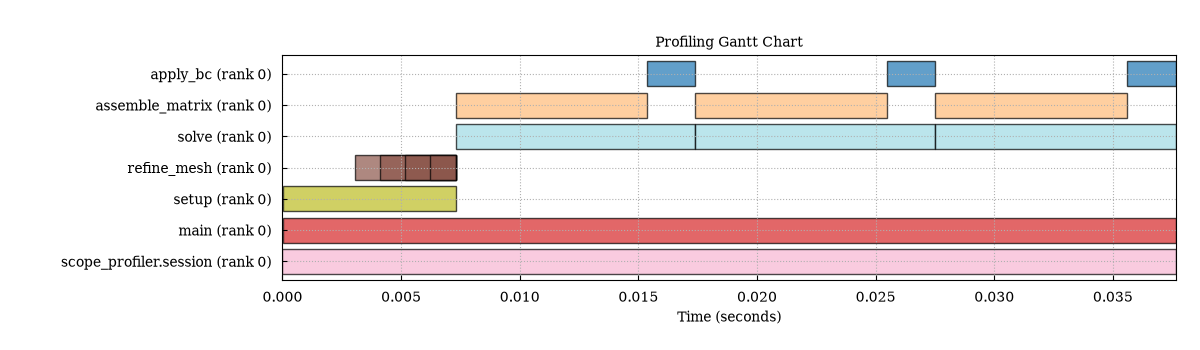
The plotting tools include duration summaries and timelines for finding expensive regions:
For dense traces, the Gantt view supports time windows, duration filtering, call coalescing, and call-depth collapsing. A binned occupancy heatmap avoids drawing every short event:
scope-profiler plot gantt profiling_data.h5 -o figures \
  --min-duration 0.001 --aggregate-calls 25 --collapse-depth 2
scope-profiler plot density profiling_data.h5 -o figures \
  --bins 200 --min-duration 0.0001 --start-time 0 --end-time 10
Use --aggregation-mode with scope-profiler run when only aggregate
timing statistics are needed and the per-call timeline should not be
recorded.
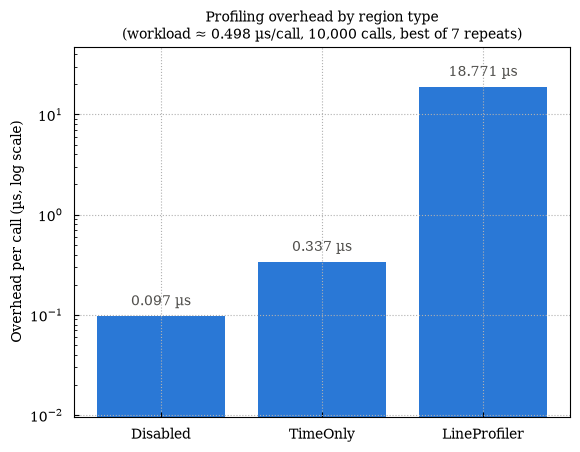
The overhead benchmark measures the cost of each instrumentation mode:
python examples/benchmark_overhead.py
In a notebook
%load_ext scope_profiler.ipython_magics adds magics for the
measure/compare loop, so a notebook needs no session() boilerplate:
%%scope_recursive
result = solve(problem)     # every call recorded, nothing instrumented
%scope_compare baseline candidate
%%scope times a cell as one region, %%scope_line breaks a function
down by line, %%scope_agg handles regions entered millions of times,
and %scope_load pulls in an HDF5 run from an MPI job to compare
against. See the notebook magics
guide.
pip install "scope-profiler[notebook]"
Documentation
- Installation
- Quick start
- Python API and post-processing
- CLI reference
- Configuration and profiling regions
- MPI, C, and Fortran
- LIKWID, line profiling, and MCP
- Jupyter/IPython magics
- Tutorial notebooks
- Examples
Development
pip install -e '.[dev]'
pytest
See AGENTS.md for the measured benchmark workflow used when optimizing this project.
1 maintainer

Download files
Download the file for your platform. If you're not sure which to choose, learn more about installing packages.
Source Distribution
Built Distribution
Filter files by name, interpreter, ABI, and platform.
If you're not sure about the file name format, learn more about wheel file names.
Copy a direct link to the current filters
File details
Details for the file scope_profiler-0.5.0.tar.gz.
File metadata
- Download URL: scope_profiler-0.5.0.tar.gz
- Upload date:
- Size: 327.1 kB
- Tags: Source
- Uploaded using Trusted Publishing? Yes
- Uploaded via:
twine/7.0.0 CPython/3.13.14
File hashes
| Algorithm | Hash digest | |
|---|---|---|
| SHA256 |
4648e2845840d715fd430999cc72e74c8021875eb72488fa8f776c617844b344
|
|
| MD5 |
a226fb4c9d1dcff711ad1e9544ebd87a
|
|
| BLAKE2b-256 |
56c2046a3669d31d317d598e7919359e5fb11c595053e94d500430e088d399cc
|
Provenance
The following attestation bundles were made for scope_profiler-0.5.0.tar.gz:
Publisher:
publish.yml on max-models/scope-profiler
-
Statement:
-
Statement type:
https://in-toto.io/Statement/v1 -
Predicate type:
https://docs.pypi.org/attestations/publish/v1 -
Subject name:
scope_profiler-0.5.0.tar.gz -
Subject digest:
4648e2845840d715fd430999cc72e74c8021875eb72488fa8f776c617844b344 - Sigstore transparency entry: 2673254071
- Sigstore integration time:
-
Permalink:
max-models/scope-profiler@e3384d283ebd367e8ba6d9afcb0f917ef5c7be22 -
Branch / Tag:
refs/heads/main - Owner: https://github.com/max-models
-
Access:
public
-
Token Issuer:
https://token.actions.githubusercontent.com -
Runner Environment:
github-hosted -
Publication workflow:
publish.yml@e3384d283ebd367e8ba6d9afcb0f917ef5c7be22 -
Trigger Event:
push
-
Statement type:
File details
Details for the file scope_profiler-0.5.0-py3-none-any.whl.
File metadata
- Download URL: scope_profiler-0.5.0-py3-none-any.whl
- Upload date:
- Size: 380.6 kB
- Tags: Python 3
- Uploaded using Trusted Publishing? Yes
- Uploaded via:
twine/7.0.0 CPython/3.13.14
File hashes
| Algorithm | Hash digest | |
|---|---|---|
| SHA256 |
622e3251ddecfa242a003b4bb7b322aa96cf81c5f76ff2bd4199cba1a3bb3dd1
|
|
| MD5 |
aafb5904237ced710d0723e6fb4636e3
|
|
| BLAKE2b-256 |
d5900e50275150ae6b340a921cfc49fa37c42b35cf87d6d93f8a8802f35f56a2
|
Provenance
The following attestation bundles were made for scope_profiler-0.5.0-py3-none-any.whl:
Publisher:
publish.yml on max-models/scope-profiler
-
Statement:
-
Statement type:
https://in-toto.io/Statement/v1 -
Predicate type:
https://docs.pypi.org/attestations/publish/v1 -
Subject name:
scope_profiler-0.5.0-py3-none-any.whl -
Subject digest:
622e3251ddecfa242a003b4bb7b322aa96cf81c5f76ff2bd4199cba1a3bb3dd1 - Sigstore transparency entry: 2673254186
- Sigstore integration time:
-
Permalink:
max-models/scope-profiler@e3384d283ebd367e8ba6d9afcb0f917ef5c7be22 -
Branch / Tag:
refs/heads/main - Owner: https://github.com/max-models
-
Access:
public
-
Token Issuer:
https://token.actions.githubusercontent.com -
Runner Environment:
github-hosted -
Publication workflow:
publish.yml@e3384d283ebd367e8ba6d9afcb0f917ef5c7be22 -
Trigger Event:
push
-
Statement type:














