
A Python package for organizing and visualizing list hierarchies.

Project description
SetPrint(ver, 0.3.1) – Easily Format and Display High-Dimensional Data!
<> A Data Visualization Tool Capable of Properly Formatting 2D/NumPy Arrays and Image Data <>
Setprint extends Python’s built-in pprint so that not only lists and dictionaries but also NumPy arrays and 2D data (including image data) can be formatted appropriately. It is a powerful data formatting tool that enhances the visibility of missing elements and dimension mismatches in arrays, thereby making debugging easier.
-
Installation
pip install setprint
-
Example Usage Template
from setprint import SetPrint

# Specify the array to be formatted
#                         ∨
list_data = SetPrint(datas)

# Specify the expansion direction (explained in detail below)
#                         ∨
keep_settings = {1:'x', 3:'yf', 4:'f'}

# Execute the formatting
format_texts = list_data.set_collection(route=True, y_axis=False, keep_settings=keep_settings)

# Display the result: Writing to a text file
# (You can display it as desired; just don’t forget to include a newline '\n' at the end!)
with open('output.txt', 'w') as f:
    for line in format_texts:
        f.write(line + '\n')
✅ Features of setprint
-
Automatically Adjusts for Missing Elements and Dimension Differences
Unlike pprint, which may easily overlook “storage bugs” or the mixing of data with different dimensions, setprint formats data so that such irregularities are immediately noticeable. It automatically fills in missing parts with blank spaces, so data inconsistencies are revealed at once.
By comparing the expected structure (templates or examples) with the actual array, you can quickly pinpoint abnormalities and understand the overall structure.
-
Debug and Visualize by Object/Structure
With setprint, you can perform debugging and visualization on a per-object (or per-structure) basis. It resolves issues such as uniform formatting or unwanted automatic line breaks.
Therefore, it is possible to maintain the intended structure when formatting 2D arrays (such as image or binary data).
Example of an OCR Program
https://github.com/mtur2007/SetPrint/blob/main/Development_files/format_data/y_x_yf_f.txt
-
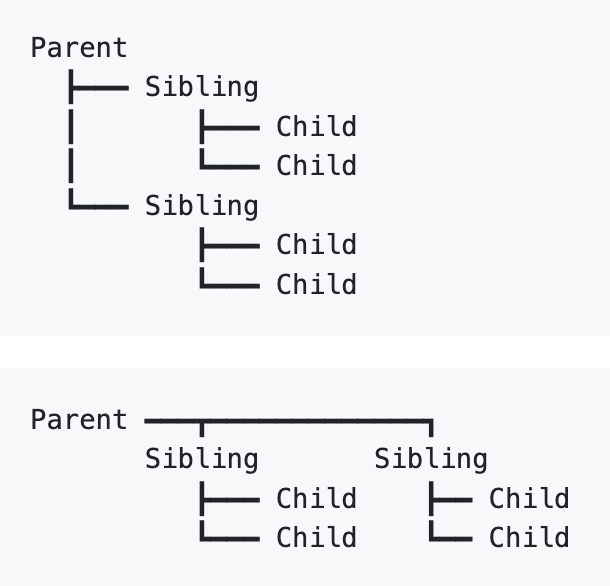
Compact Representation of Data Relationships
Instead of using brackets like []/()/{} to represent parent-child relationships,
setprint uses lines (e.g., ┣, ┃, ┗ and ┳, ━, ┓) to clearly indicate connections.
-
[Upcoming Updates]
A feature to display indices is planned, allowing for an even clearer understanding of data structure.
A mapping function to convert stored information (mapping specific values) will be added to ease data transformation.
🛠 Examples of Using setprint
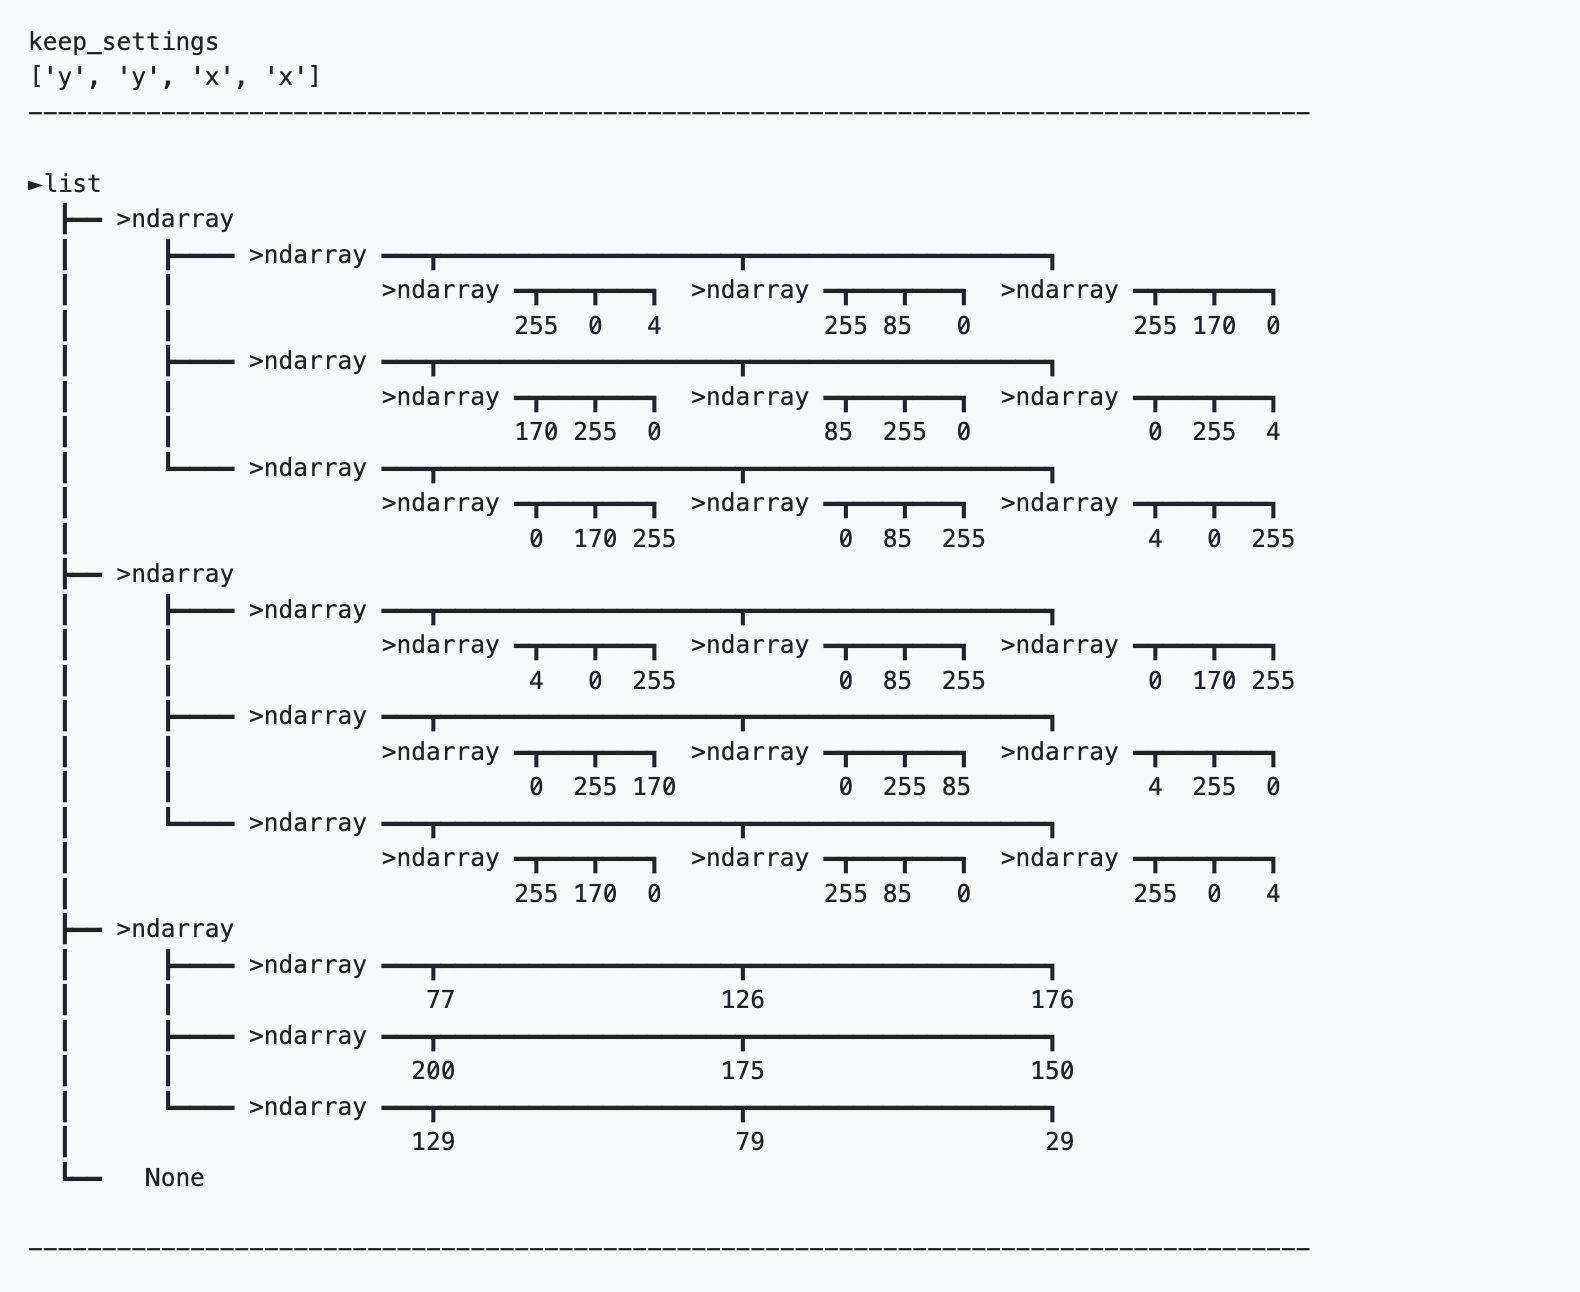
🔹 Example of Visualizing Three Different Formats of Image Data
📌 Case: When data of different dimensions are mixed (e.g., mixing RGB images with grayscale images)
import numpy as np

data = [

    # RGB image (3x3x3) – sample array
    np.array([[[255,   0,   4],
               [255,  85,   0],
               [255, 170,   0]],

              [[170, 255,   0],
               [ 85, 255,   0],
               [  0, 255,   4]],

              [[  0, 170, 255],
               [  0,  85, 255],
               [  4,   0, 255]]]),

    # Sample array in a different format (BGR image)
    np.array([[[  4,   0, 255],
               [  0,  85, 255],
               [  0, 170, 255]],

              [[  0, 255, 170],
               [  0, 255,  85],
               [  4, 255,   0]],

              [[255, 170,   0],
               [255,  85,   0],
               [255,   0,   4]]]),

    # Grayscale image (3x3) → Only this one has different dimensions
    np.array([[ 77, 126, 176],
              [200, 175, 150],
              [129,  79,  29]]),

    None

]

setprint(data)
🔹 Output from setprint
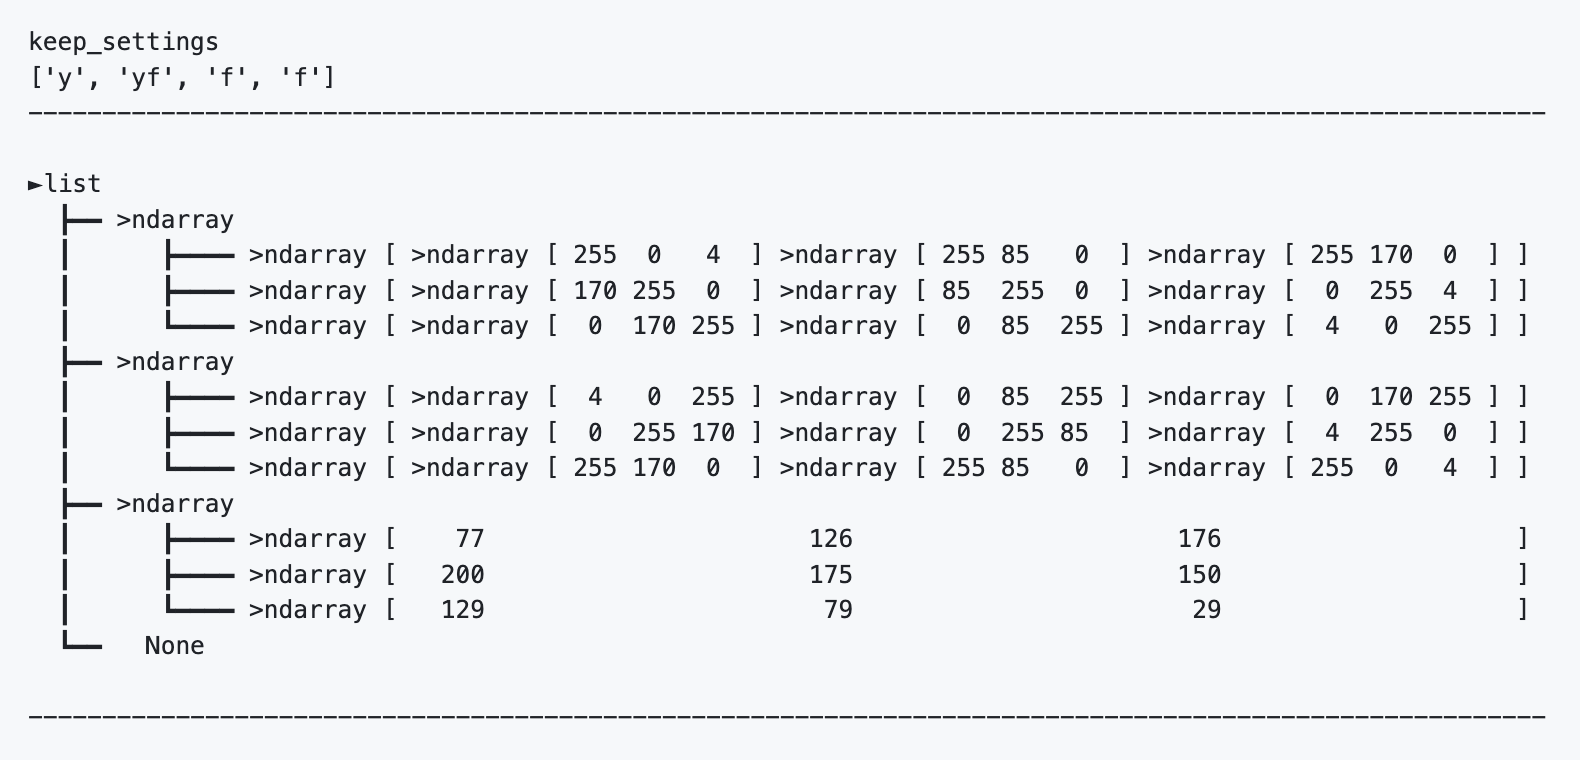
Version with Root Omission Settings
[] Parallel Arrays: Matching Array Order and Dimensions
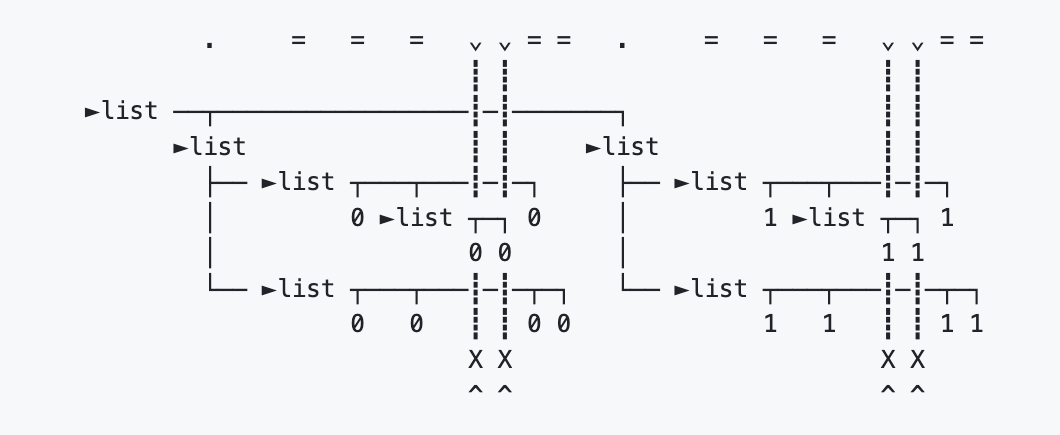
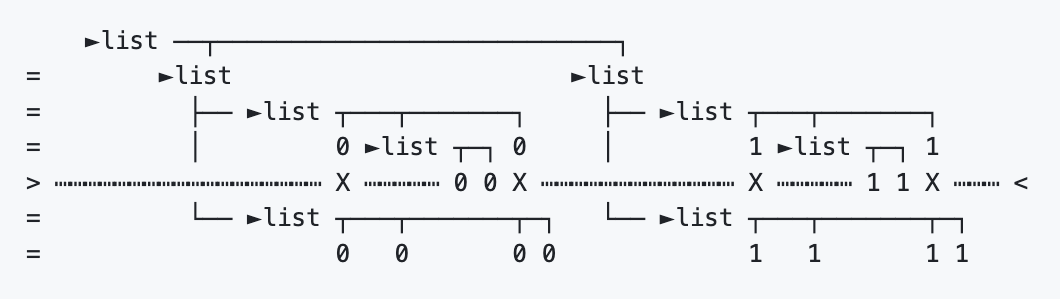
As part of the formatting process, setprint represents “storage bugs” and the mixing of data with different dimensions by aligning the array’s order and dimensions using overlapping axes.
-
Test Array
-
y-Axis – Alignment with the Order of the Parallel Array Expanded in the x Direction
This axis maintains the order alignment with the parallel array expanded in the x direction.
-
x-Axis – Alignment with the Dimensions of the Parallel Array Expanded in the y Direction
This axis maintains the dimensional alignment with the parallel array expanded in the y direction.
※ In the case of the 'f' setting, even if dimensions differ, as long as they are within range, they are displayed on one line—so differences may not be noticeable.
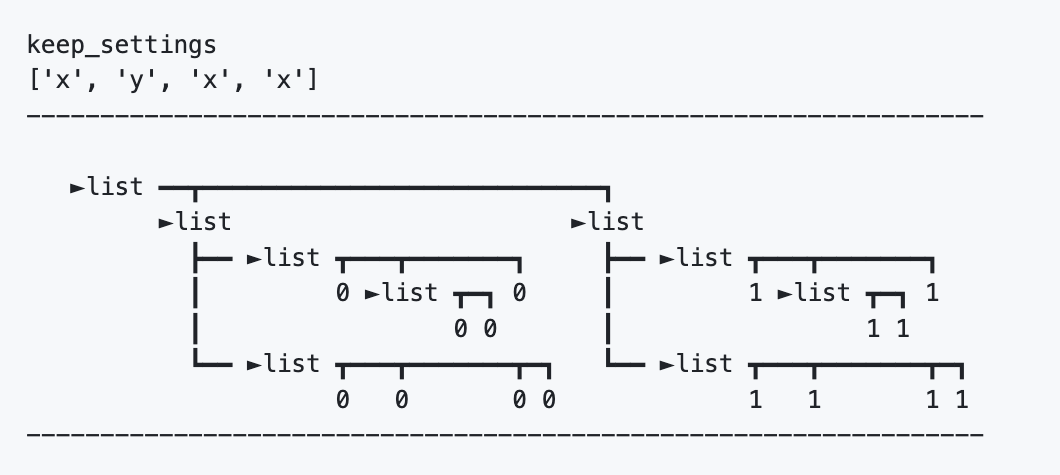
※ Regarding the Parallel Elements Represented on Both Axes
In setprint, when visualizing the alignment of array order and dimensions, arrays are arranged in parallel along both the y and x axes for comparison.
Because the meaning of each axis may differ, note the following in exceptional cases:
-
Parallel Element ( = )
The parts expanded with the settings 'x' or 'f' serve as both order alignment and parallel elements; their specific meaning is determined by the user’s application.
The parts expanded with the settings 'y' or 'yf' represent parallel elements solely.In the context of aligning dimensions, line breaks and formatting occur automatically with the 'x' or 'f' expansion settings.
※ Note that alignment is maintained only for axes expanding in the vertical or horizontal directions. For axes expanded in parallel, alignment is done per parallel element.
Methods
-
set_collectionMethod
The set_collection class method executes the formatting as demonstrated in the example above. It arranges multidimensional lists and complex data structures into a visually understandable format, enabling optimal formatting according to your data’s dimensions.
-
Parameters
-
route(bool or str): Whether to enable root display.- If set to True, lines representing the storage relationships are also output.
※ If set to 'maintenance' (str), both enabled and disabled root displays are output for maintenance purposes.
- If set to True, lines representing the storage relationships are also output.
-
y_axis(bool or str): Whether to enable y-axis display.- If set to True, the y-axis is output as well.
-
keep_setting{ dict_type } (deep/int : direction/str): Specifies the expansion direction for each dimension.- For example, {1:'y', 3:'x', 4:'yf'} — dimensions are specified in descending order, and unspecified dimensions inherit the parent setting.
- ※ The default setting is 'x'.
-
-
Return Value
format_texts: A list in which each element is a line of the formatted text.
-
Example Usage Template
from setprint import SetPrint

# Specify the array to be formatted
#                         ∨
list_data = SetPrint(datas)

# Specify the expansion direction (explained in detail below)
#                         ∨
keep_settings = {1:'x', 3:'yf', 4:'f'}

# Execute the formatting
format_texts = list_data.set_collection(route=True, y_axis=False, keep_settings=keep_settings)

# Do not display the result; instead, write it to a text file
with open('output.txt','w') as f:
    for line in format_texts:
        f.write(line+'\n')
[] Relationship Between keep_setting and Data Alignment
The keep_setting parameter allows you to specify the display direction for each dimension, offering flexible display options based on your data’s structure and intended use. Below are explanations of the behavior differences for various keep_setting values along with examples of suitable data types.
-
Example Settings
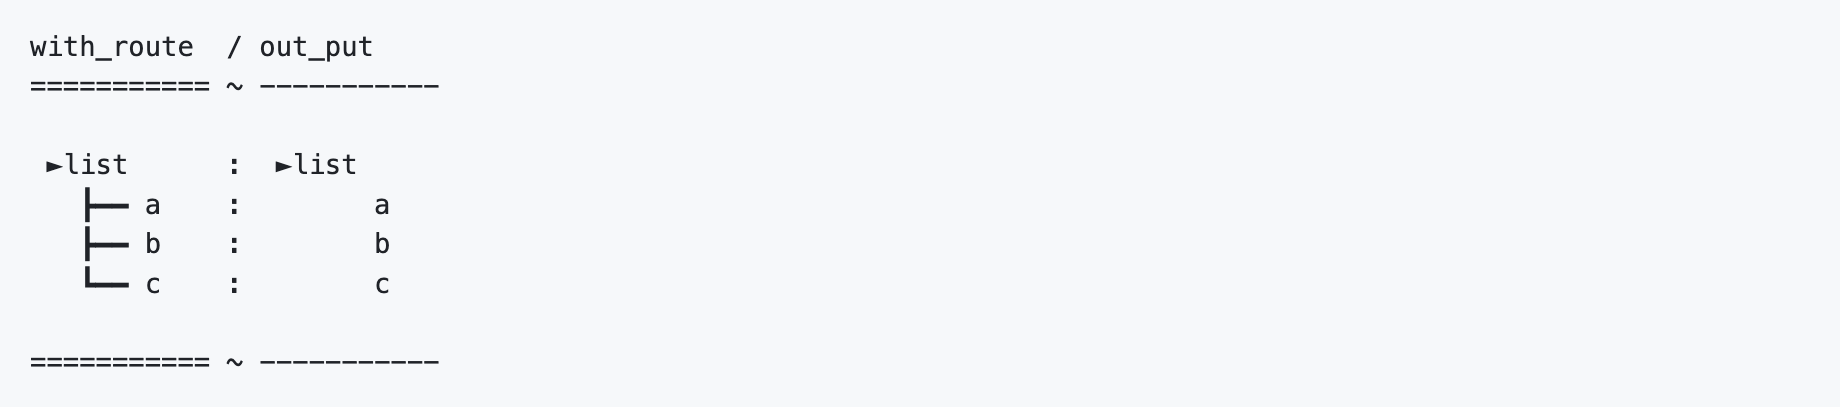
1.
yBehavior: Expands the specified dimension in the y direction.
Use Case: When you want to verify the order alignment of each element in the array.
Effect: Expanding in the y direction results in parallel arrays in the x direction.
-
Array Example
test_data = [
    'a','b','c'
]
-
Formatted Result
-
Setting Example
keep_settings = {1:'y'}
2.
xBehavior: Expands the specified dimension in the x direction.
Use Case:
- When you want to verify the dimensional alignment of each element in the array.
- For dimensions that need to have their order aligned with an array expanded using the 'y' setting.
- For dimensions that need to have their dimensions aligned with an array expanded using the 'x' setting.
- (Note: Arrays with mismatched dimensions are automatically expanded in the y direction.)
Effect: Expanding in the x direction results in parallel arrays in the y direction.
Details:
-
To verify the dimensional alignment of each element
-
Array Example
test_data = [
    'a','b','c'
]
-
Formatted Result
-
Setting Example
keep_settings = {1:'x'}
-
-
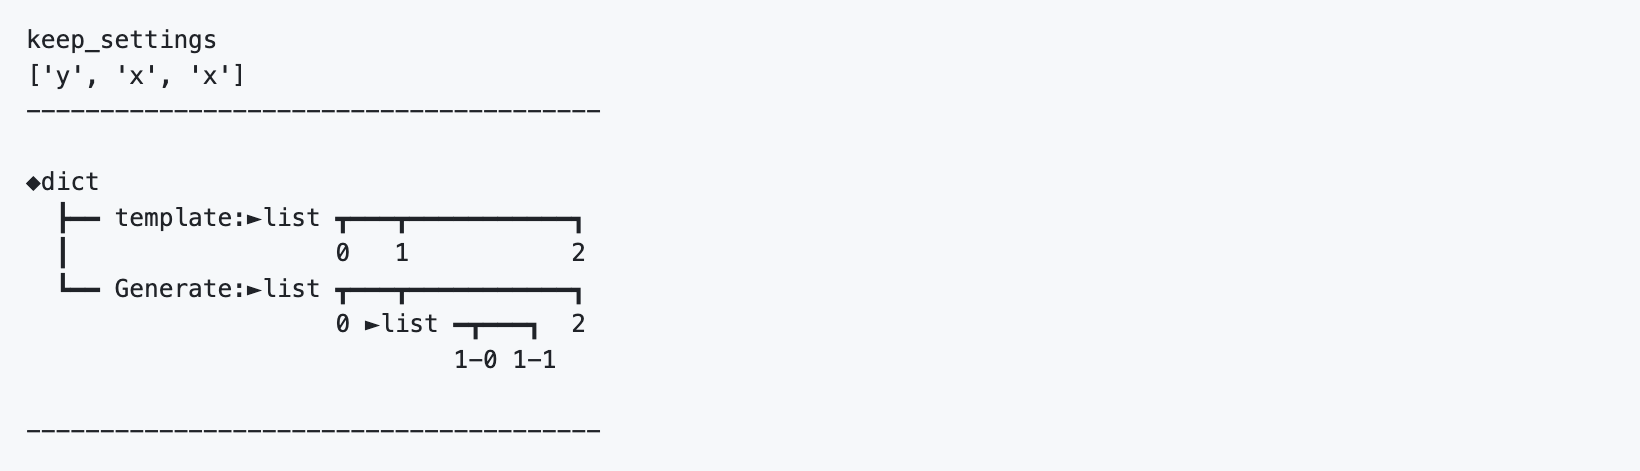
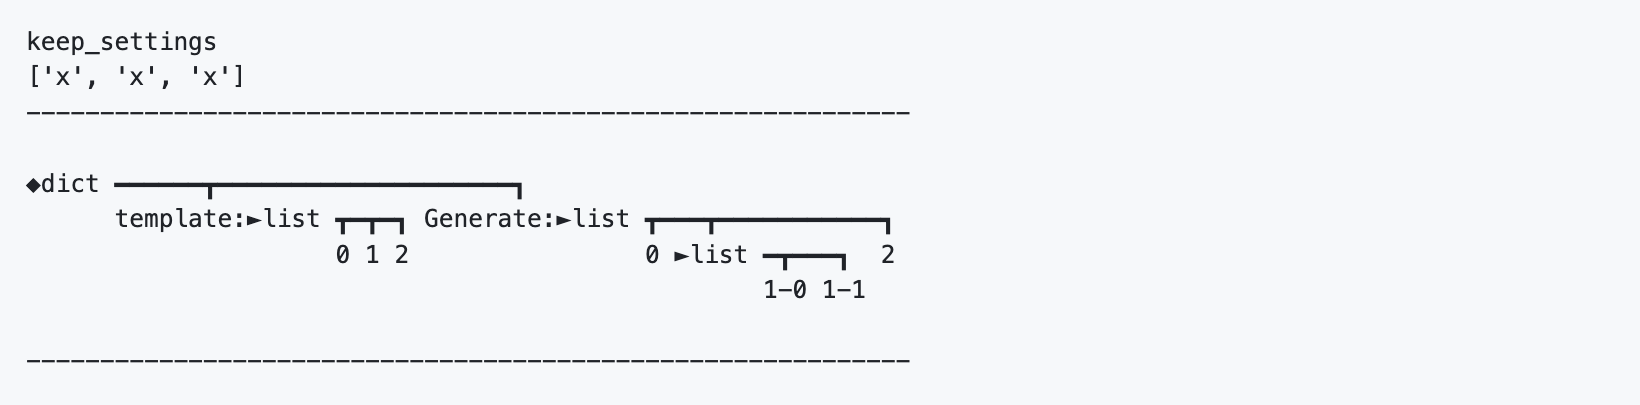
For dimensions (expanded with 'y') that need order alignment
-
Array Example
test_data = {
    'template':[0,1,2],
    'Generate':[0,['1-0','1-1'],2]
}
-
Formatted Result
-
Setting Example
keep_settings = {1:'y',2:'x'}
-
-
For dimensions (expanded with 'x') that need to verify dimensional alignment
-
Array Example
test_data = {
    'template':[0,1,2],
    'Generate':[0,['1-0','1-1'],2]
}
-
Formatted Result
-
Setting Example
keep_settings = {1:'x',2:'x'}
-
3.
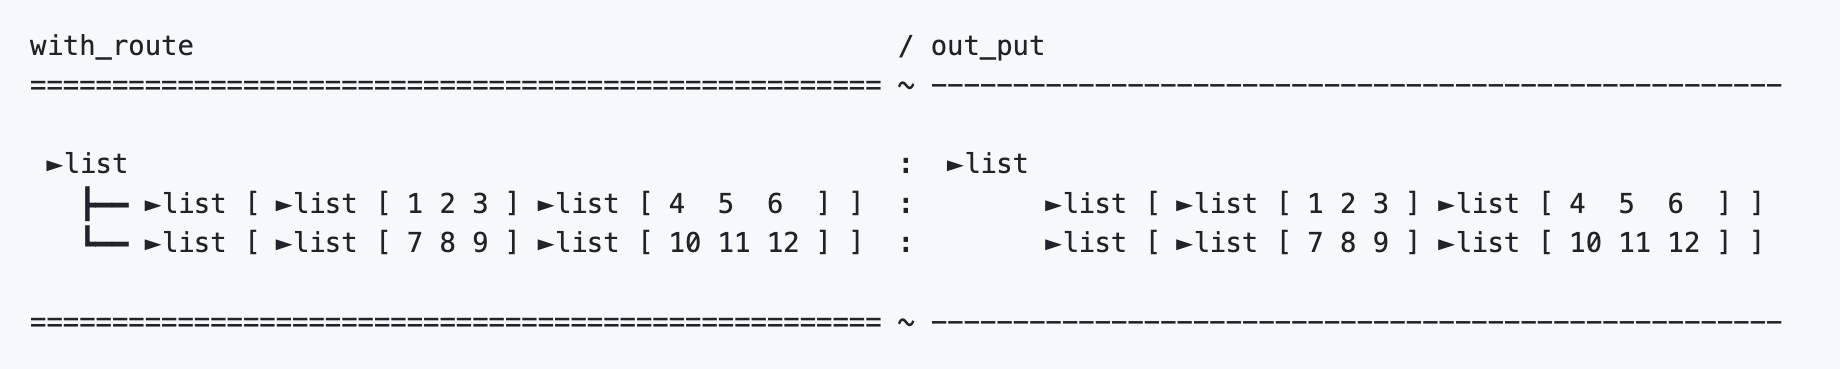
yf(y_flat)Behavior: Expands the specified dimension in the y direction and then displays subsequent dimensions on the same line as an expansion in the x direction.
Ideal for compactly formatting arrays with densely packed storage information, such as photo data.
Use Case: To display the array dimensions expanded in the y direction along with parallel arrays in the x direction—thereby concisely summarizing both order alignment (including missing elements) and dimensional alignment in a single row.
-
Array Example
test_data = [
    [[1,2,3], [4,5,6]],
    [[7,8,9], [10,11,12]]
]
-
Formatted Result
-
Setting Example
keep_settings = {1:'yf',2:'f',3:'f'}
-

[] Display/Hide y-Axis
For large outputs, an additional feature allows you to display or hide the y-axis to help grasp the order of the parallel arrays.
format_texts = list_data.set_collection(route=True, y_axis=True/False, keep_settings=keep_settings)
#                                                      ^^^^^^ ====:-----
[] Changing the Display Style
Currently, only the text image for array types can be modified.
-
Example Execution Template
'''
from demo_setprint_0_3_0 import SetPrint

# Specify the array you want to format
#                         ∨
list_data = SetPrint(datas)
'''

#----------------------------------------------------

style_settings = (
    ("Collections",
    { 'image': {
        'list': '►list',
        'tuple': '▷tuple',
        'ndarray': '>nadarray',
        'dict': '◆dict'
        }
    }
    ),
)

list_data.update_data_with_arguments(style_settings)

#----------------------------------------------------
"""
# Specify the expansion direction (detailed explanation follows)
#                         ∨
keep_settings = {1: 'x', 3: 'yf', 4: 'f'}

# Execute the formatting
format_texts = list_data.set_collection(route=True, keep_settings=keep_settings)

# Hide the output and write the result to a text file
with open('output.txt', 'w') as f:
    for line in format_texts:
        f.write(line + '\n')
"""


Download files
Download the file for your platform. If you're not sure which to choose, learn more about installing packages.
Source Distribution
Built Distribution
Filter files by name, interpreter, ABI, and platform.
If you're not sure about the file name format, learn more about wheel file names.
Copy a direct link to the current filters
File details
Details for the file setprint-0.3.1.tar.gz.
File metadata
- Download URL: setprint-0.3.1.tar.gz
- Upload date:
- Size: 20.8 kB
- Tags: Source
- Uploaded using Trusted Publishing? No
- Uploaded via: twine/5.1.1 CPython/3.12.7
File hashes
| Algorithm | Hash digest | |
|---|---|---|
| SHA256 |
c9aee8dac2a6fcdaedab06959d24a15b7038141ebb770e9511d1ff4994412896
|
|
| MD5 |
9464617da7fd07e8a31088e93216906c
|
|
| BLAKE2b-256 |
a6c7648c85e3b4e3b53b3807585c596b45a19b07ac1d471f4f216cc78f9671d0
|
File details
Details for the file setprint-0.3.1-py3-none-any.whl.
File metadata
- Download URL: setprint-0.3.1-py3-none-any.whl
- Upload date:
- Size: 15.9 kB
- Tags: Python 3
- Uploaded using Trusted Publishing? No
- Uploaded via: twine/5.1.1 CPython/3.12.7
File hashes
| Algorithm | Hash digest | |
|---|---|---|
| SHA256 |
4608a37f6acbae6681d8d9f4c95c5ccc27a3424641d956ca4325628fff8647c0
|
|
| MD5 |
1d780c592ef2f2fee30bfbe98e2685b2
|
|
| BLAKE2b-256 |
9cf057fe172697b9e5bd6316996b2a055a386a91ac5f5bf1e4cd20b88d47fb25
|






