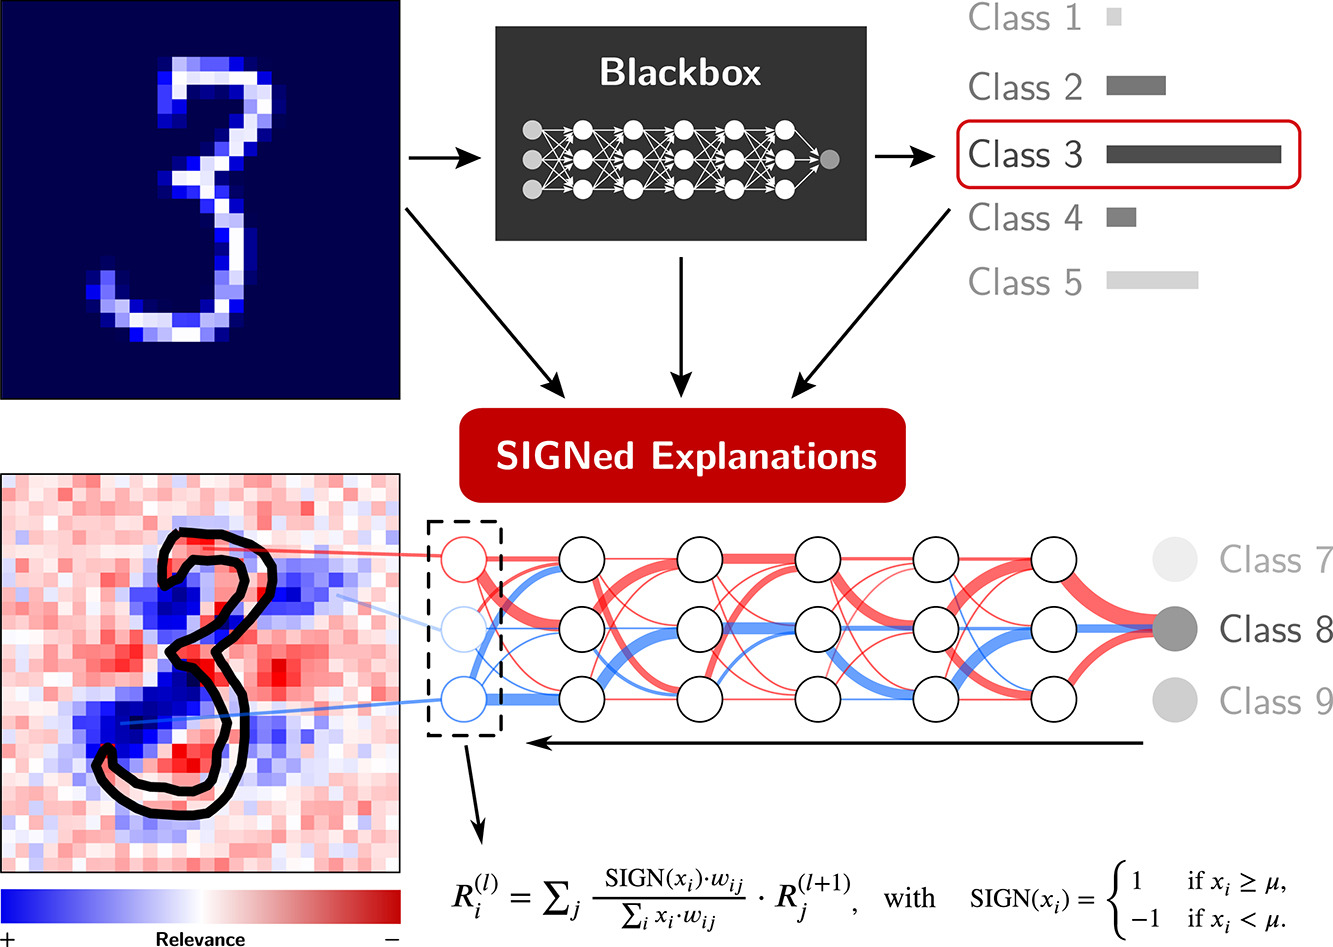
SIGNed explanations: Unveiling relevant features by reducing bias
Project description
SIGNed explanations: Unveiling relevant features by reducing bias
This repository and python package has been published alongside the following journal article: https://doi.org/10.1016/j.inffus.2023.101883
If you use the code from this repository in your work, please cite:
 @article{Gumpfer2023SIGN,
    title = {SIGNed explanations: Unveiling relevant features by reducing bias},
    author = {Nils Gumpfer and Joshua Prim and Till Keller and Bernhard Seeger and Michael Guckert and Jennifer Hannig},
    journal = {Information Fusion},
    pages = {101883},
    year = {2023},
    issn = {1566-2535},
    doi = {https://doi.org/10.1016/j.inffus.2023.101883},
    url = {https://www.sciencedirect.com/science/article/pii/S1566253523001999}
}

Setup
To install the package in your environment, run:
pip3 install signxai
Usage
VGG16
The below example illustrates the usage of the signxai package in combination with a VGG16 model trained on imagenet:
import numpy as np
import matplotlib.pyplot as plt
from tensorflow.keras.applications.vgg16 import VGG16
from signxai.methods.wrappers import calculate_relevancemap
from signxai.utils.utils import (load_image, aggregate_and_normalize_relevancemap_rgb, download_image,
                                 calculate_explanation_innvestigate)

# Load model
model = VGG16(weights='imagenet')

#  Remove last layer's softmax activation (we need the raw values!)
model.layers[-1].activation = None

# Load example image
path = 'example.jpg'
download_image(path)
img, x = load_image(path)

# Calculate relevancemaps
R1 = calculate_relevancemap('lrpz_epsilon_0_1_std_x', np.array(x), model)
R2 = calculate_relevancemap('lrpsign_epsilon_0_1_std_x', np.array(x), model)

# Equivalent relevance maps as for R1 and R2, but with direct access to innvestigate and parameters
R3 = calculate_explanation_innvestigate(model, x, method='lrp.stdxepsilon', stdfactor=0.1, input_layer_rule='Z')
R4 = calculate_explanation_innvestigate(model, x, method='lrp.stdxepsilon', stdfactor=0.1, input_layer_rule='SIGN')

# Visualize heatmaps
fig, axs = plt.subplots(ncols=3, nrows=2, figsize=(18, 12))
axs[0][0].imshow(img)
axs[1][0].imshow(img)
axs[0][1].matshow(aggregate_and_normalize_relevancemap_rgb(R1), cmap='seismic', clim=(-1, 1))
axs[0][2].matshow(aggregate_and_normalize_relevancemap_rgb(R2), cmap='seismic', clim=(-1, 1))
axs[1][1].matshow(aggregate_and_normalize_relevancemap_rgb(R3), cmap='seismic', clim=(-1, 1))
axs[1][2].matshow(aggregate_and_normalize_relevancemap_rgb(R4), cmap='seismic', clim=(-1, 1))

plt.show()
(Image credit for example used in this code: Greg Gjerdingen from Willmar, USA)
MNIST
The below example illustrates the usage of the signxai package in combination with a dense model trained on MNIST:
import numpy as np
from matplotlib import pyplot as plt
from tensorflow.python.keras.datasets import mnist
from tensorflow.python.keras.models import load_model

from signxai.methods.wrappers import calculate_relevancemap
from signxai.utils.utils import normalize_heatmap, download_model

# Load train and test data
(x_train, y_train), (x_test, y_test) = mnist.load_data()

# Scale images to the [-1, 0] range
x_train = x_train.astype("float32") / -255.0
x_test = x_test.astype("float32") / -255.0
x_train = -(np.ones_like(x_train) + x_train)
x_test = -(np.ones_like(x_test) + x_test)

# Load model
path = 'model.h5'
download_model(path)
model = load_model(path)

# Remove softmax
model.layers[-1].activation = None

# Calculate relevancemaps
x = x_test[231]
R1 = calculate_relevancemap('gradient_x_input', np.array(x), model, neuron_selection=3)
R2 = calculate_relevancemap('gradient_x_sign_mu_neg_0_5', np.array(x), model, neuron_selection=3)
R3 = calculate_relevancemap('gradient_x_input', np.array(x), model, neuron_selection=8)
R4 = calculate_relevancemap('gradient_x_sign_mu_neg_0_5', np.array(x), model, neuron_selection=8)

# Visualize heatmaps
fig, axs = plt.subplots(ncols=3, nrows=2, figsize=(18, 12))
axs[0][0].imshow(x, cmap='seismic', clim=(-1, 1))
axs[1][0].imshow(x, cmap='seismic', clim=(-1, 1))
axs[0][1].matshow(normalize_heatmap(R1), cmap='seismic', clim=(-1, 1))
axs[0][2].matshow(normalize_heatmap(R2), cmap='seismic', clim=(-1, 1))
axs[1][1].matshow(normalize_heatmap(R3), cmap='seismic', clim=(-1, 1))
axs[1][2].matshow(normalize_heatmap(R4), cmap='seismic', clim=(-1, 1))

plt.show()
Experiments
To reproduce the experiments from our paper, please find a detailed description on https://github.com/nilsgumpfer/SIGN.
Project details
Release history Release notifications | RSS feed
Download files
Download the file for your platform. If you're not sure which to choose, learn more about installing packages.


