
spec2flux




Table of Contents
About spec2flux
Spec2flux (Spectrum to Flux) accurately calculates emission line flux in the Far Ultraviolet (FUV) range. These measurements provide critical insights into FUV radiation from exoplanet host stars, helping researchers understand exoplanetary atmospheres. When integrated with X-ray data, these measurements allow estimation of stellar corona properties.
How It Works
The script performs flux calculations through the following steps:
- Emission Line Grouping: Groups emission lines using a configurable tolerance
- Doppler Shift Calculation: Fits composite Voigt profiles to strong emission lines and calculates Doppler shift
- Flux Calculation: Processes each line, filtering noise, and calculating flux using either Voigt profiles or raw data
- Results Generation: Creates publication-ready plots and exports calculations as FITS and ECSV files
Installation
pip install spec2flux
Configuration
Spec2flux uses two configuration dictionaries to control its behavior:
SPECTRUM_CONFIG
SPECTRUM_CONFIG = {
    'spectrum_dir': 'spectrum-file.fits',       # Path to spectrum FITS file
    'rest_dir': 'DEM_goodlinelist.csv',         # Path to emission line REST file
    'airglow_dir': 'airglow.csv',               # Path to airglow CSV file
    'observation': 'sci',                       # Observation type ('sci' only)
    'telescope': 'hst',                         # Telescope used ('hst' only)
    'instrument': 'stis',                       # Instrument ('stis' or 'cos')
    'grating': 'e140m',                         # Grating type (must contain 'L' or 'M')
    'resolution': 'high',                       # Resolution ('high' or 'low')
    'star_name': 'STAR_NAME',                   # Target star name (used for output files)
    'min_wavelength': 1160,                     # Minimum wavelength for analysis
    'max_wavelength': 1700                      # Maximum wavelength for analysis
}
ANALYSIS_CONFIG
ANALYSIS_CONFIG = {
    'apply_smoothing': False,                   # Apply gaussian smoothing
    'line_fit_model': 'Voigt',                  # Fitting model ('Voigt' or 'Gaussian')
    'cont_fit': 'Individual',                   # Continuum fit method ('Complete' or 'Individual')
    'fresh_start': True                         # True for first run or to regenerate plots
}
Usage
Create a main.py file that uses the spec2flux toolkit:
import spec2flux
from config import SPECTRUM_CONFIG, ANALYSIS_CONFIG

def main():
    # Check inputs
    spec2flux.InputCheck(SPECTRUM_CONFIG, ANALYSIS_CONFIG)

    # Load spectrum data and emission lines
    spectrum = spec2flux.SpectrumData(SPECTRUM_CONFIG, ANALYSIS_CONFIG)
    emission_lines = spec2flux.EmissionLines(spectrum)

    if ANALYSIS_CONFIG['fresh_start']:
        # Initialize plotter
        plotter = spec2flux.Plotter(spectrum, emission_lines)

        # Calculate doppler shift
        plotter.doppler_plots()
        emission_lines.update_selected_lines(plotter, 'Doppler')

        doppler_calculator = spec2flux.DopplerCalculator(spectrum)
        spectrum.doppler_shift = doppler_calculator.calculate_doppler_shift(emission_lines)

        # Handle noise detection
        plotter.noise_plots()
        emission_lines.update_selected_lines(plotter, 'Noise')

        # Calculate fluxes
        flux_calculator = spec2flux.FluxCalculator(spectrum, emission_lines, plotter)
        flux_calculator.process_spectrum()
    else:
        # Load existing data
        emission_lines.load_saved_data()

    # Final plot
    plotter = spec2flux.Plotter(spectrum, emission_lines)
    plotter.create_final_plot()

if __name__ == '__main__':
    main()
Create a config.py file with your configuration settings (see Configuration section).
Your project directory should be organized as follows:
project-directory/
├── main.py
├── config.py
├── DEM_goodlinelist.csv
├── airglow.csv
├── spectrum.fits
Run your analysis:
python main.py
Interactive Analysis Workflow
Click to expand interactive workflow details
1. Doppler Shift Candidate Selection
When the script runs, you'll first be presented with a spectrum plot for selecting Doppler shift candidates:
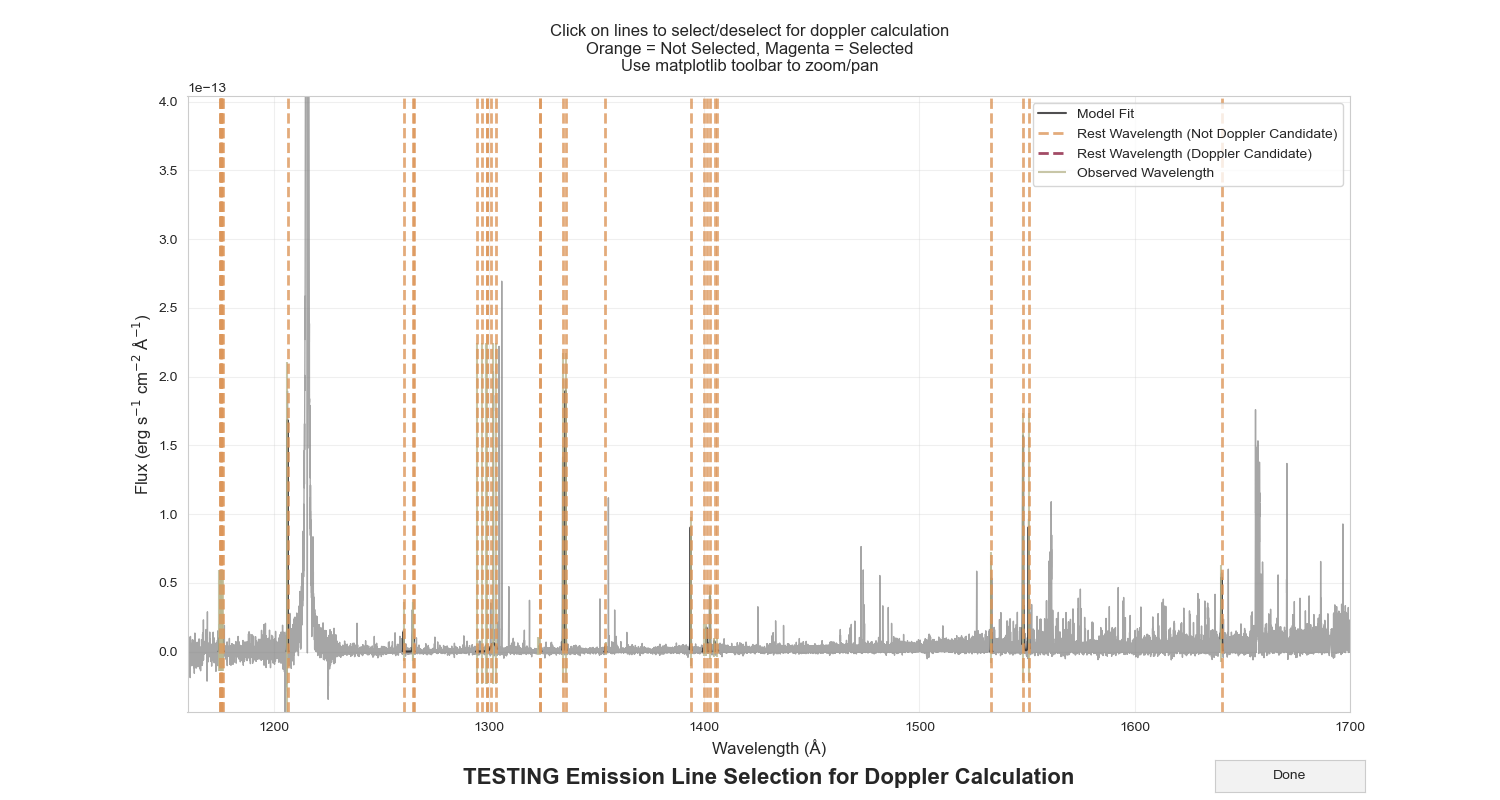
Steps:
- Use the zoom button to inspect potential candidates (orange lines)
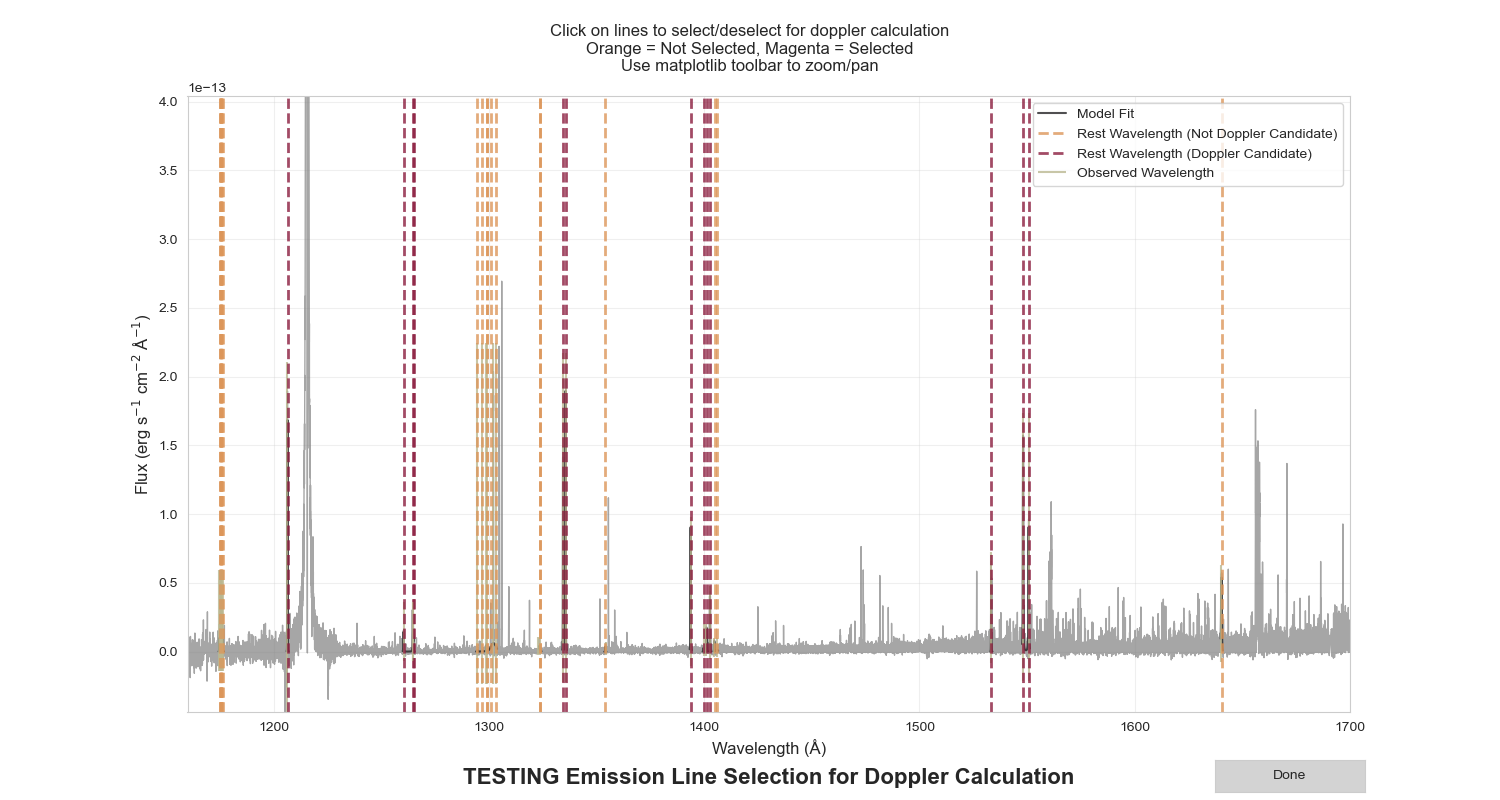
- Click on good candidates to select them (they will turn magenta) zoom button must be unclicked to select!
- Use the home button to return to the full spectrum view
- Click "Done" when you've selected all suitable Doppler candidates
2. Emission Line Selection
After Doppler selection, you'll see the spectrum with potential emission line candidates:
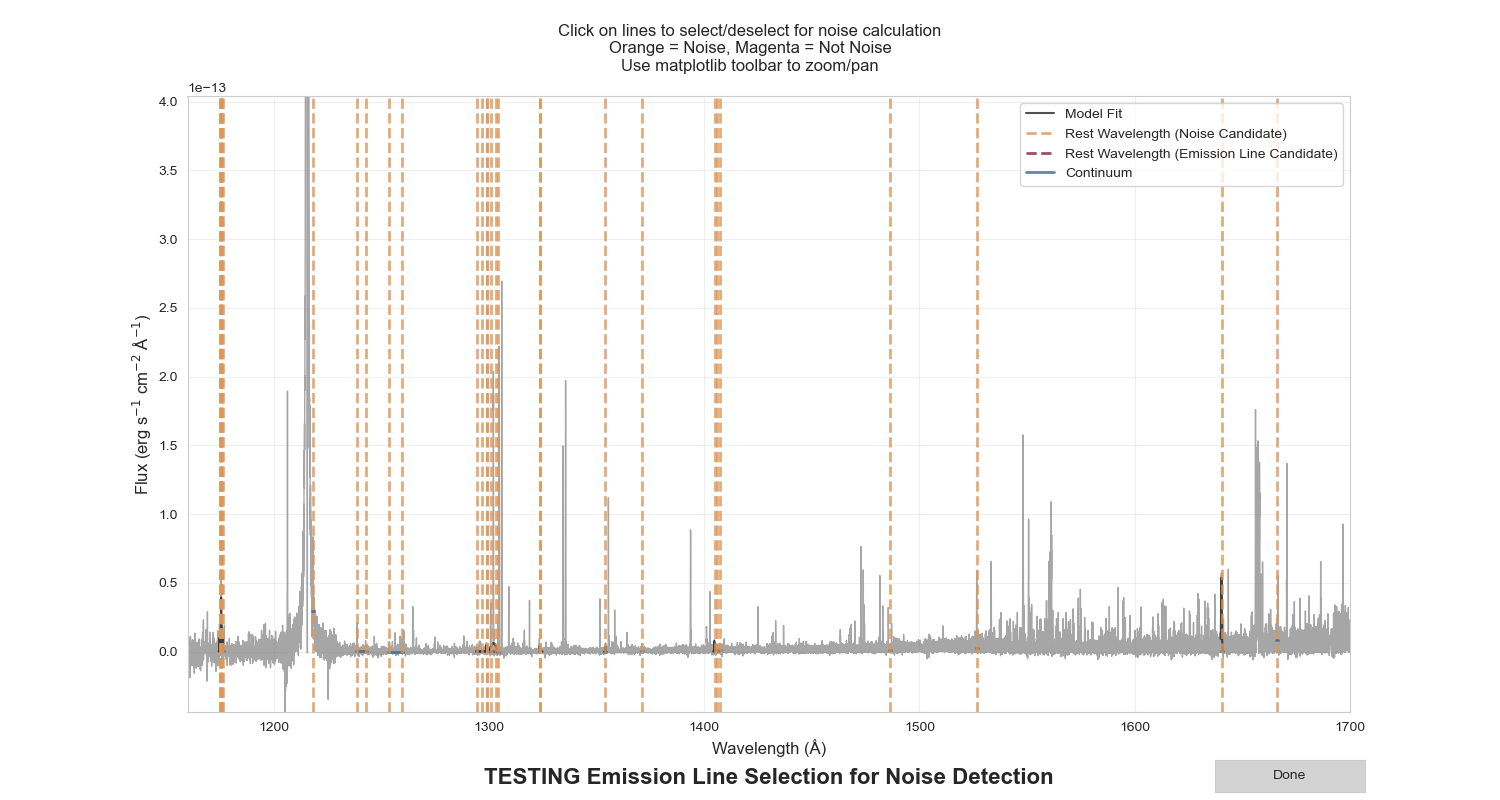
Steps:
- Use the zoom button to inspect orange emission line candidates
- Click on real emission lines to select them (they will turn magenta)
- Leave noise as orange
- Click "Done" when you've identified all emission lines
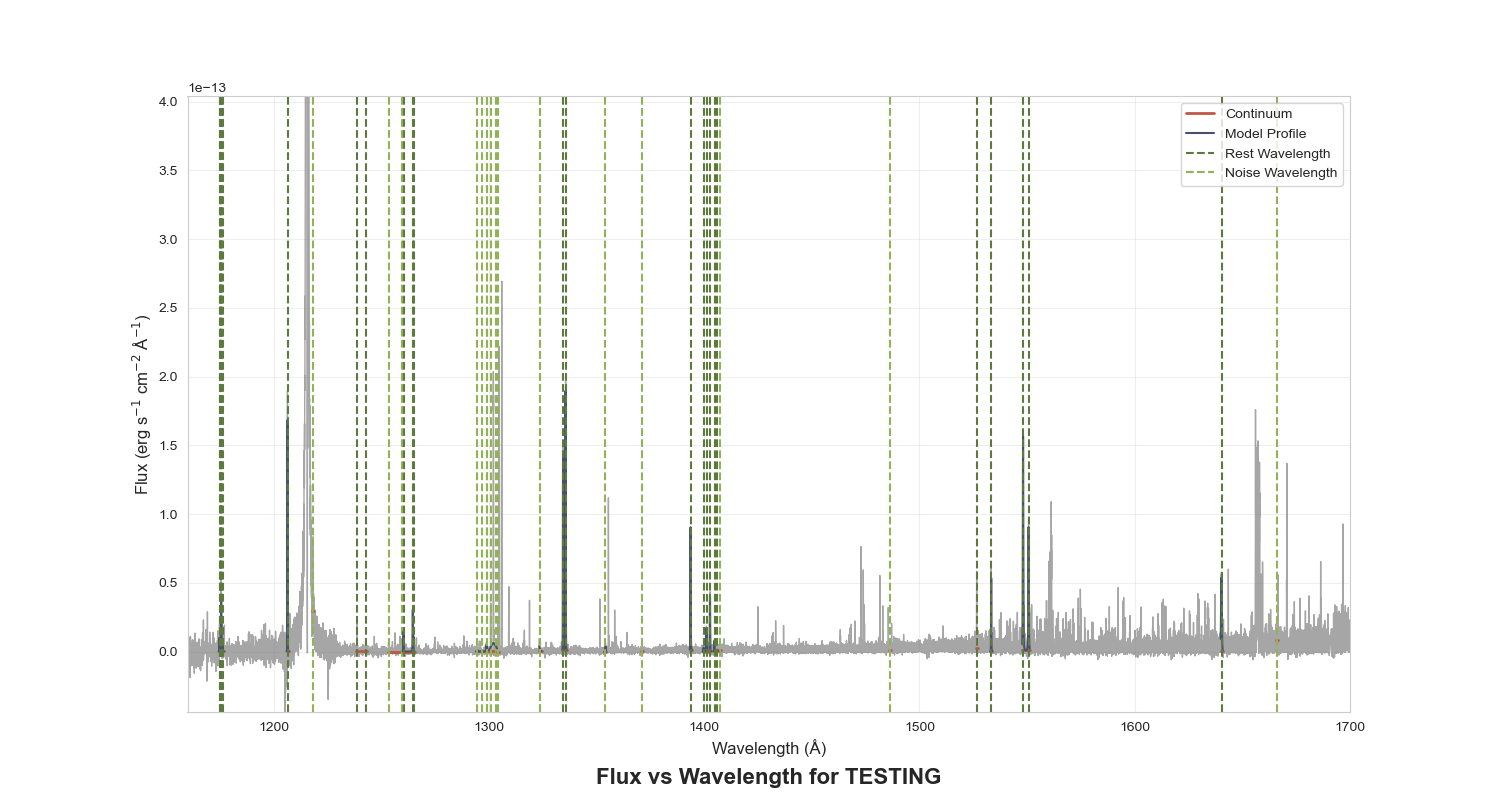
3. Final Results
After completing the selection process, a final plot will be generated showing the full spectrum with the continuum, profile fits, and marked wavelengths:
Output Files
After running the analysis, your directory will contain new files organized as follows:
project-directory/
├── ... (original files)
├── doppler/
│   ├── star_name_doppler.txt           # Doppler shift calculation results
├── emission_lines/
│   ├── star_name_lines.json            # Detailed emission line data
├── flux/
│   ├── star_name.csv                   # Flux calculations (CSV format)
│   ├── star_name.ecsv                  # Flux calculations (ECSV format)
│   ├── star_name.fits                  # Flux calculations (FITS format)
├── plots/
│   ├── star_name_final_plot.png        # Final spectrum plot with all components
Output Data Format
The output files contain the following information:
Header Information
DATE: Date flux was calculatedFILENAME: Name of the FITS file used for flux calculationTELESCP: Telescope used to measure spectrumINSTRMNT: Active instrument used to measure spectrumGRATING: Grating used to measure spectrumTARGNAME: Name of target starDOPPLER: Doppler shift used to measure fluxWIDTH: Average peak width of emission linesRANGE: Flux range used to isolate emission lineWIDTHPXL: Average emission line peak width in pixelsUPPRLIMIT: Upper limit used for noise (3*error)
Data Columns
Ion: Ion identifierRest Wavelength: Rest wavelength of the emission lineFlux: Calculated flux valueError: Error estimate for the fluxBlended Line: Boolean flag indicating blended lines
Note: Noise is marked with the negative of the upper limit (3*error) as the flux and an error of 0.
1 maintainer

Metadata
1 maintainer
Release files for spec2flux 1.0.0
For a detailed explanation of source distributions (sdists) and built distributions (wheels), please see the package formats documentation.
Source distribution (sdist)
| File | Size | Uploaded | |
|---|---|---|---|
| spec2flux-1.0.0.tar.gz | 1.1 MB | Details |
Built distribution (wheel)
| File | Interpreter | ABI | Platform | Reset |
|---|---|---|---|---|
| spec2flux-1.0.0-py3-none-any.whl | Python 3 | none | any | Details |
Total release size: 1.1 MB
Release files / spec2flux-1.0.0.tar.gz
| Download URL | spec2flux-1.0.0.tar.gz |
|---|---|
| Size | 1.1 MB |
| Tags | Source |
|
SHA-256 checksum How to use checksums |
537f0e44ec0511fa0e80ebaa09cf7231c145388b09fb4e37ff28eac621f47713
|
|
BLAKE2b-256 checksum How to use checksums |
4b771e904277462f1d7a2f74b0e6e4f45ece4bf59ba706e30b9677f82da50a5f
|
| Upload date | |
|
Uploaded using Trusted Publishing? What is trusted publishing? |
No |
| Uploaded via |
twine/5.1.1 CPython/3.11.5
|
Release files / spec2flux-1.0.0-py3-none-any.whl
| Download URL | spec2flux-1.0.0-py3-none-any.whl |
|---|---|
| Size | 26.2 kB |
| Tags | Python 3 |
|
SHA-256 checksum How to use checksums |
5676232dcb0a0a7dc493f1bad991b3e3ddca816e3c1276ba434210470a85280f
|
|
BLAKE2b-256 checksum How to use checksums |
2f3ee3715ac30d4ee28ecbc3bc9801171304b298429a66a0d68bdc92f2d5c653
|
| Upload date | |
|
Uploaded using Trusted Publishing? What is trusted publishing? |
No |
| Uploaded via |
twine/5.1.1 CPython/3.11.5
|














