
Sprintify Navigation
A navigation widget for PySide6 that handles large datasets efficiently. Built for interactive time-series visualization, Gantt charts, stock data, heatmaps - anything that needs smooth pan/zoom.
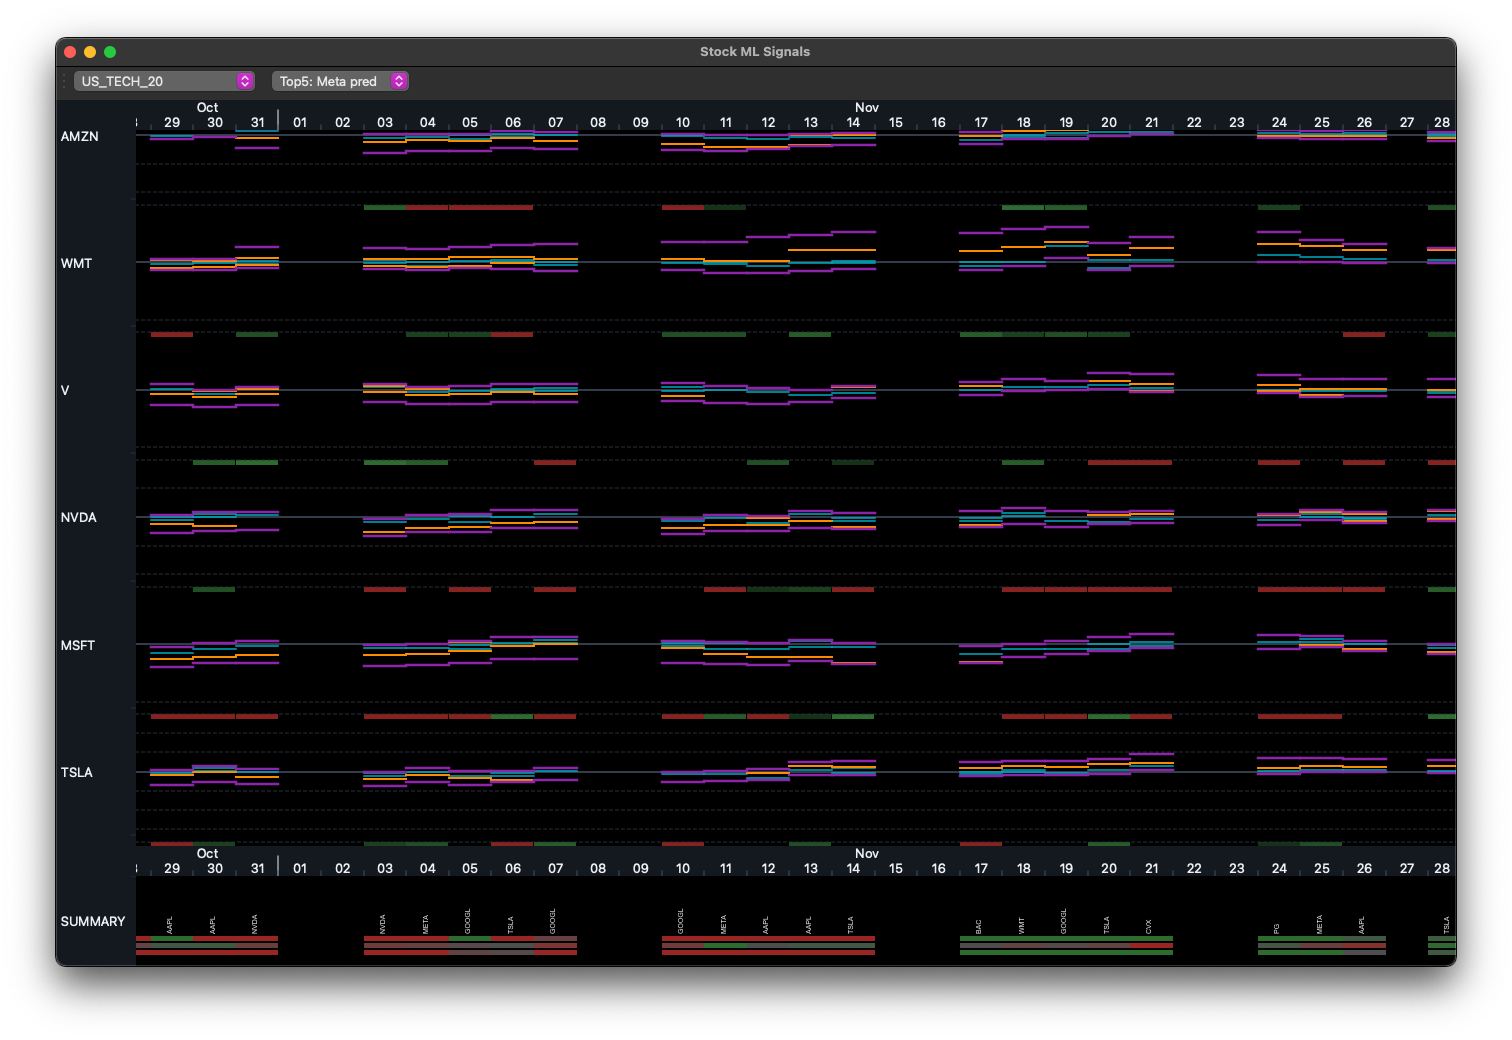
- A toolbox to build specialized interactive navigation UIs
- Easy to understand for AIs and humans
- Built for time-series, Gantt charts, stock data, heatmaps, scatter plots, and more
- Smooth pan/zoom with mouse wheel and drag
- Renders only visible data (handles millions of points)
- Dark/light mode through ColorMap
- Mouse wheel pan/zoom, click-drag pan
- Simple drawing API for rects, lines, text, or custom QPainter
Get started
pip install sprintify-navigation
Basic usage:
from sprintify.navigation.colors.modes import ColorMap
from sprintify.navigation.rulers import TimelineRuler, NumberRuler
from sprintify.navigation.navigation_widget import NavigationWidget
from PySide6.QtWidgets import QMainWindow, QApplication
from PySide6.QtGui import QBrush, QPen
from datetime import datetime, timedelta


class MyWindow(QMainWindow):
    def __init__(self):
        super().__init__()
        self.color_map = ColorMap(darkmode=True)

        # Setup rulers
        self.h_ruler = TimelineRuler(datetime(2024, 1, 1), datetime(2024, 12, 31))
        self.v_ruler = NumberRuler(0, 100, reverse=True)

        # Create widget
        self.widget = NavigationWidget(self.h_ruler, self.v_ruler, self.color_map)
        self.setCentralWidget(self.widget)

        # Draw stuff
        blue = self.color_map.get_saturated_color("blue", "fill")
        self.widget.draw_rects(
            "my_rects",
            lambda: [
                (datetime(2024, 3, 1), 20, timedelta(days=30), 15),
                (datetime(2024, 6, 1), 50, timedelta(days=45), 20),
            ],
            brush=QBrush(blue)
        )


if __name__ == "__main__":
    app = QApplication([])
    window = MyWindow()
    window.show()
    app.exec()
Examples
Check the examples/ folder for complete working apps:
Stock App
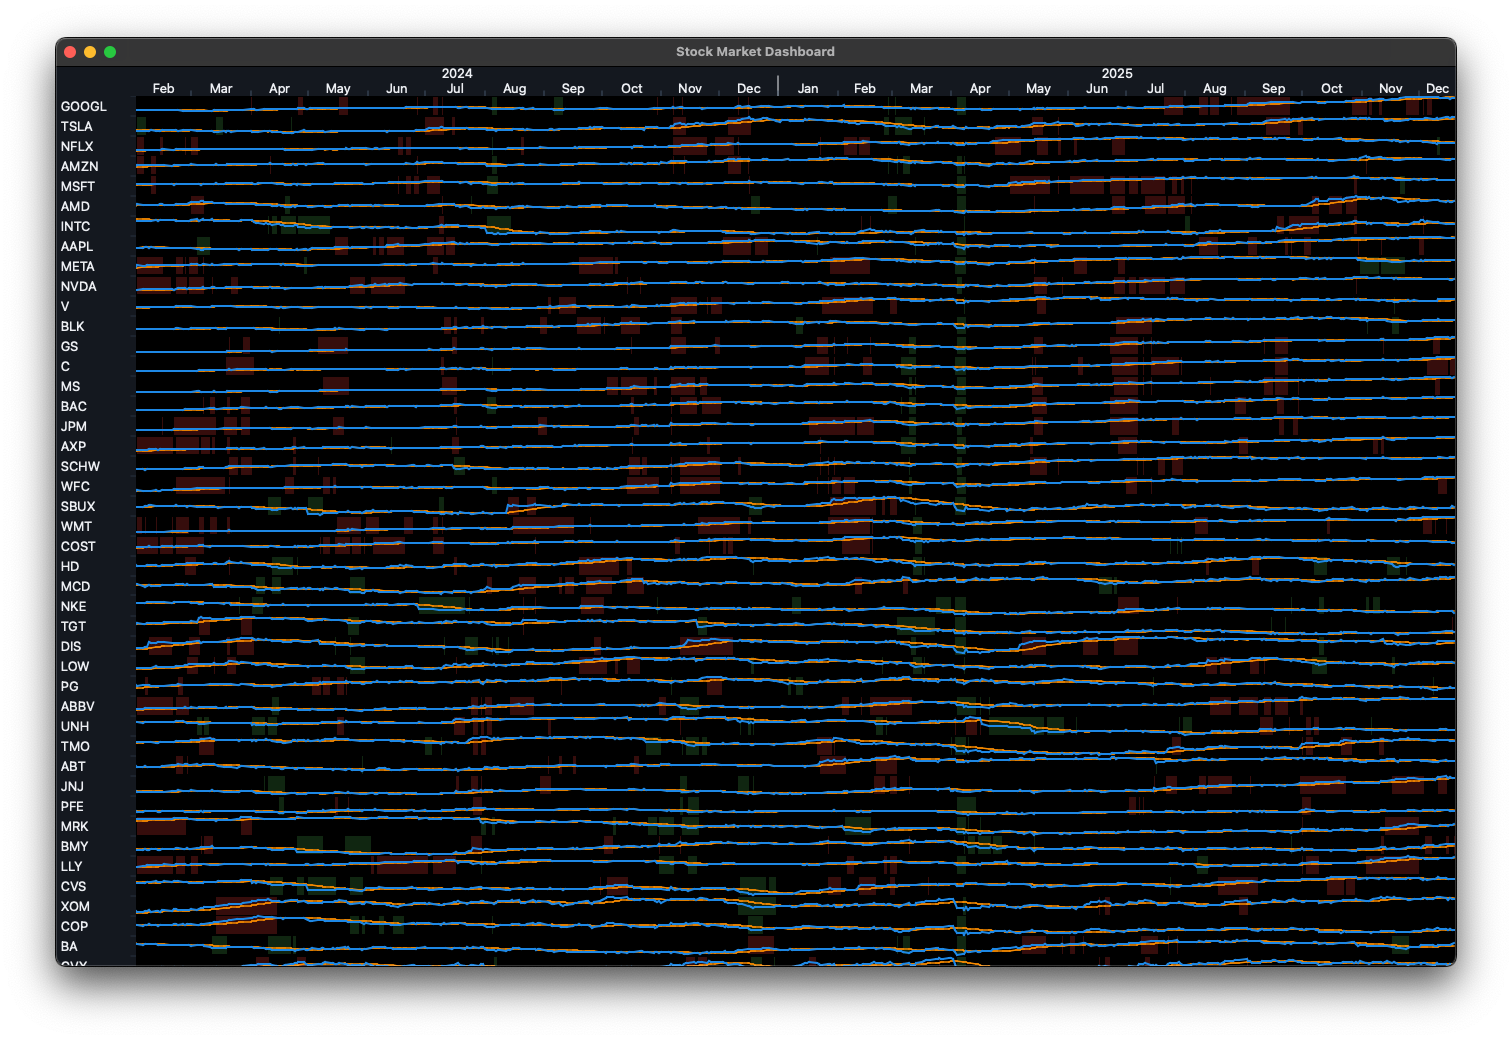
stock_app.py - Real stock data via yfinance.
Scheduling App
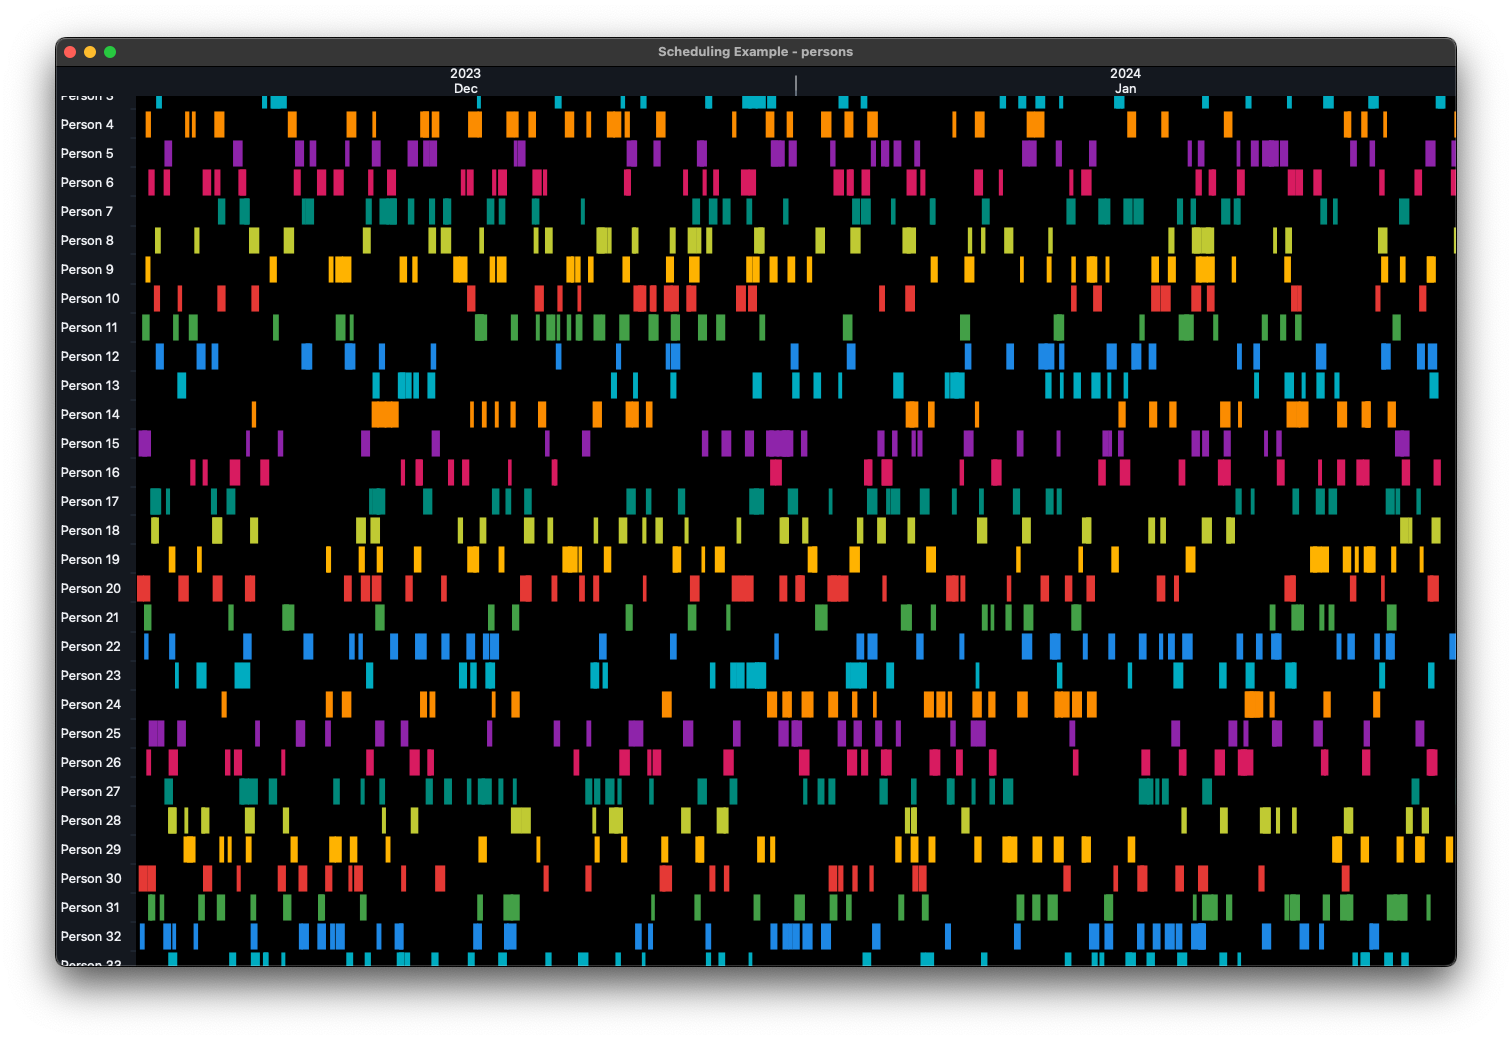
scheduling_app.py - Employee shifts (200 people, ItemRuler usage).
Sales Heatmap App
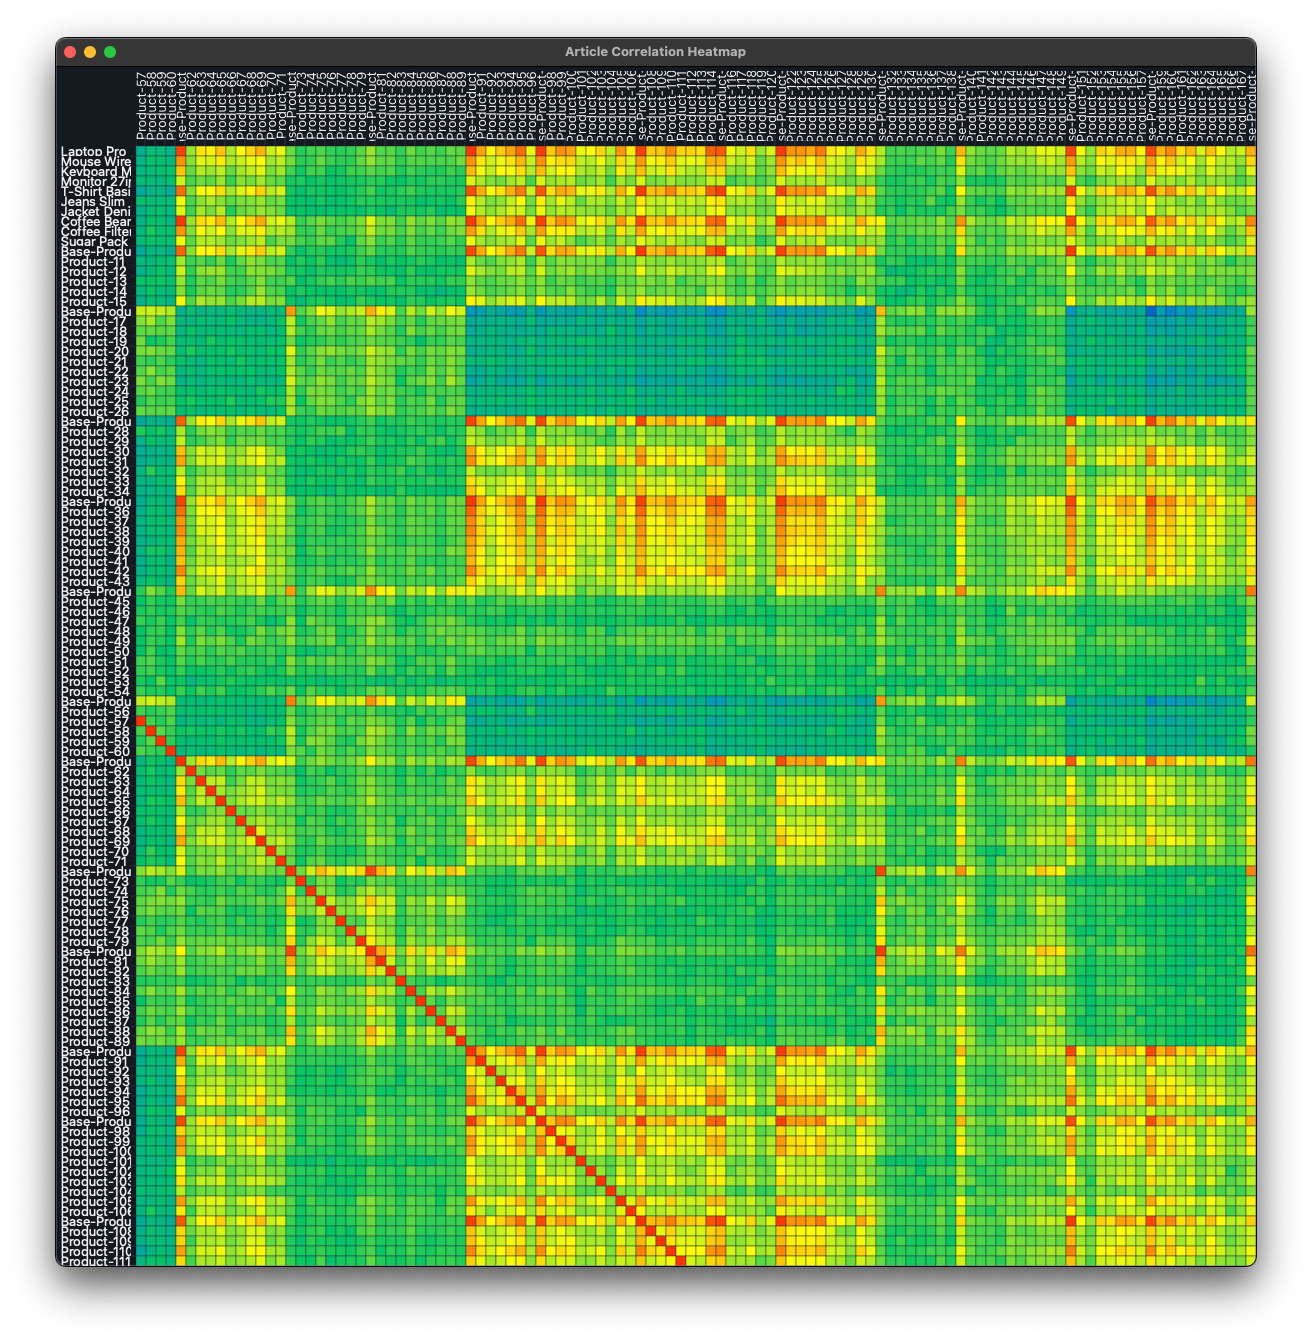
sales_heatmap_app.py - Sales correlation between products (ItemRuler x ItemRuler).
Navigation App
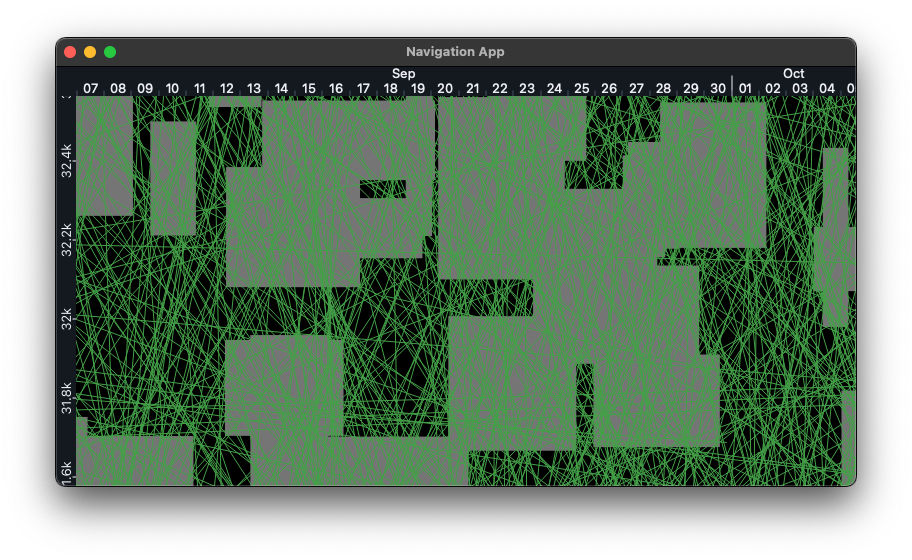
navigation_app.py - Random lines and Squares
Rulers
TimelineRuler
Date/time on horizontal axis. Auto-formats years/months/days/hours depending on zoom.
ruler = TimelineRuler(datetime(2024, 1, 1), datetime(2024, 12, 31))
NumberRuler
Numeric axis with SI units (k, M, G, etc). Can reverse for top-to-bottom.
ruler = NumberRuler(0, 10000, reverse=False)
ItemRuler
Categorical data - one band per item (employees, stocks, products, etc).
ruler = ItemRuler(
    item_count=100,
    default_pixels_per_item=40,
    min_pixels_per_item=20,
    max_pixels_per_item=150
)
Drawing
Rectangles
widget.draw_rects("layer_name", get_rects_func, brush=QBrush(color), pen=QPen(border))
# get_rects_func returns [(x, y, width, height), ...]
Lines
widget.draw_lines("layer_name", get_lines_func, pen=QPen(color, width))
# get_lines_func returns [(x1, y1, x2, y2), ...]
Text
widget.draw_texts("layer_name", get_texts_func, pen=QPen(color), font=QFont("Arial", 12))
# get_texts_func returns [(text, x, y), ...]
Custom drawing
def my_draw(painter):
    painter.setPen(QPen(Qt.red, 2))
    painter.drawEllipse(x, y, w, h)

widget.add_draw_command("custom", my_draw)
Colors
ColorMap handles theming:
color_map = ColorMap(darkmode=True)

# UI colors
bg = color_map.get_object_color("surface-base")
border = color_map.get_object_color("border")
text = color_map.get_object_color("text-base")

# Data viz colors
red = color_map.get_saturated_color("red", "fill")
blue = color_map.get_saturated_color("blue", "border")
Available: red, green, blue, cyan, orange, purple, pink, teal, lime, amber, grey
Controls
- Wheel: Pan horizontal/vertical
- Ctrl+Wheel: Zoom at mouse position
- Alt+Wheel: Zoom vertical axis (NumberRuler only)
- Click+Drag: Pan both axes
Performance tips
Only fetch visible data:
def get_visible_rects():
    start = self.h_ruler.visible_start
    end = self.h_ruler.visible_stop

    return [
        (x, y, w, h)
        for x, y, w, h in all_data
        if x + w >= start and x <= end
    ]

widget.draw_rects("rects", get_visible_rects, brush=QBrush(color))
Custom labels
ruler = ItemRuler(item_count=50)
widget = NavigationWidget(h_ruler, ruler, color_map)
widget.left_ruler_widget.get_label = lambda i: f"Employee {i+1}"
Ruler combinations
Mix rulers for different visualizations:
# Gantt chart
NavigationWidget(TimelineRuler(...), ItemRuler(...), color_map)

# Stock chart
NavigationWidget(TimelineRuler(...), NumberRuler(...), color_map)

# Correlation matrix
NavigationWidget(ItemRuler(...), ItemRuler(...), color_map)

# Scatter plot
NavigationWidget(NumberRuler(...), NumberRuler(...), color_map)
Architecture
Simple model-view split:
- Rulers: Handle coordinate transforms, zoom, pan math
- RulerWidgets: Render ticks/labels, handle mouse events
- DrawingWidget: Canvas for data visualization
- NavigationWidget: Composite putting it all together
Requirements
- Python 3.8+
- PySide6
- yfinance (optional, only for stock example)
License
MIT
1 maintainer

Release files for sprintify-navigation 1.0.15
For a detailed explanation of source distributions (sdists) and built distributions (wheels), please see the package formats documentation.
Source distribution (sdist)
| File | Size | Uploaded | |
|---|---|---|---|
| sprintify_navigation-1.0.15.tar.gz | 33.5 kB | Details |
Built distribution (wheel)
| File | Interpreter | ABI | Platform | Reset |
|---|---|---|---|---|
| sprintify_navigation-1.0.15-py3-none-any.whl | Python 3 | none | any | Details |
Total release size: 70.9 kB














