A navigation widget based on PySide6

Project description
Sprintify Navigation
A navigation widget for PySide6 that handles large datasets efficiently. Built for interactive time-series visualization, Gantt charts, stock data, heatmaps - anything that needs smooth pan/zoom.
- A toolbox to build specialized interactive navigation UIs
- Easy to understand for AIs and humans
- Built for time-series, Gantt charts, stock data, heatmaps, scatter plots, and more
- Smooth pan/zoom with mouse wheel and drag
- Renders only visible data (handles millions of points)
- Dark/light mode through ColorMap
- Mouse wheel pan/zoom, click-drag pan
- Simple drawing API for rects, lines, text, or custom QPainter
Get started
pip install sprintify-navigation
Basic usage:
from sprintify.navigation.colors.modes import ColorMap
from sprintify.navigation.rulers import TimelineRuler, NumberRuler
from sprintify.navigation.navigation_widget import NavigationWidget
from PySide6.QtWidgets import QMainWindow, QApplication
from PySide6.QtGui import QBrush, QPen
from datetime import datetime, timedelta


class MyWindow(QMainWindow):
    def __init__(self):
        super().__init__()
        self.color_map = ColorMap(darkmode=True)

        # Setup rulers
        self.h_ruler = TimelineRuler(datetime(2024, 1, 1), datetime(2024, 12, 31))
        self.v_ruler = NumberRuler(0, 100, reverse=True)

        # Create widget
        self.widget = NavigationWidget(self.h_ruler, self.v_ruler, self.color_map)
        self.setCentralWidget(self.widget)

        # Draw stuff
        blue = self.color_map.get_saturated_color("blue", "fill")
        self.widget.draw_rects(
            "my_rects",
            lambda: [
                (datetime(2024, 3, 1), 20, timedelta(days=30), 15),
                (datetime(2024, 6, 1), 50, timedelta(days=45), 20),
            ],
            brush=QBrush(blue)
        )


if __name__ == "__main__":
    app = QApplication([])
    window = MyWindow()
    window.show()
    app.exec()
Examples
Check the examples/ folder for complete working apps:
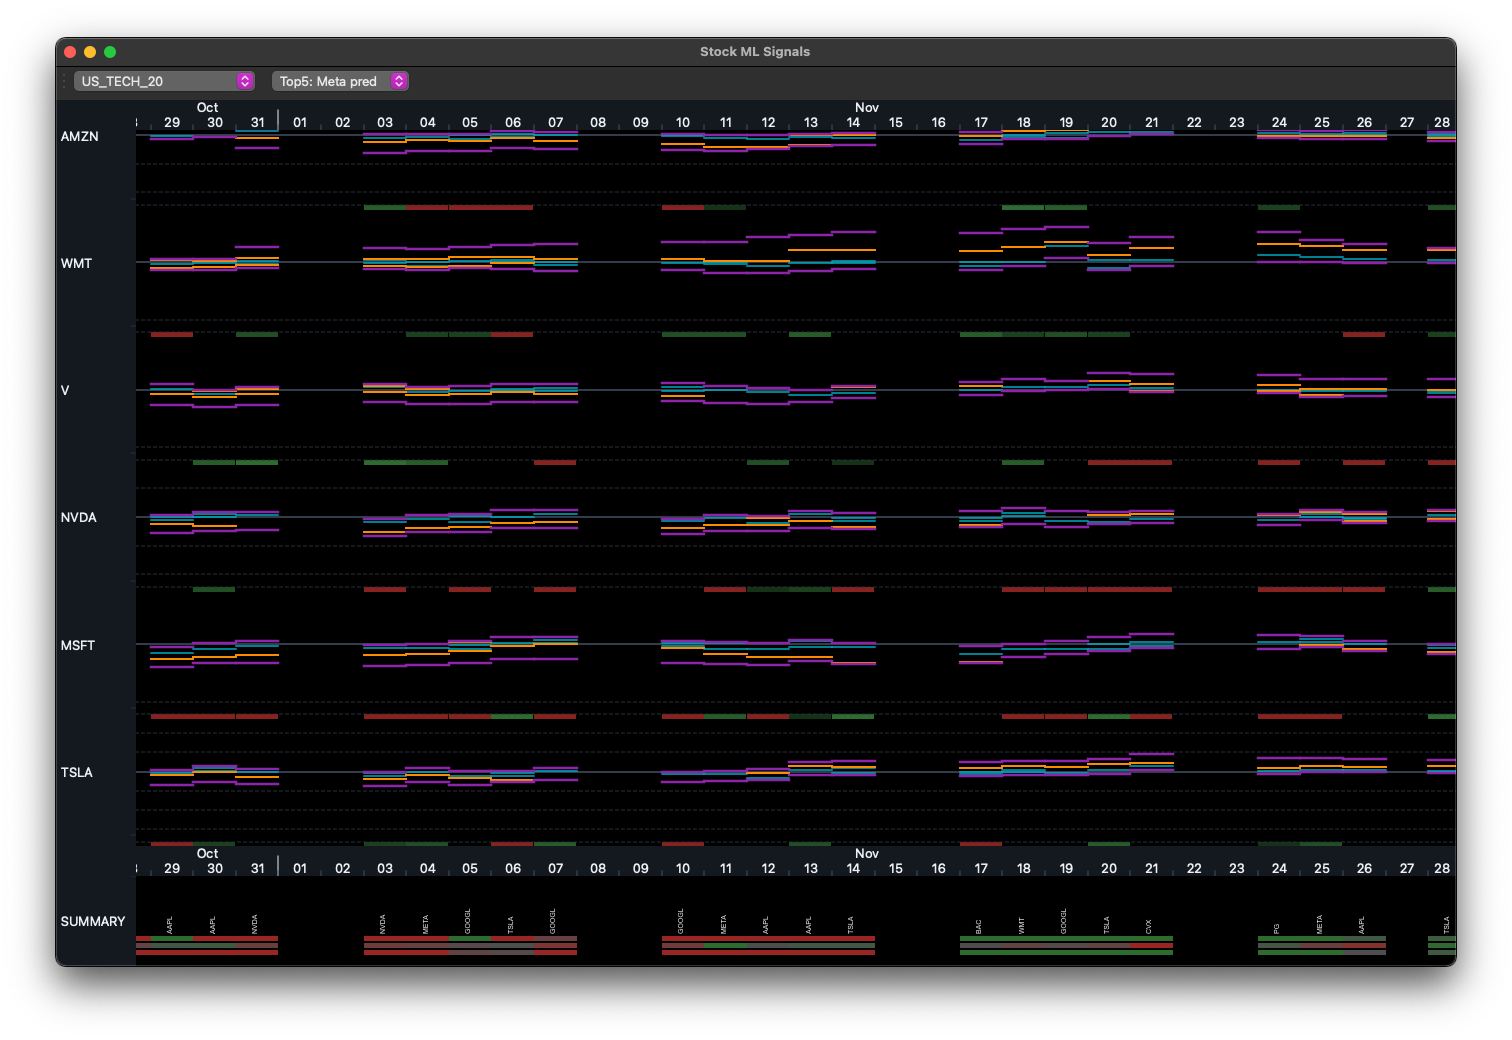
Stock App
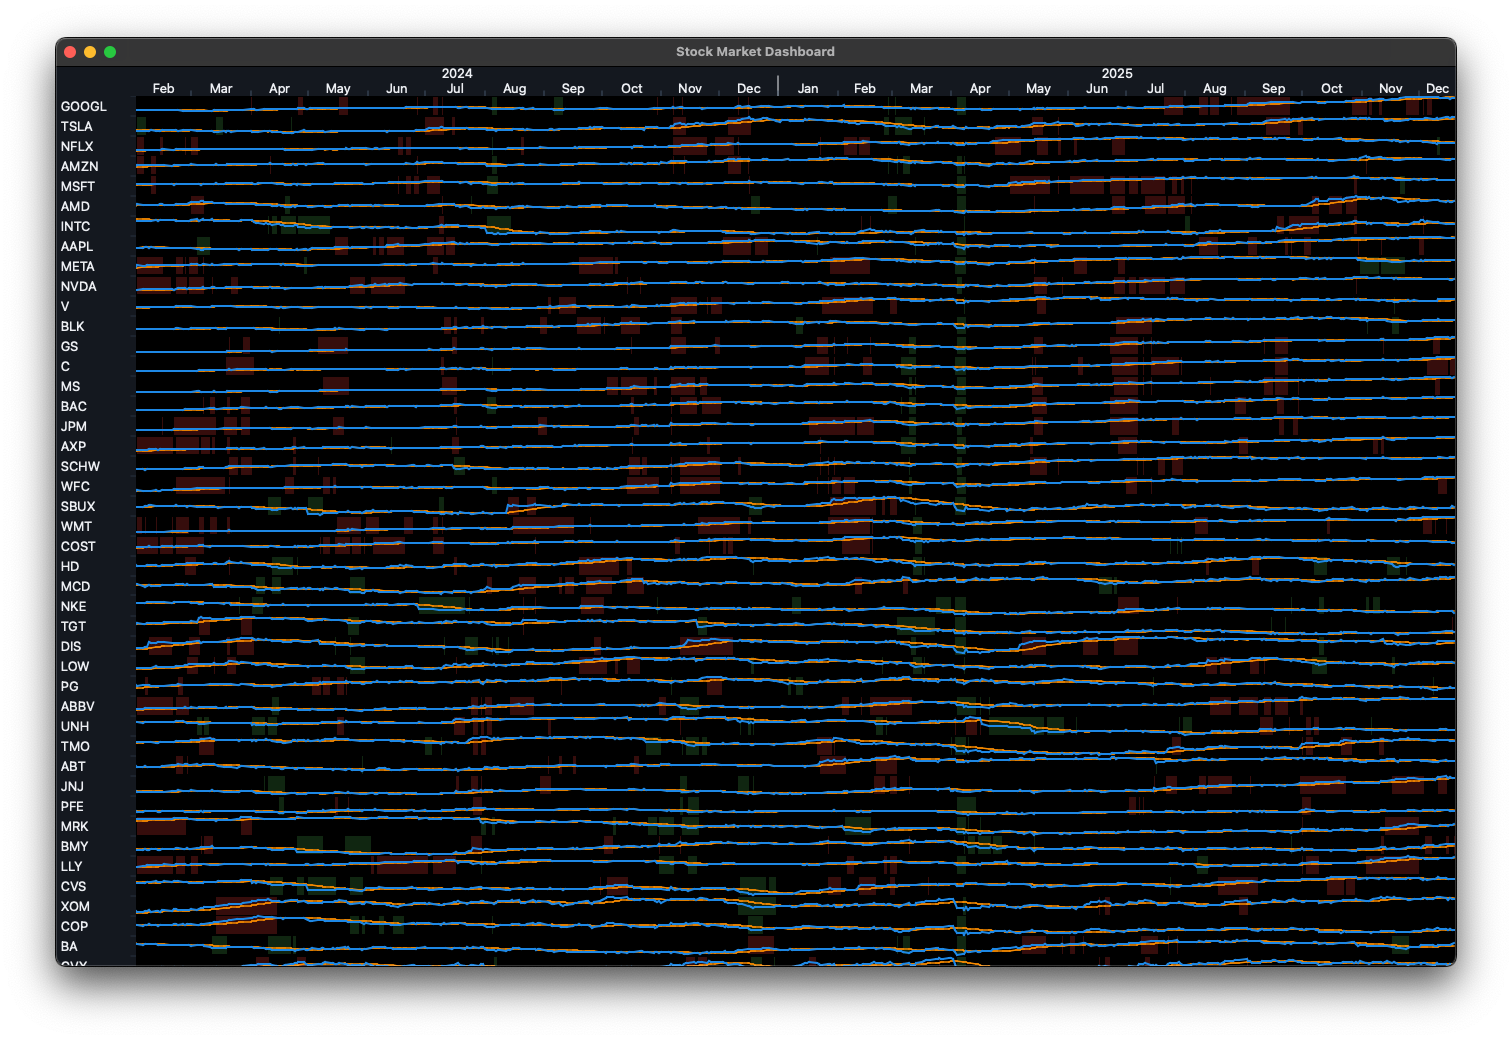
stock_app.py - Real stock data via yfinance.
Scheduling App
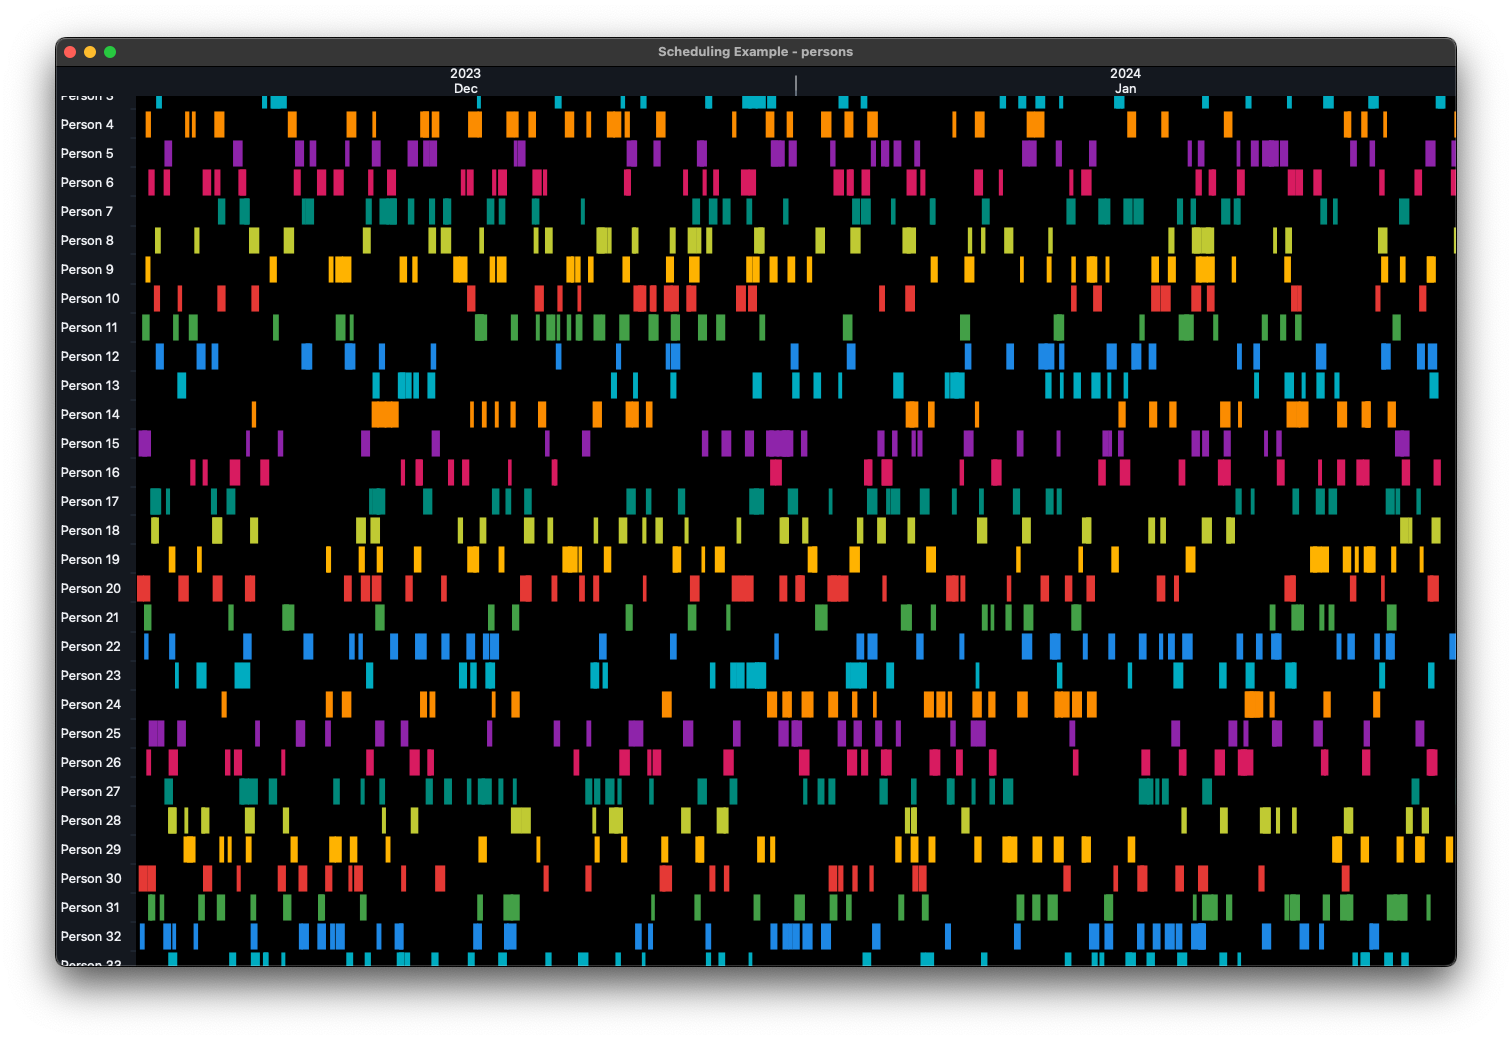
scheduling_app.py - Employee shifts (200 people, ItemRuler usage).
Sales Heatmap App
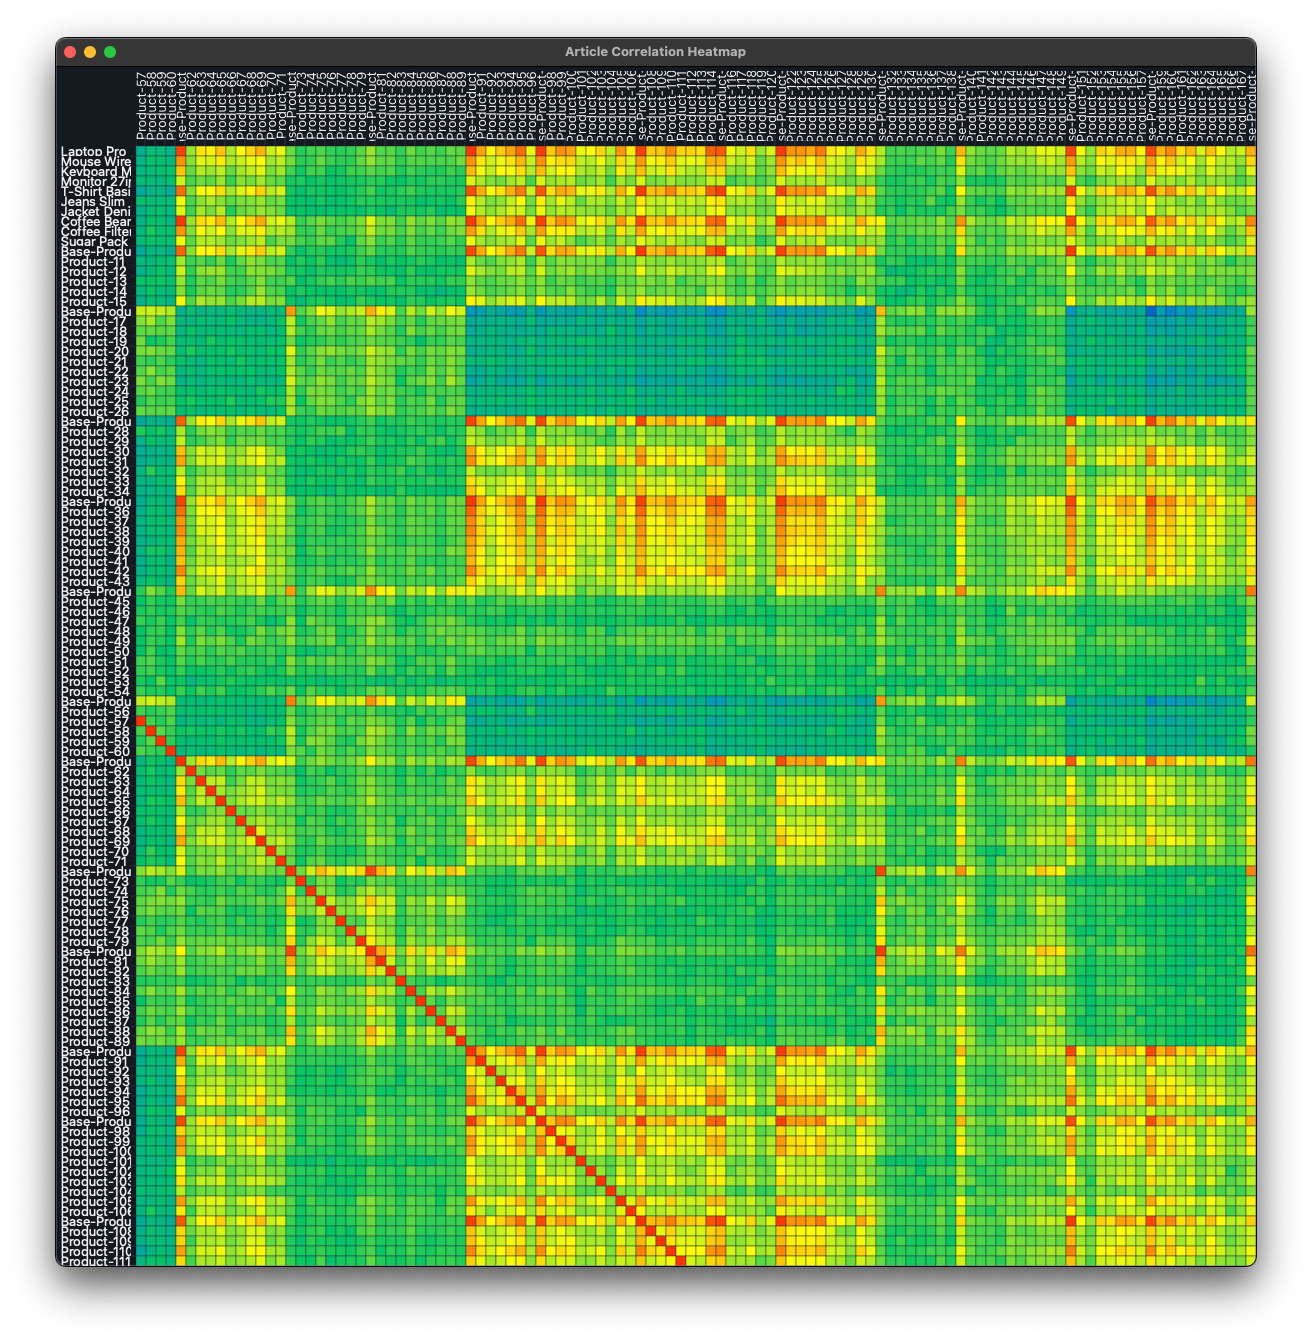
sales_heatmap_app.py - Sales correlation between products (ItemRuler x ItemRuler).
Navigation App
navigation_app.py - Random lines and Squares
Rulers
TimelineRuler
Date/time on horizontal axis. Auto-formats years/months/days/hours depending on zoom.
ruler = TimelineRuler(datetime(2024, 1, 1), datetime(2024, 12, 31))
NumberRuler
Numeric axis with SI units (k, M, G, etc). Can reverse for top-to-bottom.
ruler = NumberRuler(0, 10000, reverse=False)
ItemRuler
Categorical data - one band per item (employees, stocks, products, etc).
ruler = ItemRuler(
    item_count=100,
    default_pixels_per_item=40,
    min_pixels_per_item=20,
    max_pixels_per_item=150
)
Drawing
Rectangles
widget.draw_rects("layer_name", get_rects_func, brush=QBrush(color), pen=QPen(border))
# get_rects_func returns [(x, y, width, height), ...]
Lines
widget.draw_lines("layer_name", get_lines_func, pen=QPen(color, width))
# get_lines_func returns [(x1, y1, x2, y2), ...]
Text
widget.draw_texts("layer_name", get_texts_func, pen=QPen(color), font=QFont("Arial", 12))
# get_texts_func returns [(text, x, y), ...]
Custom drawing
def my_draw(painter):
    painter.setPen(QPen(Qt.red, 2))
    painter.drawEllipse(x, y, w, h)

widget.add_draw_command("custom", my_draw)
Colors
ColorMap handles theming:
color_map = ColorMap(darkmode=True)

# UI colors
bg = color_map.get_object_color("surface-base")
border = color_map.get_object_color("border")
text = color_map.get_object_color("text-base")

# Data viz colors
red = color_map.get_saturated_color("red", "fill")
blue = color_map.get_saturated_color("blue", "border")
Available: red, green, blue, cyan, orange, purple, pink, teal, lime, amber, grey
Controls
- Wheel: Pan horizontal/vertical
- Ctrl+Wheel: Zoom at mouse position
- Alt+Wheel: Zoom vertical axis (NumberRuler only)
- Click+Drag: Pan both axes
Performance tips
Only fetch visible data:
def get_visible_rects():
    start = self.h_ruler.visible_start
    end = self.h_ruler.visible_stop

    return [
        (x, y, w, h)
        for x, y, w, h in all_data
        if x + w >= start and x <= end
    ]

widget.draw_rects("rects", get_visible_rects, brush=QBrush(color))
Custom labels
ruler = ItemRuler(item_count=50)
widget = NavigationWidget(h_ruler, ruler, color_map)
widget.left_ruler_widget.get_label = lambda i: f"Employee {i+1}"
Ruler combinations
Mix rulers for different visualizations:
# Gantt chart
NavigationWidget(TimelineRuler(...), ItemRuler(...), color_map)

# Stock chart
NavigationWidget(TimelineRuler(...), NumberRuler(...), color_map)

# Correlation matrix
NavigationWidget(ItemRuler(...), ItemRuler(...), color_map)

# Scatter plot
NavigationWidget(NumberRuler(...), NumberRuler(...), color_map)
Architecture
Simple model-view split:
- Rulers: Handle coordinate transforms, zoom, pan math
- RulerWidgets: Render ticks/labels, handle mouse events
- DrawingWidget: Canvas for data visualization
- NavigationWidget: Composite putting it all together
Requirements
- Python 3.8+
- PySide6
- yfinance (optional, only for stock example)
License
MIT
Release history Release notifications | RSS feed


Download files
Download the file for your platform. If you're not sure which to choose, learn more about installing packages.
Source Distribution
Built Distribution
Filter files by name, interpreter, ABI, and platform.
If you're not sure about the file name format, learn more about wheel file names.
Copy a direct link to the current filters


