
sqltap - a library for profiling and introspecting SQL queries made through SQLAlchemy
sqltap helps you quickly understand:
- how many times a sql query is executed
- how much time your sql queries take
- where your application is issuing sql queries from
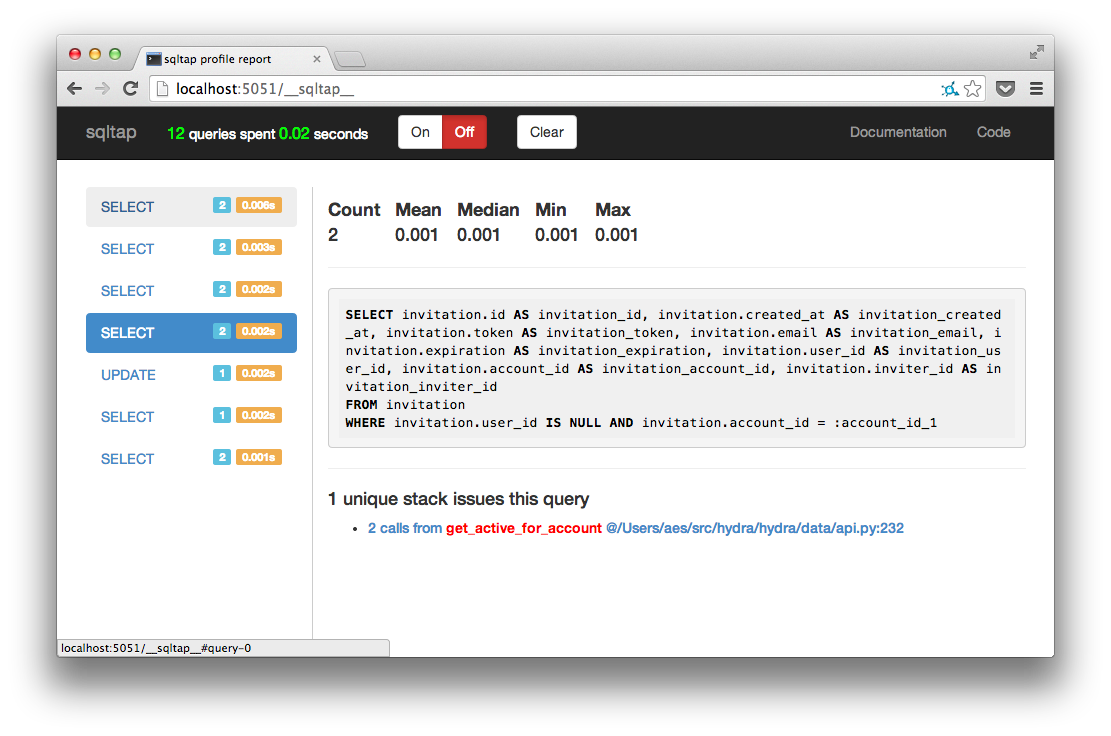
Full Documentation
http://sqltap.inconshreveable.com
Motivation
When you work at a high level of abstraction, it’s more common for your code to be inefficient and cause performance problems. SQLAlchemy’s ORM is excellent and gives you the flexibility to fix these inefficiencies if you know where to look! sqltap is a library that hooks into SQLAlchemy to collect metrics on all queries you send to your databases. sqltap can help you find where in your application you are generating slow or redundant queries so that you can fix them with minimal effort.
Quickstart Example
import sqltap

profiler = sqltap.start()
session.query(Knights).filter_by(who_say = 'Ni').all()
statistics = profiler.collect()
sqltap.report(statistics, "report.html")
WSGI integration
You can easily integrate SQLTap into any WSGI application. This will create an up-to-date report page at /__sqltap__ where you can dynamically enable/disable the profiling so you can easily run it selectively in production. Integrating is super-easy:
import sqltap.wsgi

wsgi_app = sqltap.wsgi.SQLTapMiddleware(wsgi_app)
For example, to integrate with a Flask application:
import sqltap.wsgi

app.wsgi_app = sqltap.wsgi.SQLTapMiddleware(app.wsgi_app)
Text report
Sometimes we want to profile sqlalchemy on remote servers. It's very inconvenient to view HTML format SQLTap report on these servers. Alternatively, SQLTap provides text profiling report in a human-readable way.
import sqltap

profiler = sqltap.start()
session.query(Knights).filter_by(who_say = 'Ni').all()
statistics = profiler.collect()
sqltap.report(statistics, "report.txt", report_format="text")
Profiling Utilities (NEW in v1.1.0)
SQLTap now includes convenient profiling utilities that work anywhere in your application - tests, development, staging, or production. The sqltap.profiling module provides a simple context manager with comprehensive statistics and automatic HTML report generation.
Basic Usage
from sqltap.profiling import sqltap_profiler

def test_my_endpoint():
    with sqltap_profiler("my-test") as stats:
        response = my_function()

    # Assert on query count
    assert stats.query_count <= 5
    assert stats.total_time <= 1.0
Detailed Analysis
Check for N+1 queries and analyze query patterns:
def test_check_n_plus_one():
    with sqltap_profiler("n-plus-one-test") as stats:
        # Your code that might have N+1 queries
        posts = session.query(Post).all()
        for post in posts:
            author = post.author  # Potential N+1!

    # Check for N+1 queries
    selects = stats.get_queries_by_type('SELECT')
    for qg in selects:
        assert qg.query_count <= 10, f"Potential N+1: {qg.sql_text[:100]}"

    # Print detailed summary
    print(stats.summary())
Available Statistics
The stats object provides comprehensive query metrics:
# Summary statistics
stats.query_count      # Total number of queries
stats.unique_queries   # Number of unique SQL queries
stats.total_time       # Total DB time in seconds
stats.mean_time        # Mean query time
stats.median_time      # Median query time
stats.min_time         # Fastest query
stats.max_time         # Slowest query

# Query analysis
stats.query_groups              # All query groups (sorted by total time)
stats.get_queries_by_type('SELECT')  # Filter by query type
stats.get_slowest_query()       # Get the slowest query group
stats.summary()                 # Get formatted text summary
Custom Report Location
Save reports to a custom directory:
with sqltap_profiler("my-test", report_dir="/tmp/reports") as stats:
    response = my_function()
Disable Report Generation
For CI environments or when you only need assertions:
with sqltap_profiler("my-test", save_report=False) as stats:
    response = my_function()

assert stats.query_count <= 5
Integration with pytest fixtures
SQLTap profiler works seamlessly with pytest fixtures, allowing you to profile queries across your entire test without wrapping test code in with statements:
import pytest
from sqltap.profiling import sqltap_profiler

@pytest.fixture
def db_profiler(request):
    """Fixture that profiles all DB queries in a test"""
    with sqltap_profiler(request.node.name, save_report=False) as stats:
        yield stats

def test_with_profiler(db_profiler):
    # Your test code here
    response = my_function()

    # Assert on the profiler stats
    assert db_profiler.query_count <= 10

    # Log detailed summary for debugging
    print(profile_db.summary())
Using with Report Generation
Enable reports in your local environment:
@pytest.fixture
def db_profiler(request):
    """Fixture with automatic report generation"""
    save_report = os.getenv("SAVE_SQLTAP_REPORTS", "false") == "true"
    with sqltap_profiler(request.node.name, save_report=save_report) as stats:
        yield stats

# Run tests with reports:
# SAVE_SQLTAP_REPORTS=true pytest tests/

def test_list_users(db_profiler):
    users = db.query(User).all()

    # Check for N+1 queries
    selects = db_profiler.get_queries_by_type('SELECT')
    for qg in selects:
        assert qg.query_count <= 2, f"N+1 detected: {qg.sql_text[:80]}"
Advanced Example
import sqltap

def context_fn(*args):
    """ Associate the request path, unique id with each query statistic """
    return (framework.current_request().path,
            framework.current_request().id)

# start the profiler immediately
profiler = sqltap.start(user_context_fn=context_fn)

def generate_reports():
    """ call this at any time to generate query reports reports """
    all_stats = []
    per_request_stats = collections.defaultdict(list)
    per_page_stats = collections.defaultdict(list)

    qstats = profiler.collect()
    for qs in qstats:
        all_stats.append(qs)

        page = qstats.user_context[0]
        per_page_stats[page].append(qs)

        request_id = qstats.user_context[1]
        per_request_stats[request_id].append(qs)

    # report with all queries
    sqltap.report(all_stats, "report_all.html")

    # a report per page
    for page, stats in per_page_stats.items():
        sqltap.report(stats, "report_page_%s.html" % page)

    # a report per request
    for request_id, stats in per_request_stats.items():
        sqltap.report(stats, "report_request_%s.html" % request_id)
Testing
Run the sqltap tests:
python setup.py test
License
Apache
1 maintainer

Metadata
1 maintainer
Release files for sqltap-profiler 1.2.0
For a detailed explanation of source distributions (sdists) and built distributions (wheels), please see the package formats documentation.
Source distribution (sdist)
| File | Size | Uploaded | |
|---|---|---|---|
| sqltap_profiler-1.2.0.tar.gz | 31.0 kB | Details |
Built distribution (wheel)
| File | Interpreter | ABI | Platform | Reset |
|---|---|---|---|---|
| sqltap_profiler-1.2.0-py3-none-any.whl | Python 3 | none | any | Details |
Total release size: 51.3 kB
Release files / sqltap_profiler-1.2.0.tar.gz
| Download URL | sqltap_profiler-1.2.0.tar.gz |
|---|---|
| Size | 31.0 kB |
| Tags | Source |
|
SHA-256 checksum How to use checksums |
715a6f0da2db165643fc6a595ff3b0ed7b09f5510511126ab798ba7dbdff08d6
|
|
BLAKE2b-256 checksum How to use checksums |
8e1f019a0293ddd00389b73a7aeae6c07c0c2a2eb39de3d22a9c6ea41a25fdb4
|
| Upload date | |
|
Uploaded using Trusted Publishing? What is trusted publishing? |
Yes |
| Uploaded via |
twine/6.1.0 CPython/3.13.7
|
Provenance
Provenance describes where a file came from. On PyPI, provenance is shared via attestations, which provide a verifiable record of the build or publishing details. View details, limitations and caveats.


PyPI Publish Attestation
PyPI verified that this artifact, at this checksum, originated from the publisher listed below.
Signed by GitHub Actions, verified by PyPI on Oct 9, 2025.
Transparency logRelease files / sqltap_profiler-1.2.0-py3-none-any.whl
| Download URL | sqltap_profiler-1.2.0-py3-none-any.whl |
|---|---|
| Size | 20.3 kB |
| Tags | Python 3 |
|
SHA-256 checksum How to use checksums |
b82b8fe15efd5000e57b020e5de3330c04e6769e6b730bab97ecdbafda189d23
|
|
BLAKE2b-256 checksum How to use checksums |
1f2093ffbc78158cf4b4ebb8876f8f93a4e6cff88d0e2a0ca13436b441dfbbe0
|
| Upload date | |
|
Uploaded using Trusted Publishing? What is trusted publishing? |
Yes |
| Uploaded via |
twine/6.1.0 CPython/3.13.7
|
Provenance
Provenance describes where a file came from. On PyPI, provenance is shared via attestations, which provide a verifiable record of the build or publishing details. View details, limitations and caveats.
PyPI Publish Attestation
PyPI verified that this artifact, at this checksum, originated from the publisher listed below.
Signed by GitHub Actions, verified by PyPI on Oct 9, 2025.
Transparency log













