Python package for trend analysis using technical analysis of price behaviour around trend lines

Project description
st13 📉📈
Python package for trend analysis using technical analysis of price behaviour around trend lines.
This is still in Pre-Alpha, the framework for downloading data, plotting log chart, with horizontal trendlines is done.
Next up is coding in the turning points detection on sloping trendlines and plot the lines on the asset log chart.
To install the latest version of st13 Python package
pip3 install st13 --upgrade
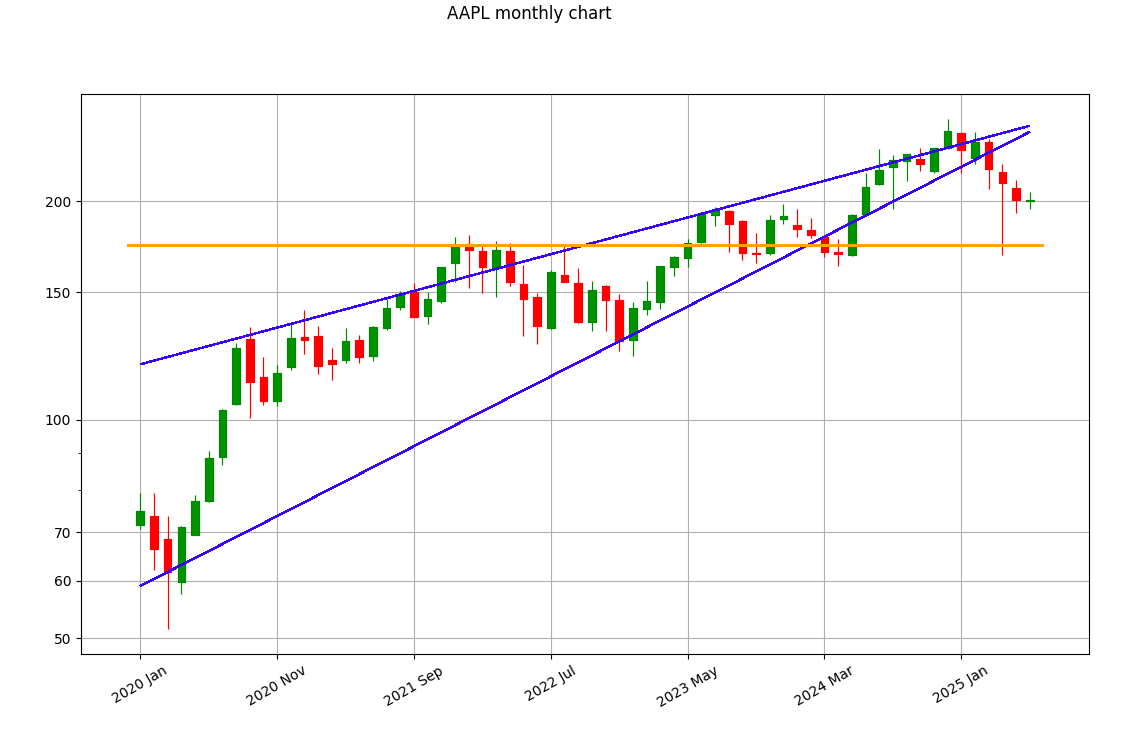
To see a sample plot of an asset with horizontal trendlines, run it with the following, where SYMBOL is the asset symbol on Yahoo Finance. If not provided, AAPL will be used for demonstration.
python3 -m st13 SYMBOL
Release history Release notifications | RSS feed


Download files
Download the file for your platform. If you're not sure which to choose, learn more about installing packages.
Source Distribution
File details
Details for the file st13-0.7.0.tar.gz.
File metadata
- Download URL: st13-0.7.0.tar.gz
- Upload date:
- Size: 63.1 kB
- Tags: Source
- Uploaded using Trusted Publishing? No
- Uploaded via: twine/6.1.0 CPython/3.13.3
File hashes
| Algorithm | Hash digest | |
|---|---|---|
| SHA256 |
3998e27f6a0a66153e0aa48ae793973b7f74a9bf3d47fbac5bba48934e17f6aa
|
|
| MD5 |
673e4cb23672a328bbd52e7bd4eb0476
|
|
| BLAKE2b-256 |
b8dface7a68831916ca9a3b5fb4209c77f20ccc1d9ffd3f966cd44f9fd6fb3c4
|


