A Python package to generate an astronomy star chart based on spherical projection that corrects for distortions with stereographic projection

Project description
Star-Chart-Spherical-Projection


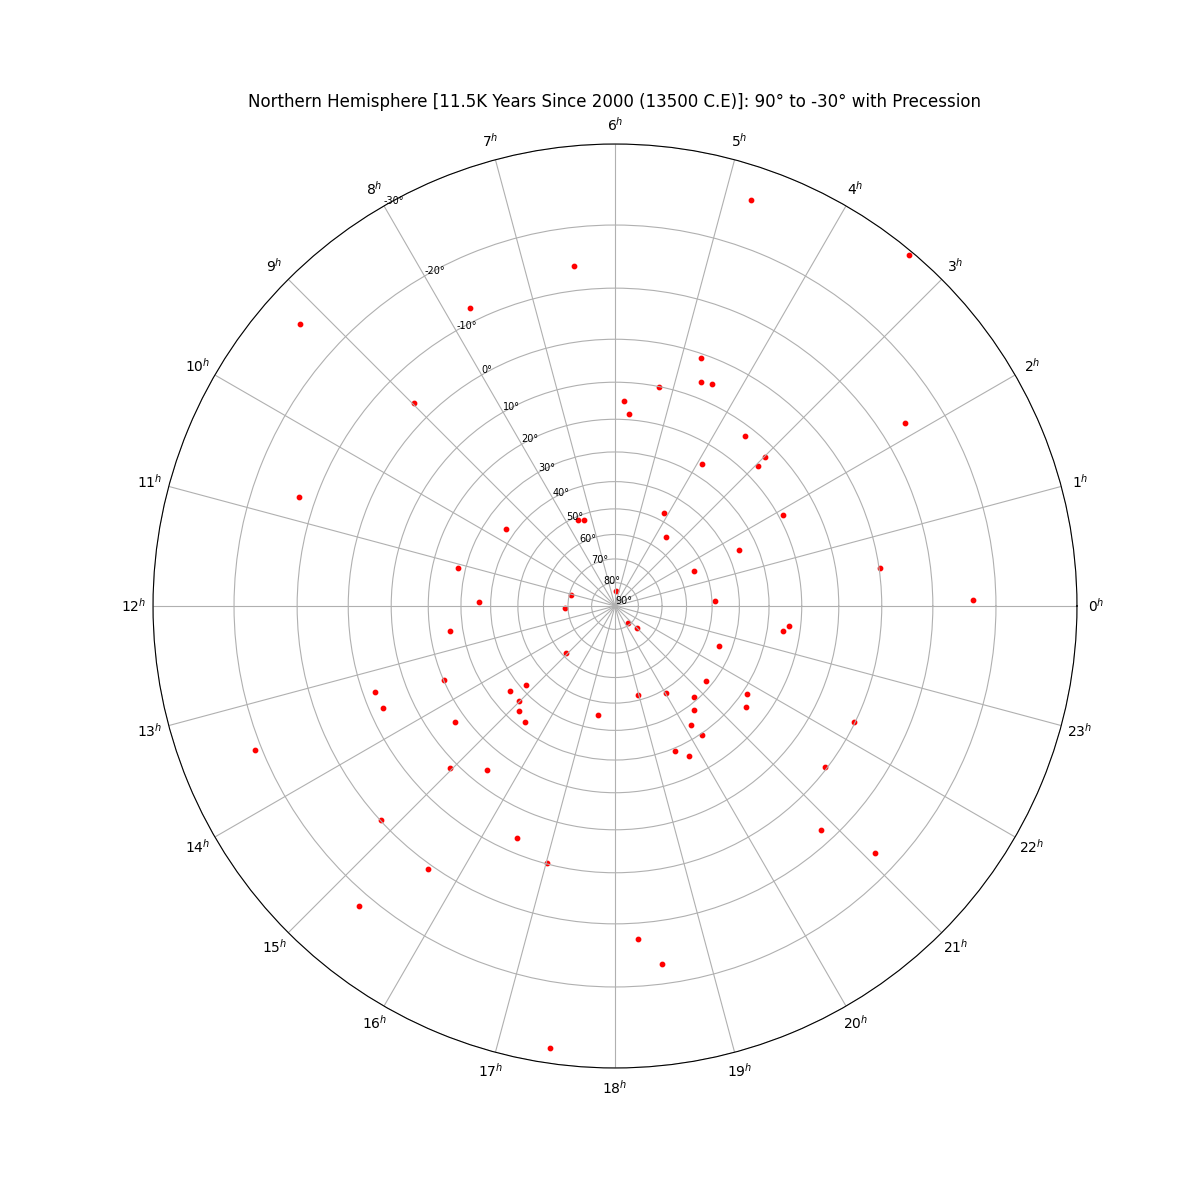
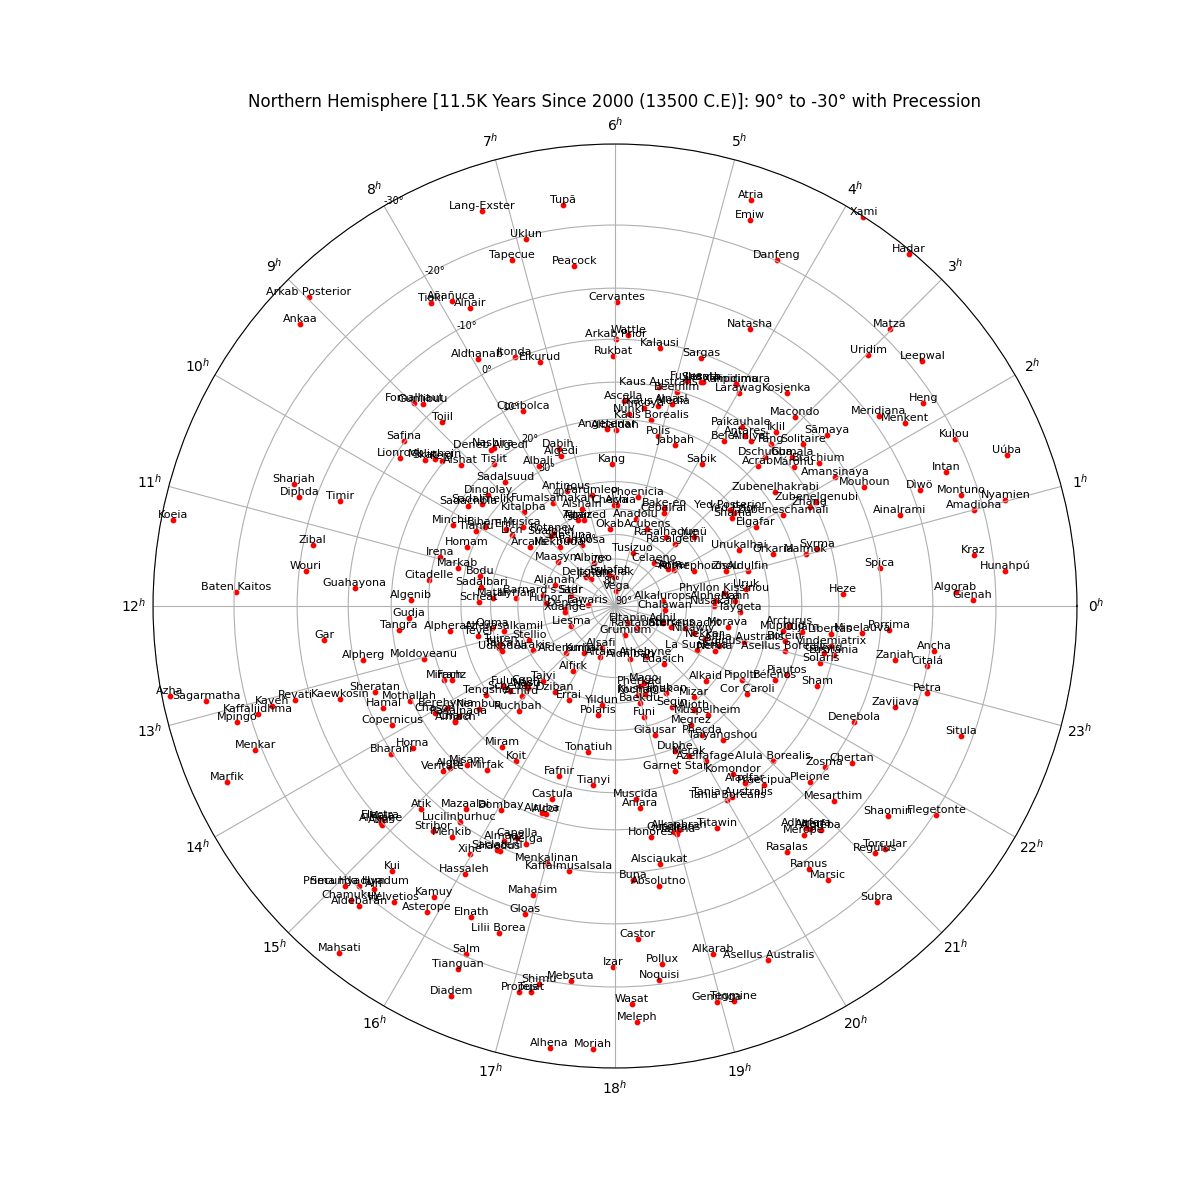
A Python package to generate an astronomy star chart based on spherical projection with +90/-90° in the center (orignally based on this Astrolabe work) based on a star's position (declination and right ascension): past, present, and future (proper motion and *precession)
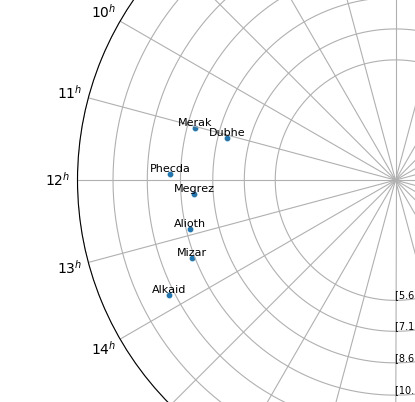
The first step to plot the celestial sphere onto a 2D plot is to map the star's right ascension as hours along the plot (polar plot's theta value) and declination as the distance from the center of the circle (polar plot's radius value). However, attempting to map the right ascension and declination directly will cause a distinct amount of distortion since the angles between the stars along the declination are no longer conserved. On the left, the constellation of the Big Dipper is stretched into an unfamiliar shape. By accounting for the spherical transformation, the star chart can be corrected as seen on the right.
| Without Correction | With Correction |
|---|---|
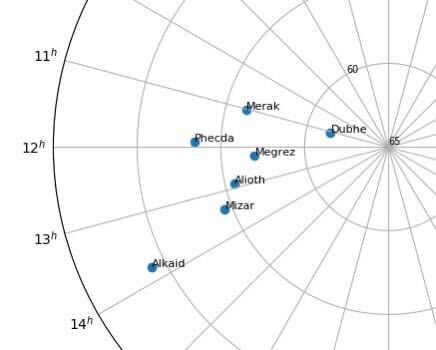 |
 |
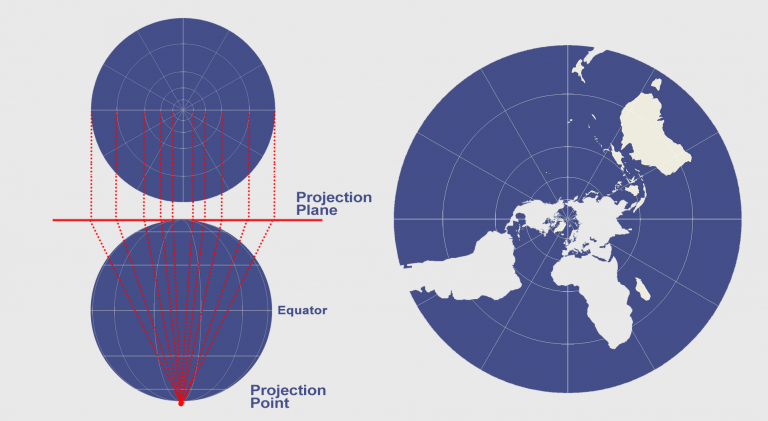
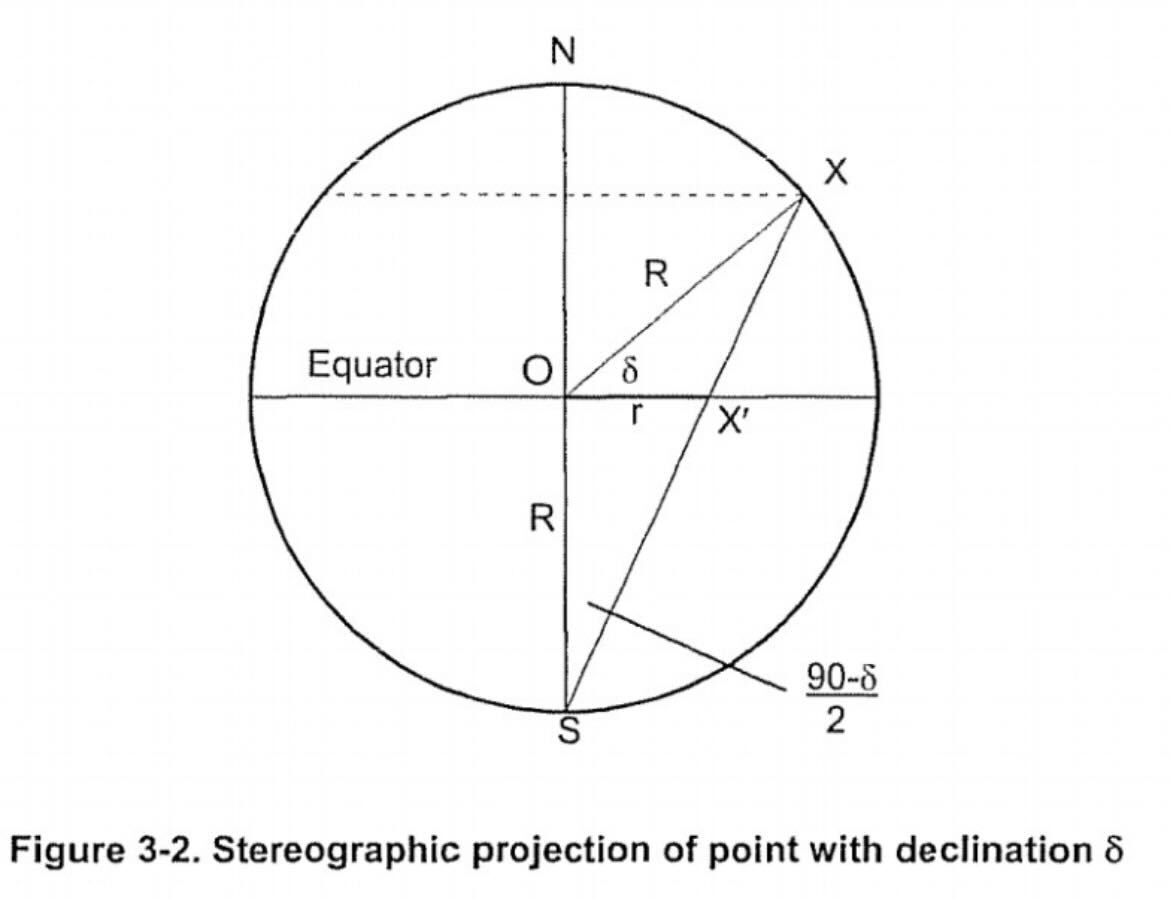
The sphere is projected from the South Pole (via Sterographic projection):
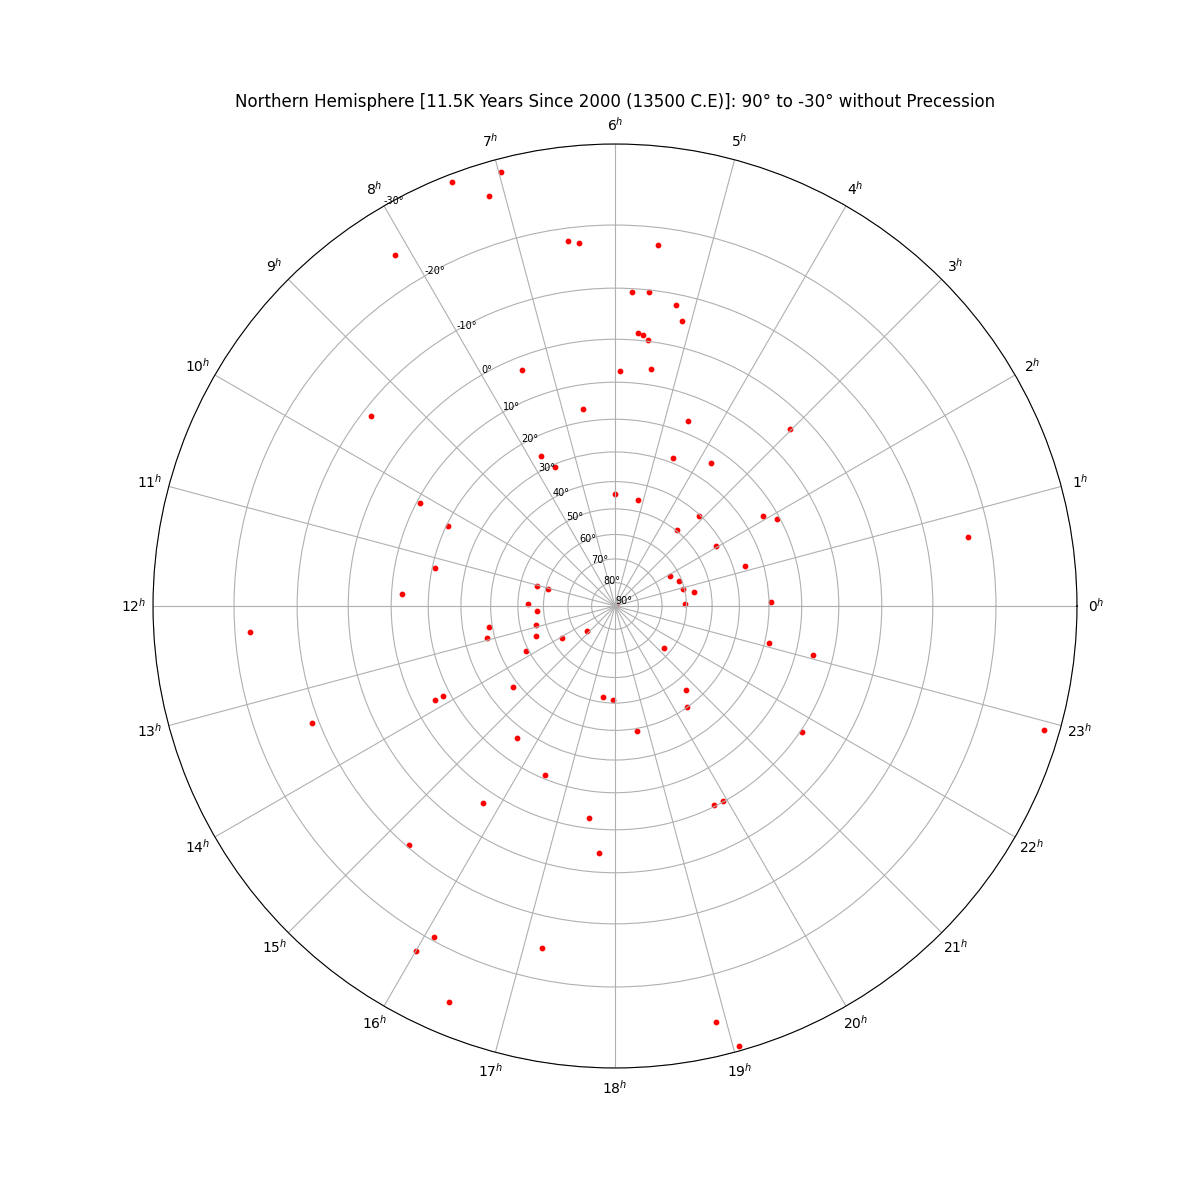
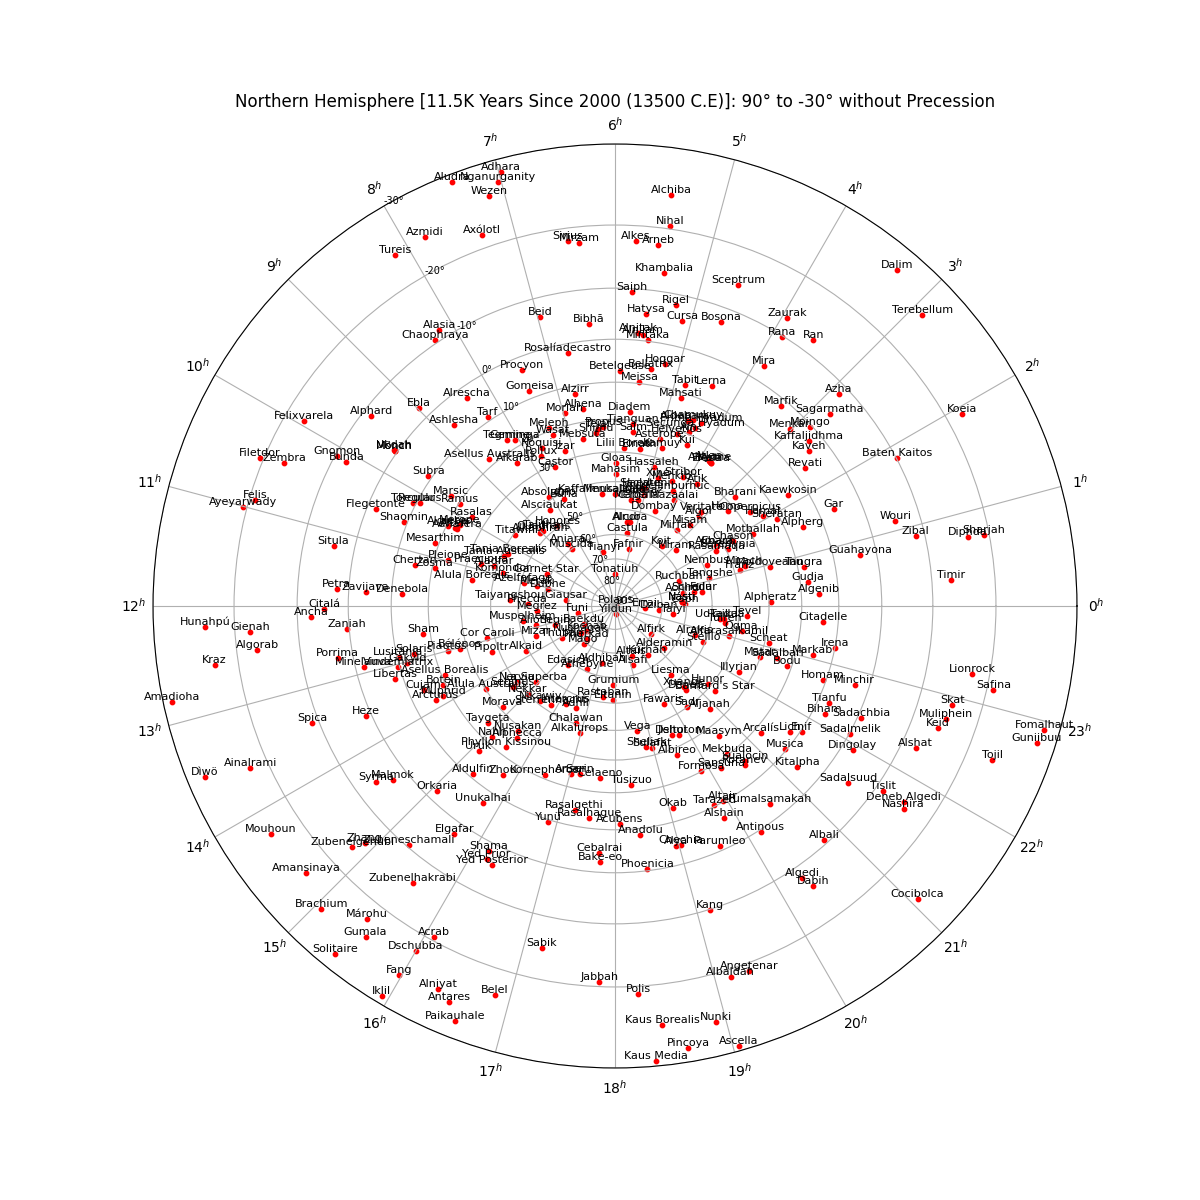
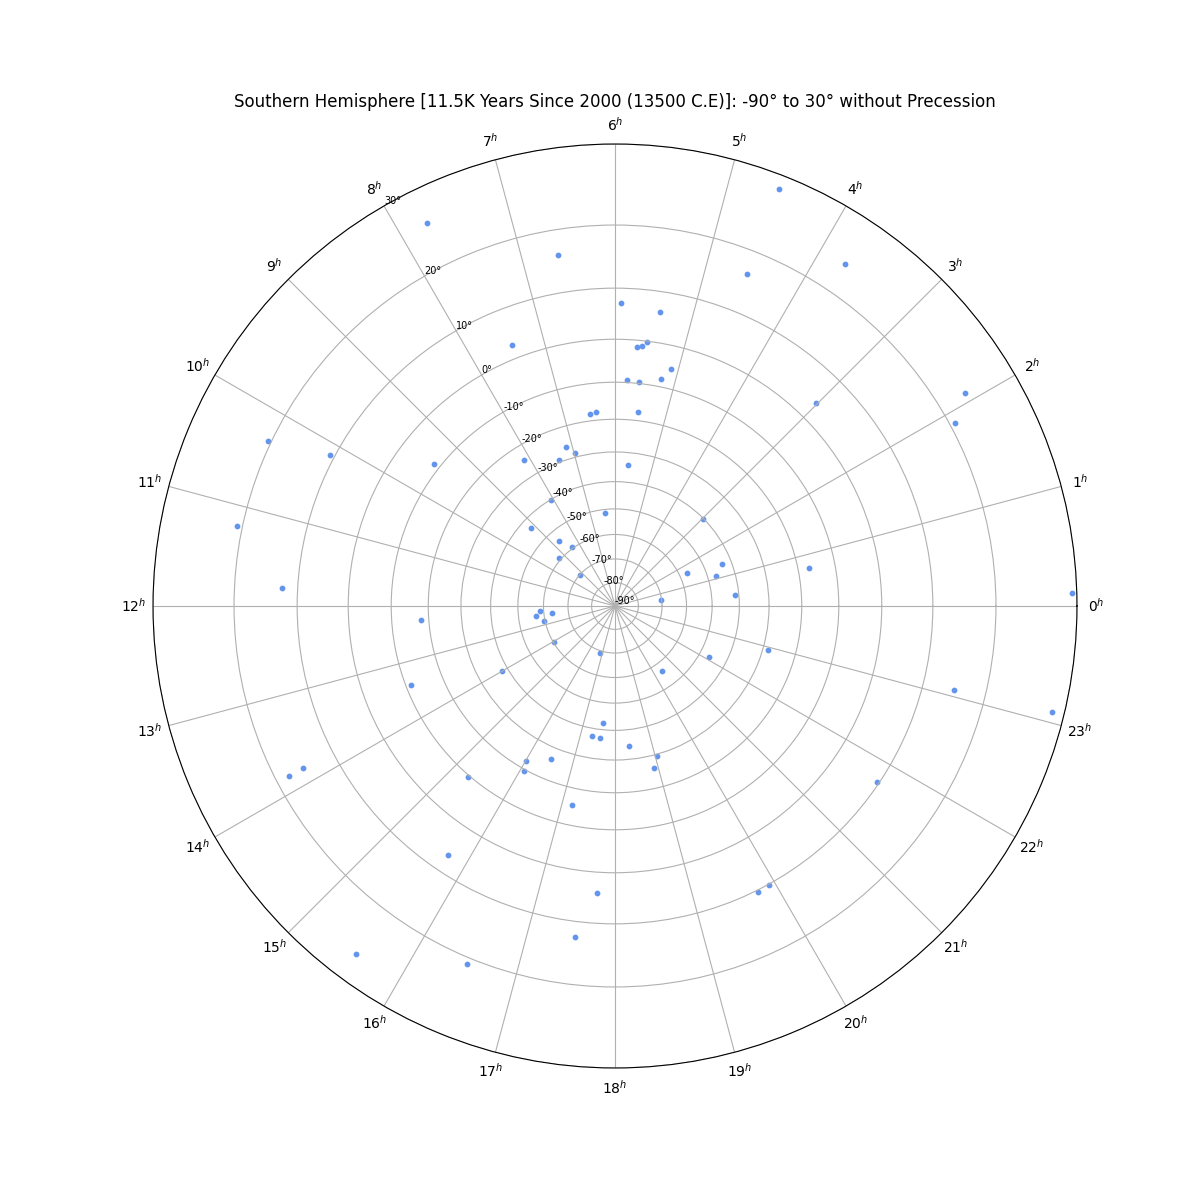
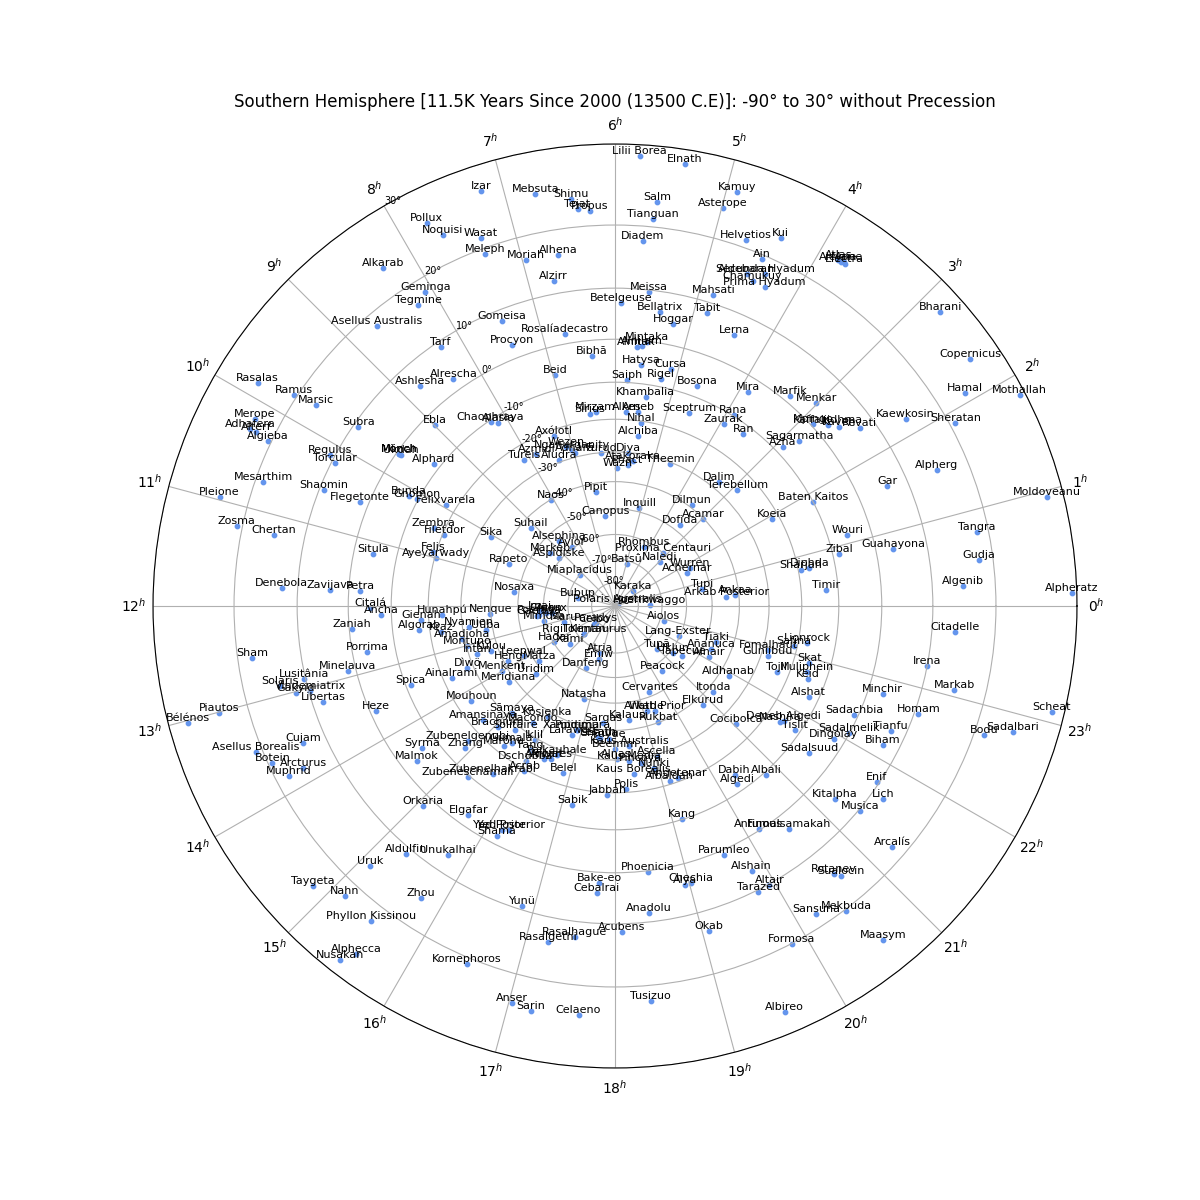
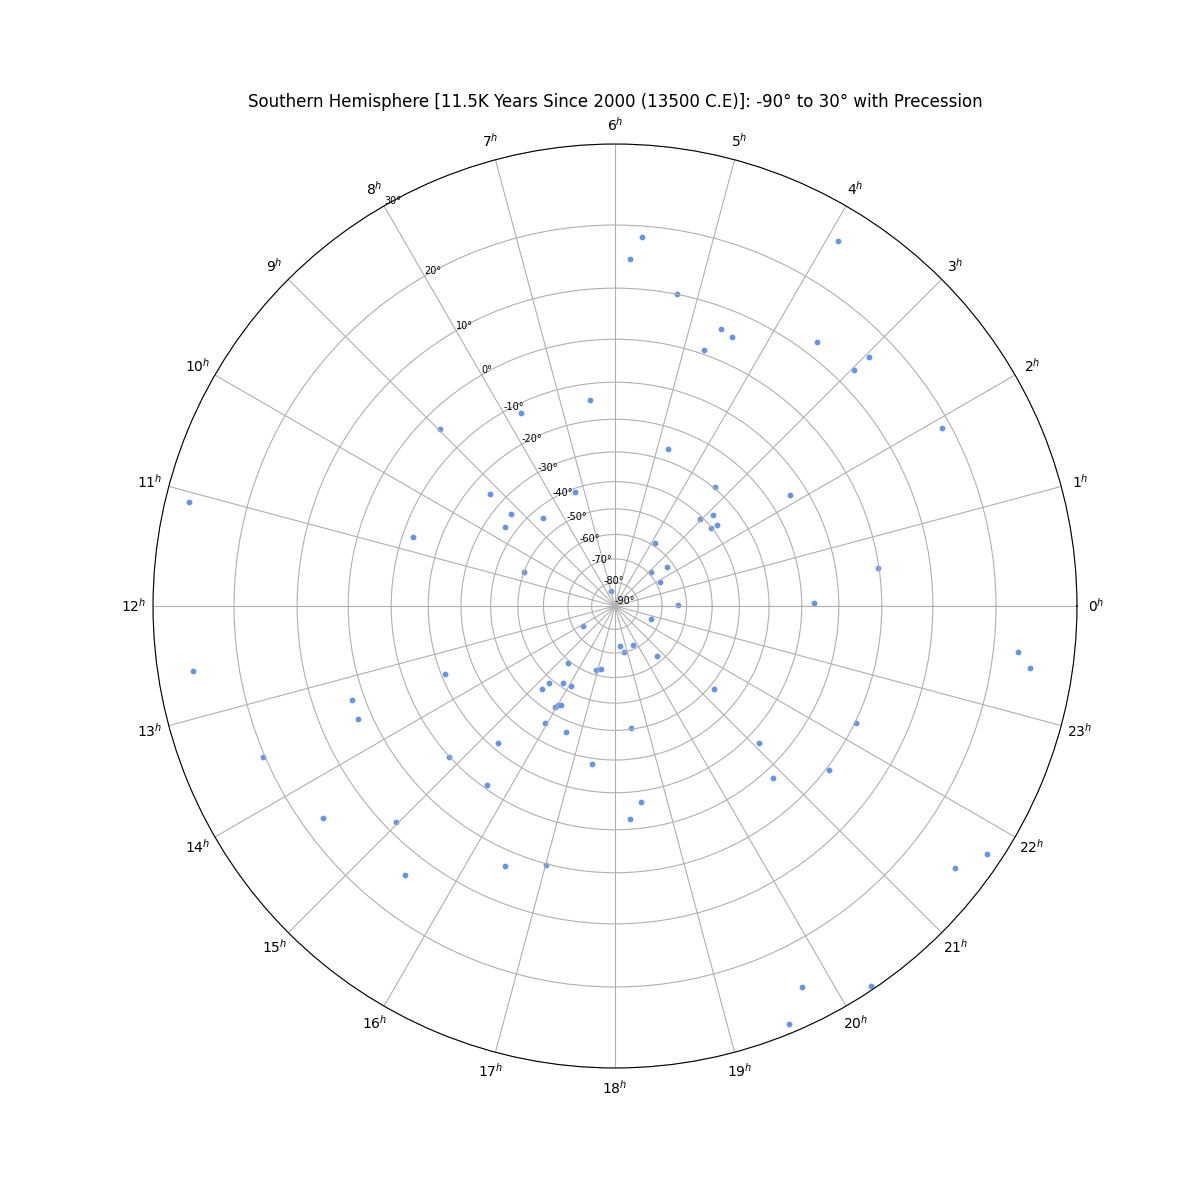
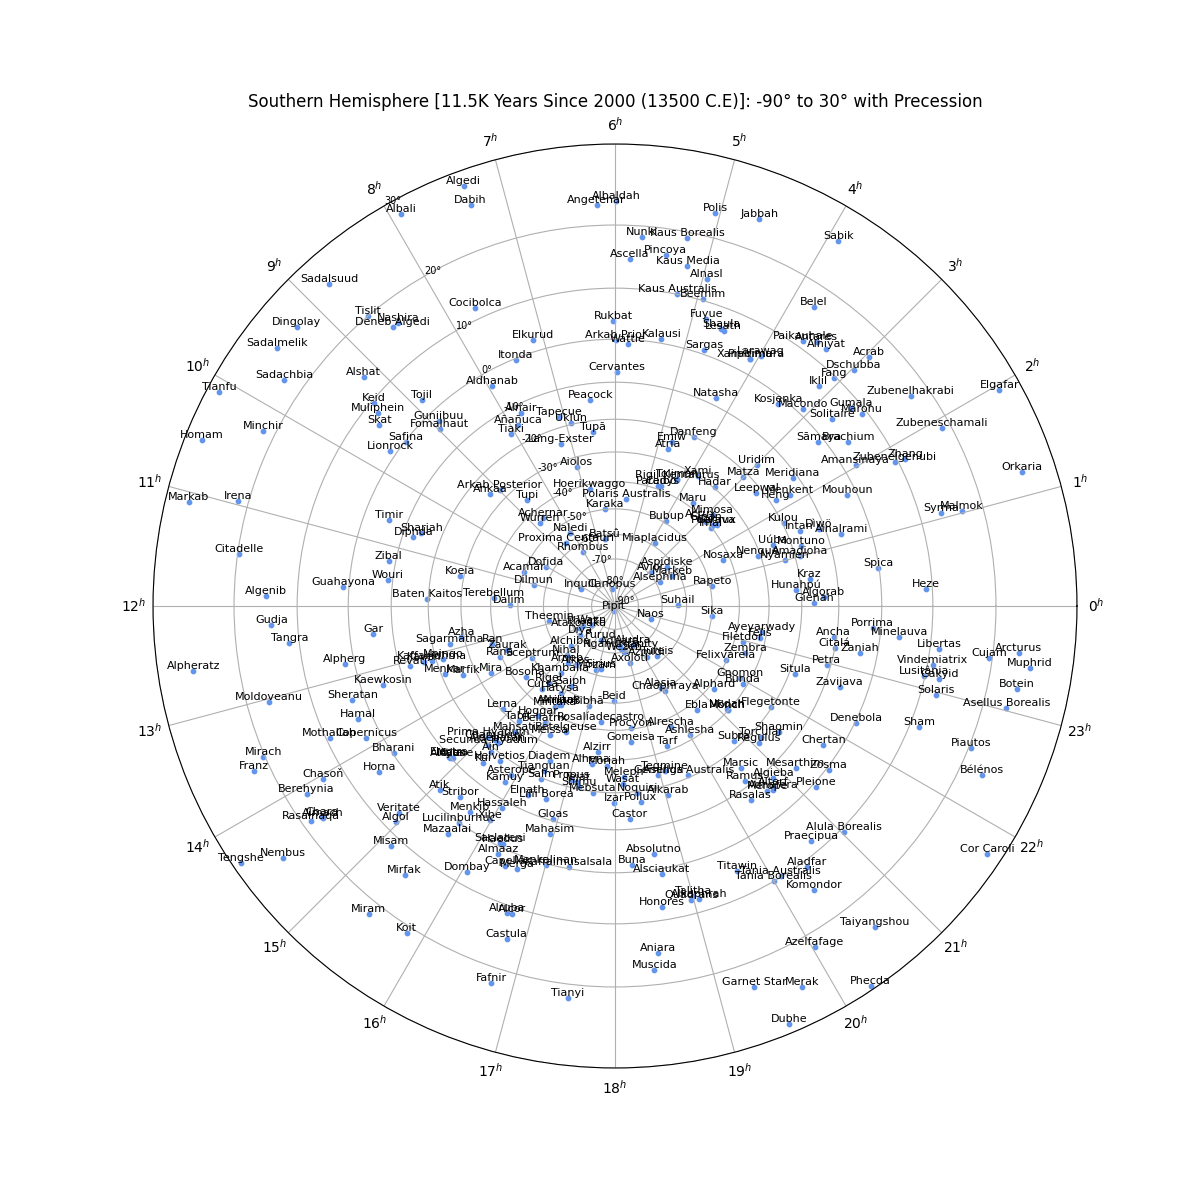
Example outputs:
Star Chart in the Northern Hemisphere (centered on 90°) without Precession
Star Chart in the Southern Hemisphere (centered on -90°) without Precession
Overview
From the perspective of an observer on the Earth's surface, the stars appear to sit along the surface of the celestial sphere--an imaginary sphere of arbitery radius with the Earth at its center. All objects in the sky will appear projected on the celestial sphere regardless of their true distance from Earth. Each star's position is given by two values. Declination is the angular distance from the celestial equator and right ascension is the distance from the position of the vernal equinox. The stars will appear to rotate across the sky as a result of the Earth's rotation, but their position is fixed. A star’s actual position does change over time as the combined result of the star’s small movement (proper motion) as well as the changing rotational axis of the Earth (precession).
Spherical projection can overcome this difficulty by converting the position of the declination to:
# Projected from South Pole (Northern Hemisphere)
north_hemisphere_declination = tan(45° + (original_declination / 2))

# Projected from North Pole (Southern Hemisphere)
south_hemisphere_declination = tan(45° - (original_declination / 2))
Where in the Northern Hemsiphere, projections are formed from the South Pole:
Documentation
plotStereographicProjection(userListOfStars=[],
		northOrSouth=None,
		declination_min=None,
		yearSince2000=0,
		displayStarNamesLabels=True,
		displayDeclinationNumbers=True,
		incrementBy=10,
		isPrecessionIncluded=True,
		fig_plot_title=None,
		fig_plot_color="C0",
		figsize_n=12,
		figsize_dpi=100,
		save_plot_name=None
- [REQUIRED] northOrSouth: (string) map for either the "North" or "South" hemisphere
- [OPTIONAL] userListOfStar: (list) a list of star names to include, by default = [] includes all stars (in star_data.csv). Example: ["Vega", "Merak", "Dubhe"]
- [OPTIONAL] declination_min: (int) outer declination value, defaults to -30° in Northern hemisphere and 30° in Southern hemisphere
- [OPTIONAL] yearSince2000: (float) years since 2000 (-50 = 1950 and +50 = 2050) to calculate proper motion and precession, defaults = 0 years
- [OPTIONAL] displayStarNamesLabels: (boolean) display the star name labels, defaults to True
- [OPTIONAL] displayDeclinationNumbers: (boolean) display declination values, defaults to True
- [OPTIONAL] isPrecessionIncluded: (boolean) when calculating star positions include predictions for precession, defaults to True
- [OPTIONAL] incrementBy: (int) increment values for declination (either 1, 5, 10), defaults to 10
- [OPTIONAL] fig_plot_title: (string) figure title, defaults to "<North/South>ern Hemisphere [ Years Since 2000 (YYYY)]: +/-90° to °"
- [OPTIONAL] fig_plot_color: (string) scatter plot star color, defaults to C0
- [OPTIONAL] figsize_n: (int) figure size, default to 12
- [OPTIONAL] figsize_dpi: (int) figure DPI, default to 100
- [OPTIONAL] save_plot_name: (string) save plot with a string name, defaults to not saving
Current list of stars (to access via userListOfStar): ['Acamar', 'Achernar', 'Acrux', 'Aldebaran', 'Algol', 'Alhena', 'Alioth', 'Alkaid', 'Alnilam', 'Alnitak', 'Alphard', 'Alphecca', 'Alpheratz', 'Altair', 'Ankaa', 'Antares', 'Arcturus', 'Atria', 'Avior', 'Bellatrix', 'Beta Hydri', 'Beta Phoenicis', 'Betelgeuse', 'Canopus', 'Capella', 'Caph', 'Castor', 'Celaeno', 'Chara', 'Cor-Caroli', 'Delta Crucis', 'Deneb', 'Denebola', 'Diphda', 'Dubhe', 'Elnath', 'Formalhaut', 'Gacrux', 'Gamma Phoenicis', 'Hadar', 'Hamal', 'Megrez', 'Meissa', 'Menkalinan', 'Merak', 'Mimosa', 'Mintaka', 'Mirfak', 'Mirzam', 'Mizar', 'Muphrid', 'Navi', 'Phecda', 'Polaris', 'Pollux', 'Procyon', 'Rasalhague', 'Regulus', 'Rigel', 'Ruchbah', 'Saiph', 'Schedar', 'Segin', 'Seginus', 'Sirius', 'Spica', 'Vega', 'Wezen', 'Zubeneschamali']
Dependencies
Python 3.7
pip3 install -r requirements.txt
Install
PyPi pip install at pypi.org/project/star-chart-spherical-projection/
pip install star-chart-spherical-projection
Examples
import star_chart_spherical_projection

star_chart_spherical_projection.plotStereographicProjection(northOrSouth="North")
Tests
TODO:
Add README badges: tests
Pypi tests
Release history Release notifications | RSS feed


Download files
Download the file for your platform. If you're not sure which to choose, learn more about installing packages.
Source Distribution
Built Distribution
Filter files by name, interpreter, ABI, and platform.
If you're not sure about the file name format, learn more about wheel file names.
Copy a direct link to the current filters
File details
Details for the file star-chart-spherical-projection-1.1.3.tar.gz.
File metadata
- Download URL: star-chart-spherical-projection-1.1.3.tar.gz
- Upload date:
- Size: 22.7 kB
- Tags: Source
- Uploaded using Trusted Publishing? No
- Uploaded via: twine/4.0.1 CPython/3.7.3
File hashes
| Algorithm | Hash digest | |
|---|---|---|
| SHA256 |
9e2e2180a63a681e83666a31e55f60d2628e9ccf3c9f41138a57b4c4b8d83dd5
|
|
| MD5 |
0371c6046bbf72f4073c38cb1ac7a298
|
|
| BLAKE2b-256 |
6955ef89e57a1995ab0adc3419f5cbacace4b803b4f631de2918b3b66abeff68
|
File details
Details for the file star_chart_spherical_projection-1.1.3-py3-none-any.whl.
File metadata
- Download URL: star_chart_spherical_projection-1.1.3-py3-none-any.whl
- Upload date:
- Size: 22.8 kB
- Tags: Python 3
- Uploaded using Trusted Publishing? No
- Uploaded via: twine/4.0.1 CPython/3.7.3
File hashes
| Algorithm | Hash digest | |
|---|---|---|
| SHA256 |
15fd6d6a2f0b14798e99d1dc4712c2f958720370274df8ec9d9fb668fa2e116c
|
|
| MD5 |
b76a4f6f3717bd7708826b889ab9611e
|
|
| BLAKE2b-256 |
b3973fca489b701dea85daa93f1281bab60644cb66f9de7eb4a99216cc5736cb
|


