
Description
This is a Python library based on beautifulsoup4, pandas &
mplfinance.
You may use it to download price history and fundamental information of companies from
Dhaka Stock Exchange and Chittagong Stock Exchange, as well as market
index data (DSE: DSEX, DSES, DS30, DGEN, CDSET; CSE: CASPI, CSE30, CSCX, CSE50, CSI).
Data from both exchanges comes back in the same shape (columns, order
and types), so an application written against DSE output works for CSE unchanged.
This can assist you to create further analyses
based on fundamental, price history and index data.
Also create Candlestick charts to analyse the price history of stocks using
this easy-to-use wrapper for mplfinance.
Installation
pip install stocksurferbd
Configuration (TLS / session / timeout)
All loaders (PriceData, FundamentalData, BlockTradeData) accept optional
arguments to control the underlying HTTP request:
from stocksurferbd import PriceData

# DSE's certificate chain is incomplete in some environments; disable TLS
# verification, reuse a session, or set a custom timeout if needed.
loader = PriceData(verify=False, session=None, timeout=60)
Defaults (verify=True, a fresh requests.Session, 30s timeout) preserve the
previous behaviour.
PriceData also accepts cache_dir=None. When set, closed CSE download chunks
(past years/months) are stored there as pandas pickles and reused by later
instances and processes, so a full CSE history is downloaded once per machine:
loader = PriceData(cache_dir='cse_cache')
Usage
Downloading historical price data of a single stock-
from stocksurferbd import PriceData

loader = PriceData()

loader.save_history_data(symbol='ACI', file_name='ACI_history.xlsx', market='DSE')
The above code will create a file named- ACI_history.xlsx.
It'll contain historical price data for ACI Limited in Dhaka Stock Exchange (DSE).
There are 3 parameters for this method-
symbol: Provide stock symbol of the company as string.file_name: Provide the name of the history data file as string.market: Provide the market name as string from which you want to download the data. Probable values are'CSE'and'DSE'start_date/end_date(optional): Bound the date range. Accept adate/datetimeor any parseable string. Defaults arestart_date=Noneandend_date=None(today). With nostart_date, DSE returns the window its archive serves by default (about 2 years; a DSE server limit), while CSE returns its full archive from 2015-11-24 (with gaps before mid-2018).
How CSE history is fetched. CSE does not publish per-symbol history; it publishes one spreadsheet of all symbols per date range. The library therefore downloads calendar-year chunks (about 95k rows / 4 MB / 20 s each), caches them on the
PriceDatainstance (and incache_dirif set) and filters to the symbol you asked for. The first CSE symbol with no dates costs ~11 downloads (3-4 minutes); every further symbol on the same instance is served from the cache in well under a second. For many symbols useget_day_end_range_dfonce and split byTRADING_CODE(see below).
Getting price data as a pandas DataFrame (instead of a file)-
from stocksurferbd import PriceData

loader = PriceData()

# Historical OHLCV for one symbol (includes the open price, OPENP).
hist_df = loader.get_price_history_df('ACI', market='DSE',
                                      start_date='2026-01-01', end_date='2026-06-22')

# Snapshot of all listed symbols' latest prices.
current_df = loader.get_current_price_df(market='DSE')

# Day-end OHLCV for ALL instruments on a single day (includes OPENP).
day_end_df = loader.get_day_end_df(date='2026-06-22', market='DSE')

# Day-end OHLCV for ALL instruments over a date range (both markets).
# This is the efficient way to pull many CSE symbols: one download per chunk.
range_df = loader.get_day_end_range_df('2020-01-01', '2026-06-22', market='CSE')
for symbol, frame in range_df.groupby('TRADING_CODE'):
    frame.to_excel(f'{symbol}_history.xlsx')
get_day_end_range_df(start_date, end_date=None, market='DSE', symbols=None, chunk='year', progress=True, use_cache=True):
| Parameter | Default | Meaning |
|---|---|---|
start_date |
required | inclusive lower bound |
end_date |
today | inclusive upper bound |
market |
'DSE' |
'DSE' loops the day-end archive once per calendar day (slower, skips non-trading days); 'CSE' downloads calendar chunks |
symbols |
all | iterable of trading codes to keep (case-insensitive) |
chunk |
'year' |
'year' or 'month' download granularity for CSE. Monthly means more but smaller requests: better retries, cheaper short recent ranges |
progress |
True |
True prints one line per download, False is silent, or a callable progress(chunk_start, chunk_end, index, total) |
use_cache |
True |
False bypasses (and does not populate) the CSE memory/disk caches, e.g. after the exchange restated a day |
save_day_end_range_data(file_path, file_name, market, start_date, end_date, **kwargs)
writes the same frame to one Excel file.
These mirror the DataFrame-returning methods on FundamentalData,
BlockTradeData and IndexData. save_history_data / save_current_data
are thin wrappers over them, so file output is unchanged.
Note: the live current-price feeds do not publish an open price, so
get_current_price_dfhas noOPENPcolumn for either market. For open prices useget_price_history_df(one symbol, date range) orget_day_end_df(all symbols, one day) — both read the day-end sources, which includeOPENP.The day-end sources are only populated after the session closes, so
get_day_end_df(date=today)called mid-session (or on a non-trading day) returns an empty DataFrame. Useget_current_price_dffor live intraday prices.For CSE,
DATEandCLOSEPin the current snapshot are taken from the exchange's same-day day-end download (CSE publishes a closing price distinct from the last trade). When that download has no rows yet,CLOSEPfalls back toLTPandDATEto the last trade date shown on the exchange site.% CHANGEis the absolute changeLTP - YCP, which is what DSE publishes under that name.
Downloading current market price data of all listed companies in DSE/CSE-
from stocksurferbd import PriceData

loader = PriceData()

loader.save_current_data(file_name='current_data.xlsx', market='DSE')
The above code will create a file named- current_history.xlsx in the current folder.
It'll contain current price data for all symbols.
There are 2 parameters for this method-
file_name: Provide the name of the current price data file as string.market: Provide the market name as string from which you want to download the data. Probable values ar'CSE'and'DSE'
Downloading fundamental data for a list of companies available in DSE-
from stocksurferbd import FundamentalData
loader = FundamentalData()

loader.save_company_data('ACI', path='company_info')
The above code will create two files named ACI_company_data.xlsx &
ACI_financial_data.xlsx in the company_info folder relative to
current directory. The file named ACI_company_data.xlsx contains
the fundamental data of ACI Limited for the current year and
ACI_financial_data.xlsx contains year-wise fundamental data according to DSE website.
There are 2 parameters save_company_data() this method-
symbol: Provide stock symbol of the company as string.path: Provide the name of the directory as string to save the company data.
The ACI_company_data.xlsx file also includes company identity and disclosure
columns: company_name, website, address, financial_statement_link and
price_sensitive_info_link.
Downloading company news / disclosures (last 2 years) from DSE-
from stocksurferbd import FundamentalData
loader = FundamentalData()

loader.save_news_data('ACI', path='company_info', years=2)
The above code creates ACI_news_data.xlsx in the company_info folder with
columns symbol, date, title and news, sorted newest first.
DSE only. Company fundamentals and news are sourced from the DSE website; CSE is not supported for these.
Parameters of save_news_data()-
symbol: Provide stock symbol of the company as string.path: Provide the directory as string to save the news data.years: Rolling time window in years (default2). Passyears=Noneto download all available news.
Downloading block trade data from DSE-
from stocksurferbd import BlockTradeData
loader = BlockTradeData()

# Current day's block transactions for all listed symbols
loader.save_block_trade_data(file_name='block_trade_data.xlsx', market='DSE')

# Block-market related disclosures for one company over the last 2 years
loader.save_block_trade_news_data('ACI', path='company_info', years=2)
DSE does not publish a historical block-trade archive, so
save_block_trade_data() stores the current day's actual block transactions
(DATE, TRADING_CODE, MAX_PRICE, MIN_PRICE, TRADES, QUANTITY,
VALUE_MN) — run it daily to build history. save_block_trade_news_data()
provides a historical per-company proxy from block-market related news.
Both methods also have get_block_trades_df() and get_block_trade_news_df()
variants that return a pandas DataFrame instead of writing a file.
DSE only. Block trade data is available for DSE only (
market='DSE'); CSE is not supported.
Downloading market index data (DSE: DSEX, DSES, DS30, DGEN, CDSET; CSE: CASPI, CSE30, CSCX, CSE50, CSI)-
from stocksurferbd import IndexData
loader = IndexData()

# Rolling ~30 trading days of day-wise index values (DSEX, DSES, DS30, DGEN)
loader.save_index_history(file_name='index_data.xlsx', market='DSE')

# Full historical archive for any date range (data available from ~2010 onward)
loader.save_index_history(
    file_name='dsex_2020.xlsx', market='DSE',
    start_date='2020-01-01', end_date='2020-12-31',
)

# Daily history for CDSET (or DS30) by month-count — CDSET goes back to ~2016
loader.save_index_graph(index='CDSET', months=120, file_name='CDSET_history.xlsx', market='DSE')

# Live snapshot of all indices, including CDSET
loader.save_current_indices(file_name='current_indices.xlsx', market='DSE')

# Current-day per-minute ticks for a single index (incl. CDSET)
loader.save_intraday(index='CDSET', file_name='CDSET_intraday.xlsx', market='DSE')

# CSE: same methods, same frame shapes
loader.save_current_indices(file_name='cse_indices.xlsx', market='CSE')
loader.save_index_history(file_name='cse_index_2025.xlsx', market='CSE',
                          start_date='2025-01-01', end_date='2025-12-31')
These scrape the aggregate index values (not per-company share tables). DSE serves the indices in a few different ways, so there are dedicated methods:
| Method | DSE indices | CSE indices | Coverage |
|---|---|---|---|
save_index_history / get_index_history_df |
DSEX, DSES, DS30, DGEN |
CASPI, CSE30, CSCX, CSE50, CSI |
rolling ~30 days by default; archive when start_date/end_date are given (DSE ~2010+, CSE late 2015+) |
save_index_graph / get_index_graph_df |
CDSET, DS30 |
not available | daily close over the last months (CDSET back to ~2016) |
save_current_indices / get_current_indices_df |
DSEX, DSES, DS30, CDSET |
CASPI, CSE30, CSCX, CSE50, CSI |
live snapshot |
save_intraday / get_intraday_df |
any one of the above (incl. CDSET) |
not available | current day, ~1-min ticks |
start_date / end_date accept a date/datetime or any parseable string
(e.g. '2024-01-01'). Passing only one bounds that side; the other defaults to
~2010 (start) or today (end). For save_index_graph, months is a count
(e.g. 120 for ~10 years).
Index availability varies by launch date.
DGENis legacy (pre-2013, blank in recent rows);DSEX/DS30start Jan 2013 andDSESstarts Jan 2014 in the day-wise archive.CDSETis absent from that archive — usesave_index_graph(index='CDSET', ...)for its daily history. CSE has no intraday or per-index graph source, sosave_intraday/save_index_graphraise formarket='CSE'.
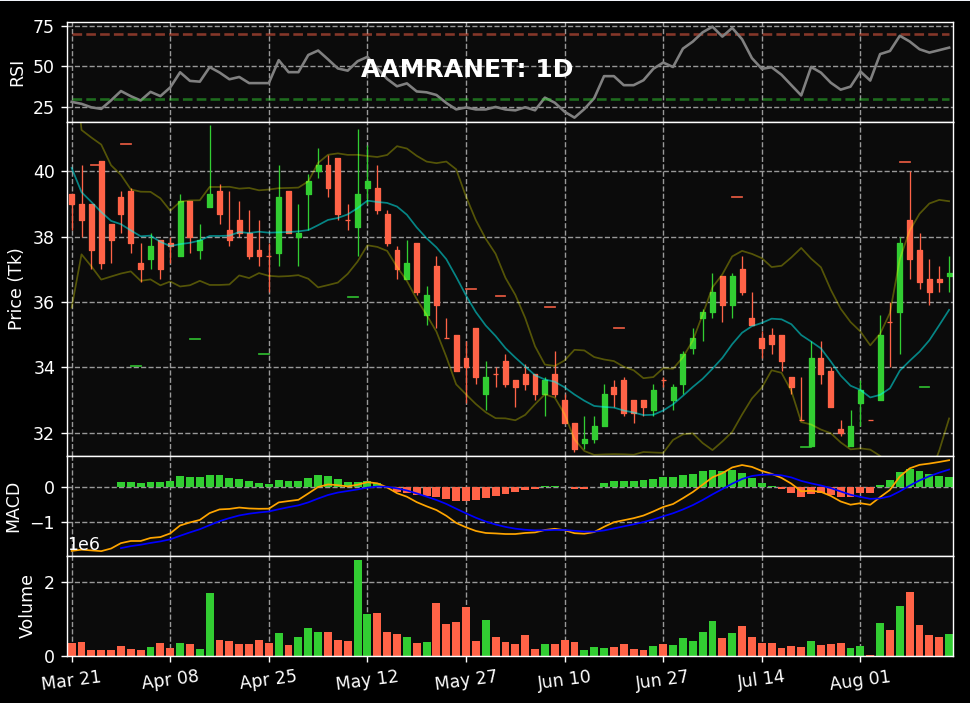
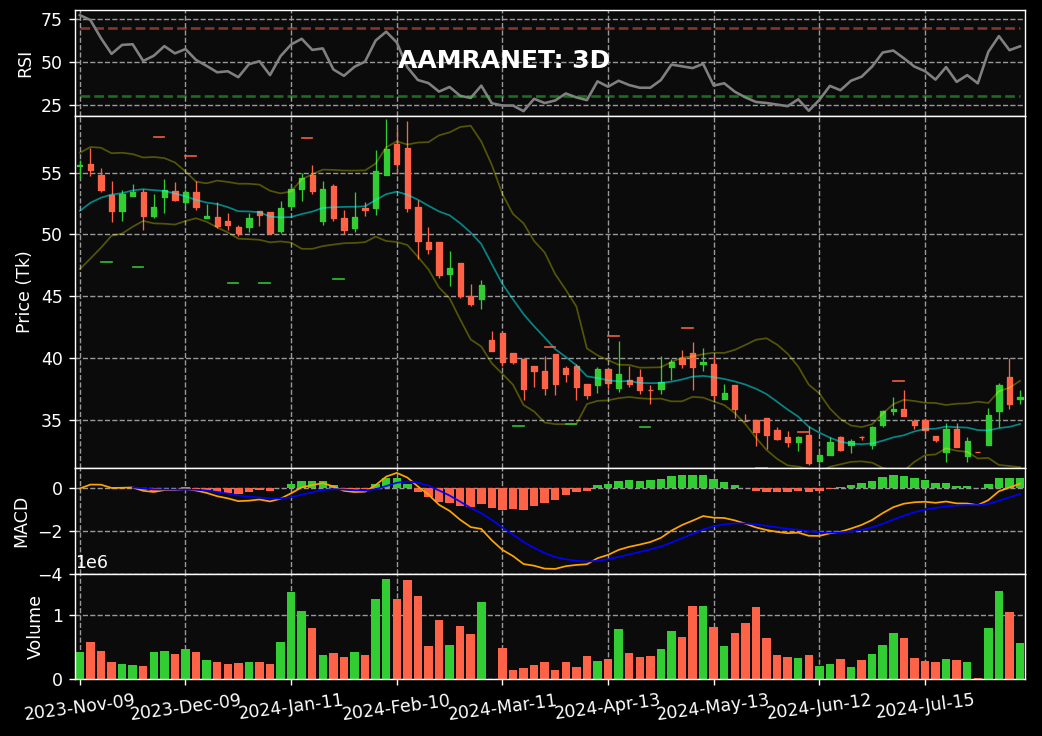
Create Candlestick charts for analyzing price history-
from stocksurferbd import CandlestickPlot

cd_plot = CandlestickPlot(file_path='ACI_history.xlsx', symbol='ACI')
cd_plot.show_plot(
    data_n=120,
    resample=True,
    step='3D'
)
The above code will create a Candlestick plot like the ones provided by Stock broker trading panels.
There are 2 parameters __init__() method of CandlestickPlot class-
file_path: Provide the path of history file as string to generate plotsymbol: Provide stock symbol of the company as string.
There are also 3 parameters show_plot() method-
data_n: Provide an integer value. It sets the count of how many recent data points needs to be plotted.resample: Provide booleanTrueorFalse. SetTrueif you want to plot daily data aggregated by multiple days.step: Only Active whenresample=True. Valid values are in the form-'3D'and'7D'for 3 days plots and weekly plots respectively.
The following are some example images of Candlestick plots-
Output data schema
Each method writes an .xlsx file (and the get_*_df variants return the same
data as a pandas DataFrame). The columns of each output are listed below.
The schemas below are identical for market='DSE' and market='CSE'.
Price history — PriceData.save_history_data / get_price_history_df, day-end — get_day_end_df / get_day_end_range_df
DATE, TRADING_CODE, LTP, HIGH, LOW, OPENP, CLOSEP, YCP, TRADE, VALUE_MN, VOLUME
DATE is a YYYY-MM-DD string, TRADING_CODE a string, every other column a
float; rows are newest first. VALUE_MN is in millions of Taka.
Current prices — PriceData.save_current_data / get_current_price_df
DATE, TRADING_CODE, LTP, HIGH, LOW, CLOSEP, YCP, % CHANGE, TRADE, VALUE_MN, VOLUME
DATE is a datetime.date; % CHANGE is the absolute change LTP - YCP.
Note: the price files are written with the DataFrame index, so they also contain a leading unnamed index column.
Company data — FundamentalData.save_company_data → <symbol>_company_data.xlsx
One row per company. Columns, grouped:
- Identity / links (new in 1.0.0):
company_name,website,address,financial_statement_link,price_sensitive_info_link - Basic:
symbol,auth_capital,trade_start,paid_up_capital,instrument_type,face_value,market_lot,ltp,last_agm_date,market_cap,outstanding_share,sector,listing_year,market_category - Dividend / reserves:
right_issue,year_end,reserve_w_oci,others_oci,cash_dividend_p,cash_dividend_year,stock_dividend_p,stock_dividend_year - Shareholding %:
sh_director,sh_govt,sh_inst,sh_foreign,sh_public - Interim EPS (
_q1,_q2,_hy,_q3,_9m,_yrsuffixes):eps_basic_*,eps_diluted_*,eps_cop_basic_*,eps_cop_diluted_*
The identity/links columns are appended at the end, so existing column positions are unchanged (backward compatible).
Financial data — FundamentalData.save_company_data → <symbol>_financial_data.xlsx
One row per financial year:
symbol, year, eps_original, eps_restated, eps_diluted,
eps_cop_original, eps_cop_restated, eps_cop_diluted, nav_original,
nav_restated, nav_diluted, pco, profit, tci, pe_original,
pe_restated, pe_diluted, pe_cop_original, pe_cop_restated,
pe_cop_diluted, dividend_p, dividend_yield_p
Company news — FundamentalData.save_news_data → <symbol>_news_data.xlsx (new in 1.0.0)
One row per news item, newest first:
symbol, date, title, news
Block trades (current day) — BlockTradeData.save_block_trade_data (new in 1.0.0)
One row per block transaction for the latest trading day:
DATE, TRADING_CODE, MAX_PRICE, MIN_PRICE, TRADES, QUANTITY, VALUE_MN
Market indices — IndexData
| Method | Columns |
|---|---|
save_index_history |
DATE, TOTAL_TRADE, TOTAL_VOLUME, VALUE_MN, MARKET_CAP_MN, then one column per index: DSEX, DSES, DS30, DGEN (DSE) or CASPI, CSE30, CSCX, CSE50, CSI (CSE) |
save_index_graph |
INDEX, DATE, POINTS |
save_current_indices |
INDEX, POINTS, CHANGE, PCT_CHANGE (one row per index; CHANGE/PCT_CHANGE are blank for CDSET; both markets) |
save_intraday |
INDEX, DATETIME, POINTS |
Block-trade news proxy — BlockTradeData.save_block_trade_news_data → <symbol>_block_trade_news.xlsx (new in 1.0.0)
Block-market related disclosures (a filtered view of the news feed):
symbol, date, title, news
If you want to contribute
Any contribution would be highly appreciated. Kindly go through the guidelines for contributing.
1 maintainer

Metadata
1 maintainer
Release files for stocksurferbd 2.0.0
For a detailed explanation of source distributions (sdists) and built distributions (wheels), please see the package formats documentation.
Source distribution (sdist)
| File | Size | Uploaded | |
|---|---|---|---|
| stocksurferbd-2.0.0.tar.gz | 35.6 kB | Details |
Built distribution (wheel)
| File | Interpreter | ABI | Platform | Reset |
|---|---|---|---|---|
| stocksurferbd-2.0.0-py3-none-any.whl | Python 3 | none | any | Details |
Total release size: 69.4 kB
Release files / stocksurferbd-2.0.0.tar.gz
| Download URL | stocksurferbd-2.0.0.tar.gz |
|---|---|
| Size | 35.6 kB |
| Tags | Source |
|
SHA-256 checksum How to use checksums |
a6d7056179573f2de736f61dab1d175b21aad3a385234dd3e735511cb6913285
|
|
BLAKE2b-256 checksum How to use checksums |
132a2f4bd287daee075c52f0b76f9523cbec2a055c9de0b56ec3dc51eb3aac3b
|
| Upload date | |
|
Uploaded using Trusted Publishing? What is trusted publishing? |
Yes |
| Uploaded via |
twine/7.0.0 CPython/3.13.14
|
Provenance
Provenance describes where a file came from. On PyPI, provenance is shared via attestations, which provide a verifiable record of the build or publishing details. View details, limitations and caveats.


PyPI Publish Attestation
PyPI verified that this artifact, at this checksum, originated from the publisher listed below.
Signed by GitHub Actions, verified by PyPI on Sep 16, 2026.
Transparency logRelease files / stocksurferbd-2.0.0-py3-none-any.whl
| Download URL | stocksurferbd-2.0.0-py3-none-any.whl |
|---|---|
| Size | 33.8 kB |
| Tags | Python 3 |
|
SHA-256 checksum How to use checksums |
f3ad6597cc950770820b7f913c0fe18b75cc61d1dac6f923ea2b010a9f53d269
|
|
BLAKE2b-256 checksum How to use checksums |
ac2670e6216bef2b88c9cf8fdd4dd5a3952067d672b2209ad4395cd981d67f9f
|
| Upload date | |
|
Uploaded using Trusted Publishing? What is trusted publishing? |
Yes |
| Uploaded via |
twine/7.0.0 CPython/3.13.14
|
Provenance
Provenance describes where a file came from. On PyPI, provenance is shared via attestations, which provide a verifiable record of the build or publishing details. View details, limitations and caveats.
PyPI Publish Attestation
PyPI verified that this artifact, at this checksum, originated from the publisher listed below.
Signed by GitHub Actions, verified by PyPI on Sep 16, 2026.
Transparency log













