A comprehensive GPU memory profiler for PyTorch and TensorFlow with CLI, visualization, and analytics


Project description
Stormlog


Interactive Textual dashboard with live monitoring, visualizations, and CLI automation.
A production-ready, open source tool for real-time GPU memory profiling, leak detection, and optimization in PyTorch and TensorFlow deep learning workflows.
Why use Stormlog?
- Prevent Out-of-Memory Crashes: Catch memory leaks and inefficiencies before they crash your training.
- Optimize Model Performance: Get actionable insights and recommendations for memory usage.
- Works with PyTorch & TensorFlow: Unified interface for both major frameworks.
- Beautiful Visualizations: Timeline plots, heatmaps, and interactive dashboards.
- CLI & API: Use from Python or the command line.
Features
- Real-time GPU memory monitoring
- Memory leak detection & alerts
- Interactive and static visualizations
- Context-aware profiling (decorators, context managers)
- CLI tools for automation
- Data export (CSV, JSON)
- CPU compatibility mode
Installation
From PyPI
Package page: https://pypi.org/project/stormlog/
# Basic installation
pip install stormlog

# With visualization support
pip install stormlog[viz]

# With optional dependencies
pip install stormlog[torch]  # PyTorch support
pip install stormlog[tf]     # TensorFlow support
pip install stormlog[all]    # Both frameworks
pip install stormlog[dev]    # Development tools
pip install stormlog[test]   # Testing dependencies
pip install stormlog[docs]   # Documentation tools
From Source
git clone https://github.com/Silas-Asamoah/stormlog.git
cd stormlog

# Install in development mode
pip install -e .

# Install with visualization support
pip install -e .[viz]

# Install framework extras
pip install -e .[torch]
pip install -e .[tf]
pip install -e .[all]

# Install with development dependencies
pip install -e .[dev]

# Install with testing dependencies
pip install -e .[test]
Development Setup
# Clone and setup development environment
git clone https://github.com/Silas-Asamoah/stormlog.git
cd stormlog
python3 -m venv venv
source venv/bin/activate  # On Windows: venv\Scripts\activate
pip install -e .[dev,test]
# Optional: include framework extras for integration tests
pip install -e .[dev,test,all]
pre-commit install
Note: Black formatting check is temporarily disabled in CI. Code formatting will be addressed in a separate PR.
Quick Start
PyTorch Example
from gpumemprof import GPUMemoryProfiler
profiler = GPUMemoryProfiler()

def train_step(model, data, target):
    output = model(data)
    loss = ...
    loss.backward()
    return loss

profile = profiler.profile_function(train_step, model, data, target)
summary = profiler.get_summary()
print(f"Profiled call: {profile.function_name}")
print(f"Peak memory: {summary['peak_memory_usage'] / (1024**3):.2f} GB")
TensorFlow Example
from tfmemprof import TFMemoryProfiler
profiler = TFMemoryProfiler()
with profiler.profile_context("training"):
    model.fit(x_train, y_train, epochs=5)
results = profiler.get_results()
print(f"Peak memory: {results.peak_memory_mb:.2f} MB")
Documentation
Start at the docs home page and follow the same structure locally or when hosted:
Key guides:
- CLI Usage
- CPU Compatibility
- Compatibility Matrix (v0.2)
- GPU Setup (drivers + frameworks)
- Testing Guides, TensorFlow
- Example Test Guides (Markdown)
- Terminal UI (Textual)
- In-depth Article
- Example scripts
- Launch scenario scripts
Launch QA Scenarios (CPU + MPS + Telemetry + OOM)
Run the capability matrix for a launch-oriented smoke pass:
python -m examples.cli.capability_matrix --mode smoke --target both --oom-mode simulated
Run the full matrix (includes extra demos):
python -m examples.cli.capability_matrix --mode full --target both --oom-mode simulated
Key scenario modules:
python -m examples.scenarios.cpu_telemetry_scenario
python -m examples.scenarios.mps_telemetry_scenario
python -m examples.scenarios.oom_flight_recorder_scenario --mode simulated
python -m examples.scenarios.tf_end_to_end_scenario
Terminal UI
Prefer an interactive dashboard? Install the optional TUI dependencies and launch the Textual interface:
pip install "stormlog[tui]"
stormlog
The TUI surfaces system info, PyTorch/TensorFlow quick actions, and CLI tips. Future prompt_toolkit enhancements will add a command palette for advanced workflows—see docs/tui.md for details.
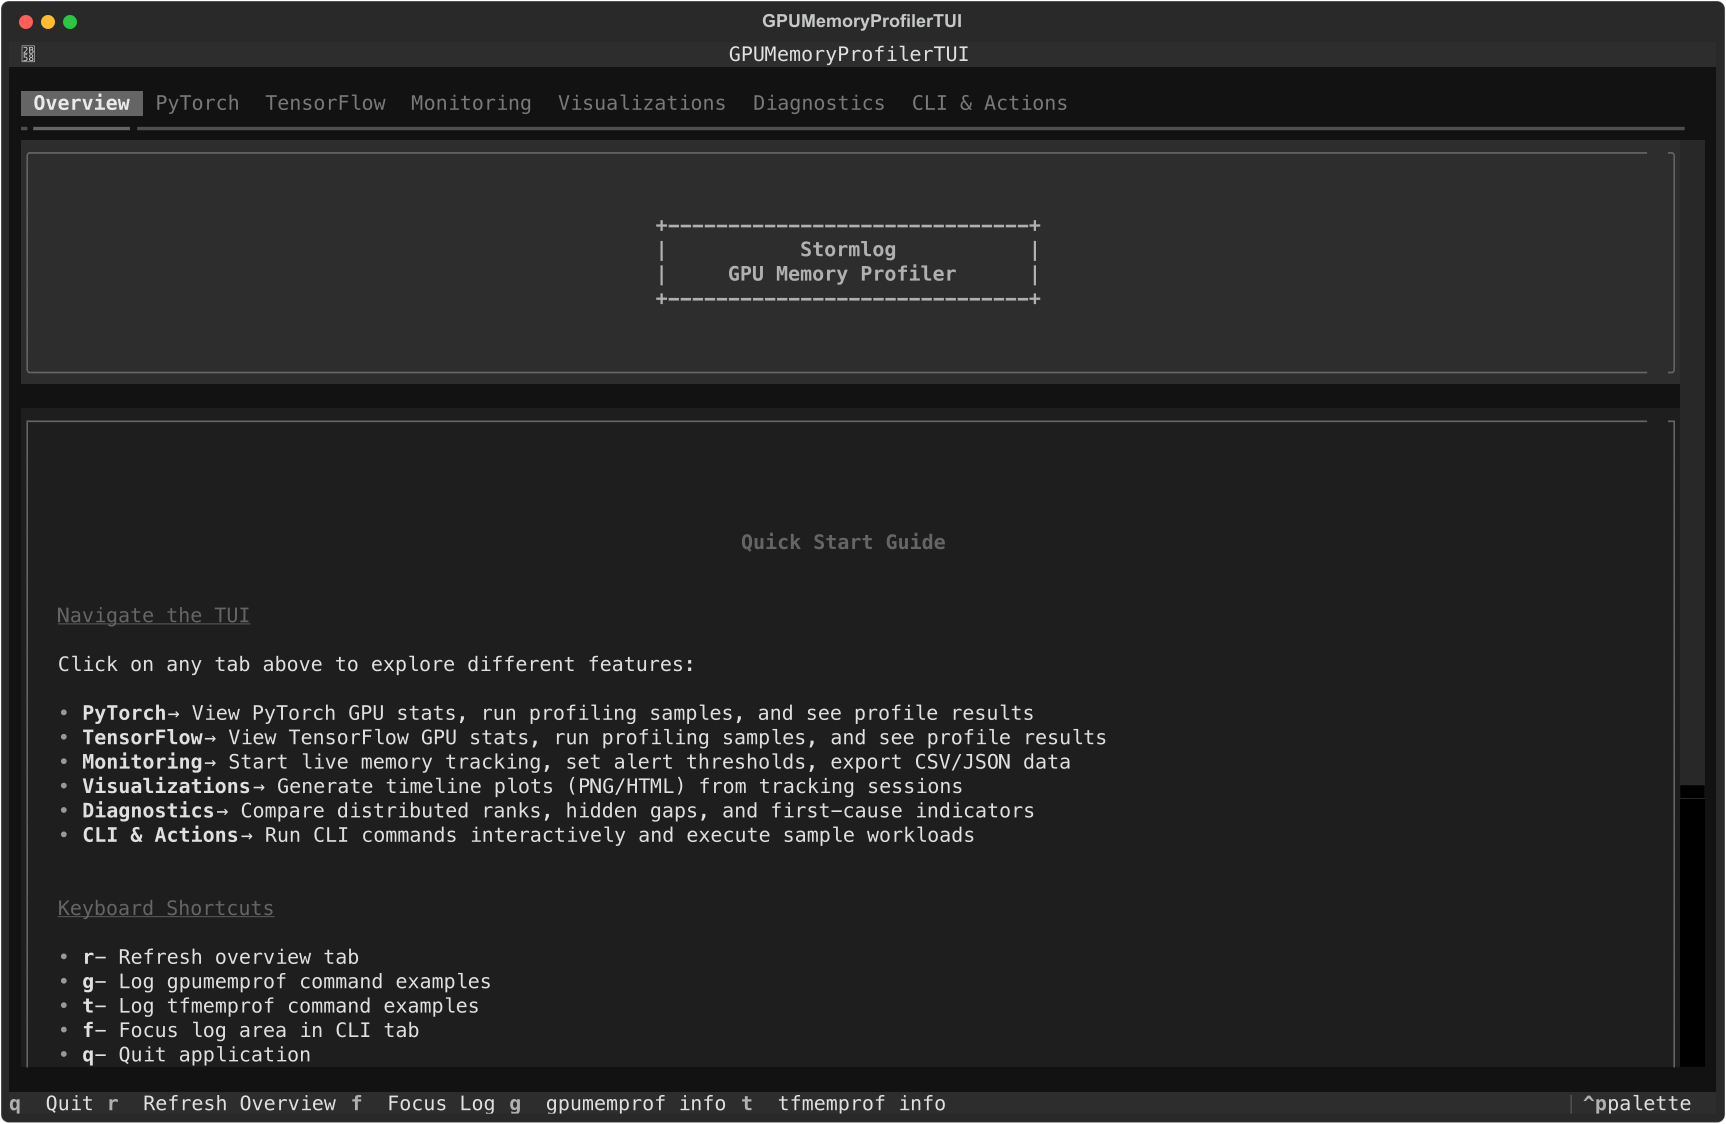
Overview, PyTorch, and TensorFlow tabs inside the Textual dashboard.
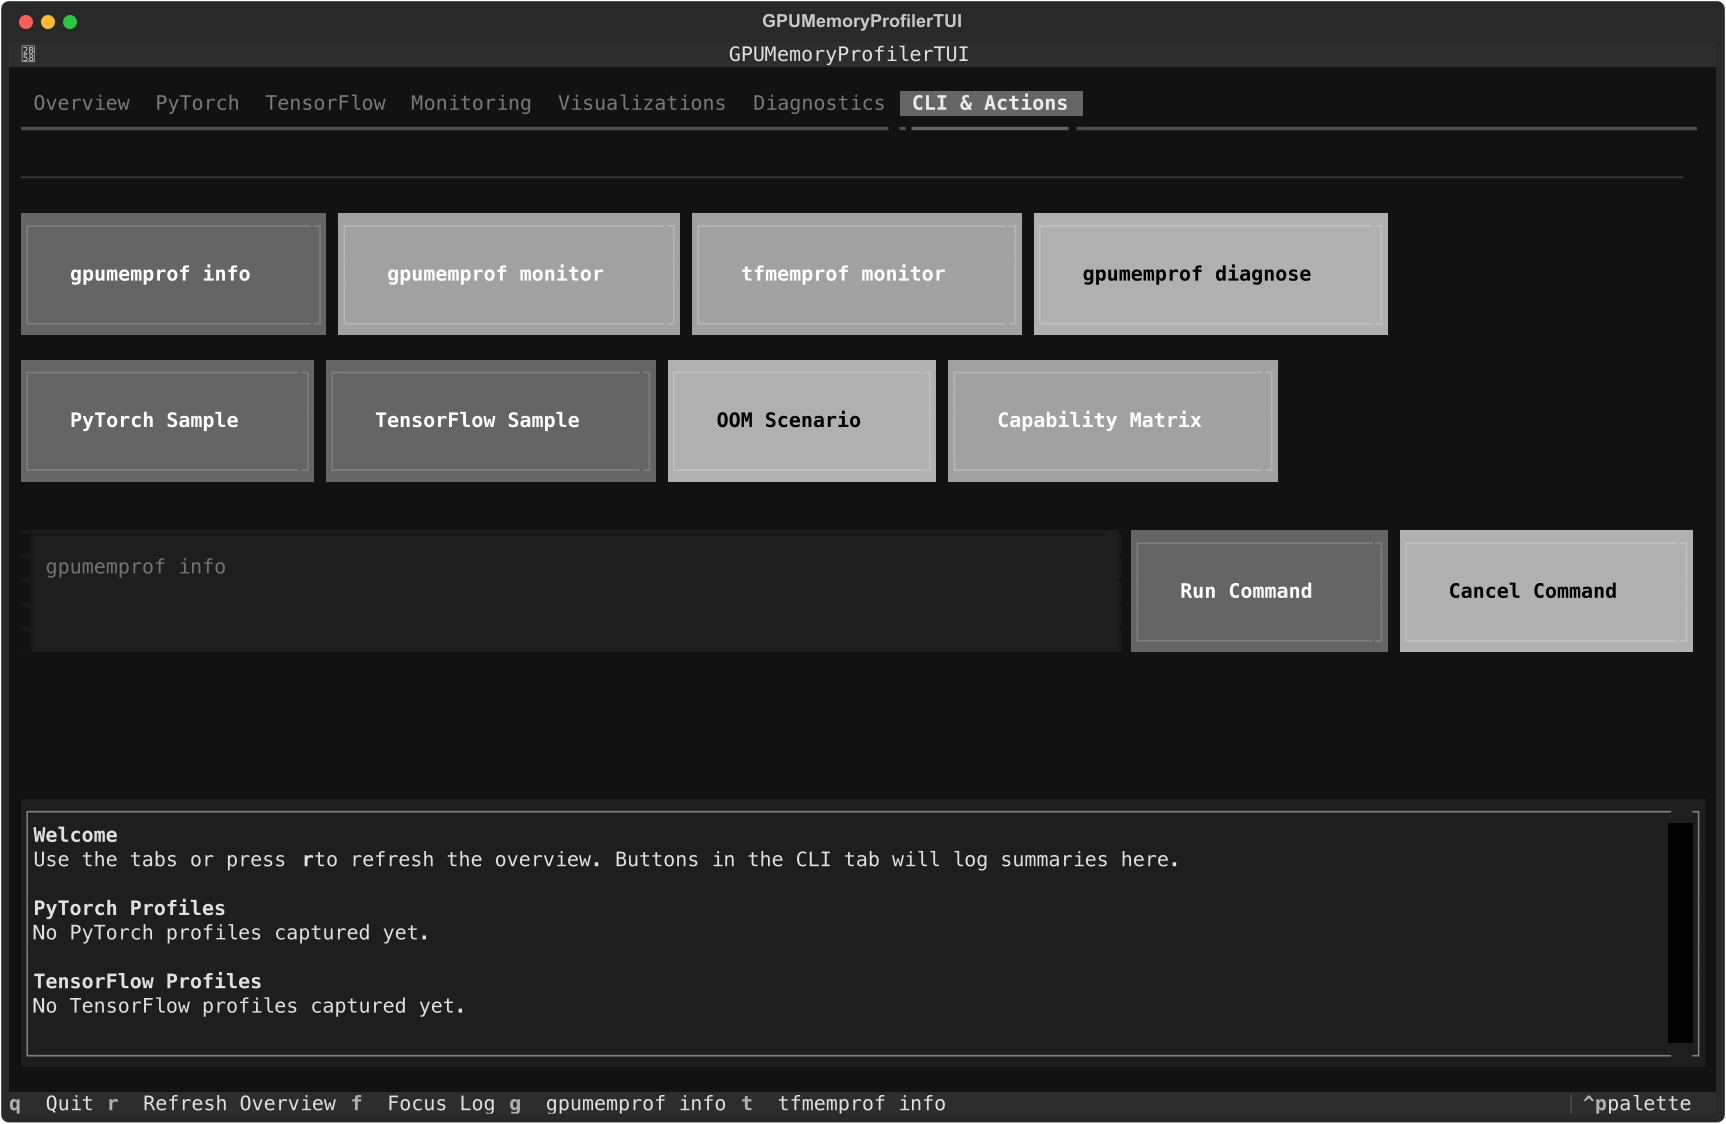
CLI & Actions tab with quick commands, loaders, and log output.
Need charts without leaving the terminal? The new Visualizations tab renders
an ASCII timeline from the live tracker and can export the same data to PNG
(Matplotlib) or HTML (Plotly) under ./visualizations for deeper inspection.
Just start tracking, refresh the tab, and hit the export buttons.
Need fast distributed triage? The Diagnostics tab loads live telemetry or
merged artifacts (JSON, CSV, diagnose directories), then renders per-rank
delta/gap diagnostics, timeline comparisons, and first-cause indicators
(earliest + most severe). It also handles partial rank availability and
supports rank filters like 0,2,4-7.

Distributed Diagnostics tab workflow (live + artifact inputs, rank table, timeline compare, anomaly summary).
The PyTorch and TensorFlow tabs now surface recent decorator/context profiling
results as live tables—with refresh/clear controls—so you can review peak
memory, deltas, and durations gathered via gpumemprof.context_profiler or
tfmemprof.context_profiler without leaving the dashboard.
When the monitoring session is running you can also dump every tracked event to
./exports/tracker_events_<timestamp>.{csv,json} directly from the Monitoring
tab, making it easy to feed the same data into pandas, spreadsheets, or external
dashboards.
Need tighter leak warnings? Adjust the warning/critical sliders in the same tab
to update GPU MemoryTracker thresholds on the fly, and use the inline alert
history to review exactly when spikes occurred.
Need to run automation without opening another terminal? Use the CLI tab’s
command input (or quick action buttons) to execute gpumemprof /
tfmemprof commands in-place, trigger gpumemprof diagnose, run the OOM
flight-recorder scenario, and launch the capability-matrix smoke checks with a
single click.
CPU Compatibility
Working on a laptop or CI agent without CUDA? The CLI, Python API, and TUI now
fall back to a psutil-powered CPUMemoryProfiler/CPUMemoryTracker. Run the
same gpumemprof monitor / gpumemprof track commands and you’ll see RSS data
instead of GPU VRAM, exportable to CSV/JSON and viewable inside the monitoring
tab. PyTorch sample workloads automatically switch to CPU tensors when CUDA
isn’t present, so every workflow stays accessible regardless of hardware.
Contributing
We welcome contributions! See CONTRIBUTING.md and CODE_OF_CONDUCT.md.
License
Version: 0.2.0 (launch candidate)
Release history Release notifications | RSS feed


Download files
Download the file for your platform. If you're not sure which to choose, learn more about installing packages.
Source Distribution
Built Distribution
Filter files by name, interpreter, ABI, and platform.
If you're not sure about the file name format, learn more about wheel file names.
Copy a direct link to the current filters
File details
Details for the file stormlog-0.2.3.tar.gz.
File metadata
- Download URL: stormlog-0.2.3.tar.gz
- Upload date:
- Size: 2.3 MB
- Tags: Source
- Uploaded using Trusted Publishing? No
- Uploaded via: twine/6.2.0 CPython/3.10.19
File hashes
| Algorithm | Hash digest | |
|---|---|---|
| SHA256 |
831aa0cfa8429659c03fe3f95227168f322db08ecefc228272ed875fe977e94a
|
|
| MD5 |
7717f49bc4f7b667fe7f7d5eb18426bd
|
|
| BLAKE2b-256 |
4bb5146f59738ba76e977cb8833d65c3140f2a655e086acc9f970f51e280dcb1
|
File details
Details for the file stormlog-0.2.3-py3-none-any.whl.
File metadata
- Download URL: stormlog-0.2.3-py3-none-any.whl
- Upload date:
- Size: 146.7 kB
- Tags: Python 3
- Uploaded using Trusted Publishing? No
- Uploaded via: twine/6.2.0 CPython/3.10.19
File hashes
| Algorithm | Hash digest | |
|---|---|---|
| SHA256 |
8e79126e36589c7b1df60a6a95141eca9e555daad2545dd0b39a65e89a8ba9f3
|
|
| MD5 |
ff3e94b7ad0e5956be270322985ed899
|
|
| BLAKE2b-256 |
c508ac7c379e6b386853d9e932354e99b76dcc0b0913fbb047b43c9ee00b850b
|


