A comprehensive GPU memory profiler for PyTorch and TensorFlow with CLI, visualization, and analytics


Project description
Stormlog


Current Textual workflow: monitoring, visualization export, diagnostics, and CLI actions.
Stormlog is a memory-profiling toolkit for day-to-day PyTorch and TensorFlow work. It combines Python APIs, CLI commands, and a Textual TUI so you can move from "what is using memory?" to saved artifacts and shareable diagnostics without switching tools.
Why use this tool
- Catch memory growth before it becomes an OOM.
- Compare allocated vs reserved usage during training and inference.
- Export telemetry and diagnose bundles for CI or release triage.
- Load the same artifacts into a terminal UI for faster debugging.
- Keep workflows available on CPU-only and MPS systems, not just CUDA boxes.
Installation
From PyPI
pip install stormlog
pip install "stormlog[viz]"
pip install "stormlog[tui,torch]"
pip install "stormlog[torch]"
pip install "stormlog[tf]"
pip install "stormlog[all]"
Package and import names
stormlog is the distribution name on PyPI. The installed Python modules remain
backend-specific:
| Task | Use |
|---|---|
| Install the package | pip install stormlog |
| Launch the TUI | stormlog |
| Import PyTorch APIs | from gpumemprof import GPUMemoryProfiler, MemoryTracker |
| Import TensorFlow APIs | from tfmemprof import TFMemoryProfiler |
There is no top-level stormlog Python module today.
From source
git clone https://github.com/Silas-Asamoah/stormlog.git
cd stormlog
pip install -e .
pip install -e ".[viz,tui,torch]"
If you want both framework extras in a development checkout:
pip install -e ".[dev,test,all,tui,viz]"
Quick start
CLI-first workflow
This is the fastest path to verify an environment and produce an artifact you can inspect later:
gpumemprof info
gpumemprof track --duration 2 --interval 0.5 --output /tmp/gpumemprof_track.json --format json
gpumemprof analyze /tmp/gpumemprof_track.json --format txt --output /tmp/gpumemprof_analysis.txt
gpumemprof diagnose --duration 0 --output /tmp/gpumemprof_diag

tfmemprof info
tfmemprof diagnose --duration 0 --output /tmp/tf_diag
PyTorch API workflow
GPUMemoryProfiler currently targets PyTorch runtimes exposed through
torch.cuda, which covers NVIDIA CUDA and ROCm-backed builds. On Apple MPS or
CPU-only systems, use MemoryTracker, the CLI, or CPUMemoryProfiler instead.
import torch
from gpumemprof import GPUMemoryProfiler

profiler = GPUMemoryProfiler()
device = profiler.device
model = torch.nn.Linear(1024, 128).to(device)

def train_step() -> torch.Tensor:
    x = torch.randn(64, 1024, device=device)
    y = model(x)
    return y.sum()

profile = profiler.profile_function(train_step)
summary = profiler.get_summary()

print(profile.function_name)
print(f"Peak memory: {summary['peak_memory_usage'] / (1024**3):.2f} GB")
TensorFlow API workflow
TFMemoryProfiler works on GPU or CPU-backed TensorFlow runtimes.
from tfmemprof import TFMemoryProfiler

profiler = TFMemoryProfiler(enable_tensor_tracking=True)

with profiler.profile_context("training"):
    model.fit(x_train, y_train, epochs=1, batch_size=32)

results = profiler.get_results()
print(f"Peak memory: {results.peak_memory_mb:.2f} MB")
print(f"Snapshots captured: {len(results.snapshots)}")
Daily workflows
ML engineer
- instrument a training step with
GPUMemoryProfilerorTFMemoryProfiler - switch to
trackwhen you need telemetry over time - export plots or analyze saved telemetry later
Researcher debugging regressions
- capture
trackoutput or adiagnosebundle - open the same artifacts in the TUI diagnostics and visualizations tabs
- compare growth, gaps, and per-rank behavior before changing model code
CI or release owner
- run
python -m examples.cli.quickstart - run
python -m examples.cli.capability_matrix --mode smoke --target both --oom-mode simulated - archive the emitted artifacts for later triage in the TUI
Terminal UI
Install the optional TUI dependencies and launch:
pip install "stormlog[tui,torch]"
stormlog
The current TUI startup path imports PyTorch immediately, so stormlog[tui] alone is not enough yet.
The current TUI tabs are:
OverviewPyTorchTensorFlowMonitoringVisualizationsDiagnosticsCLI & Actions
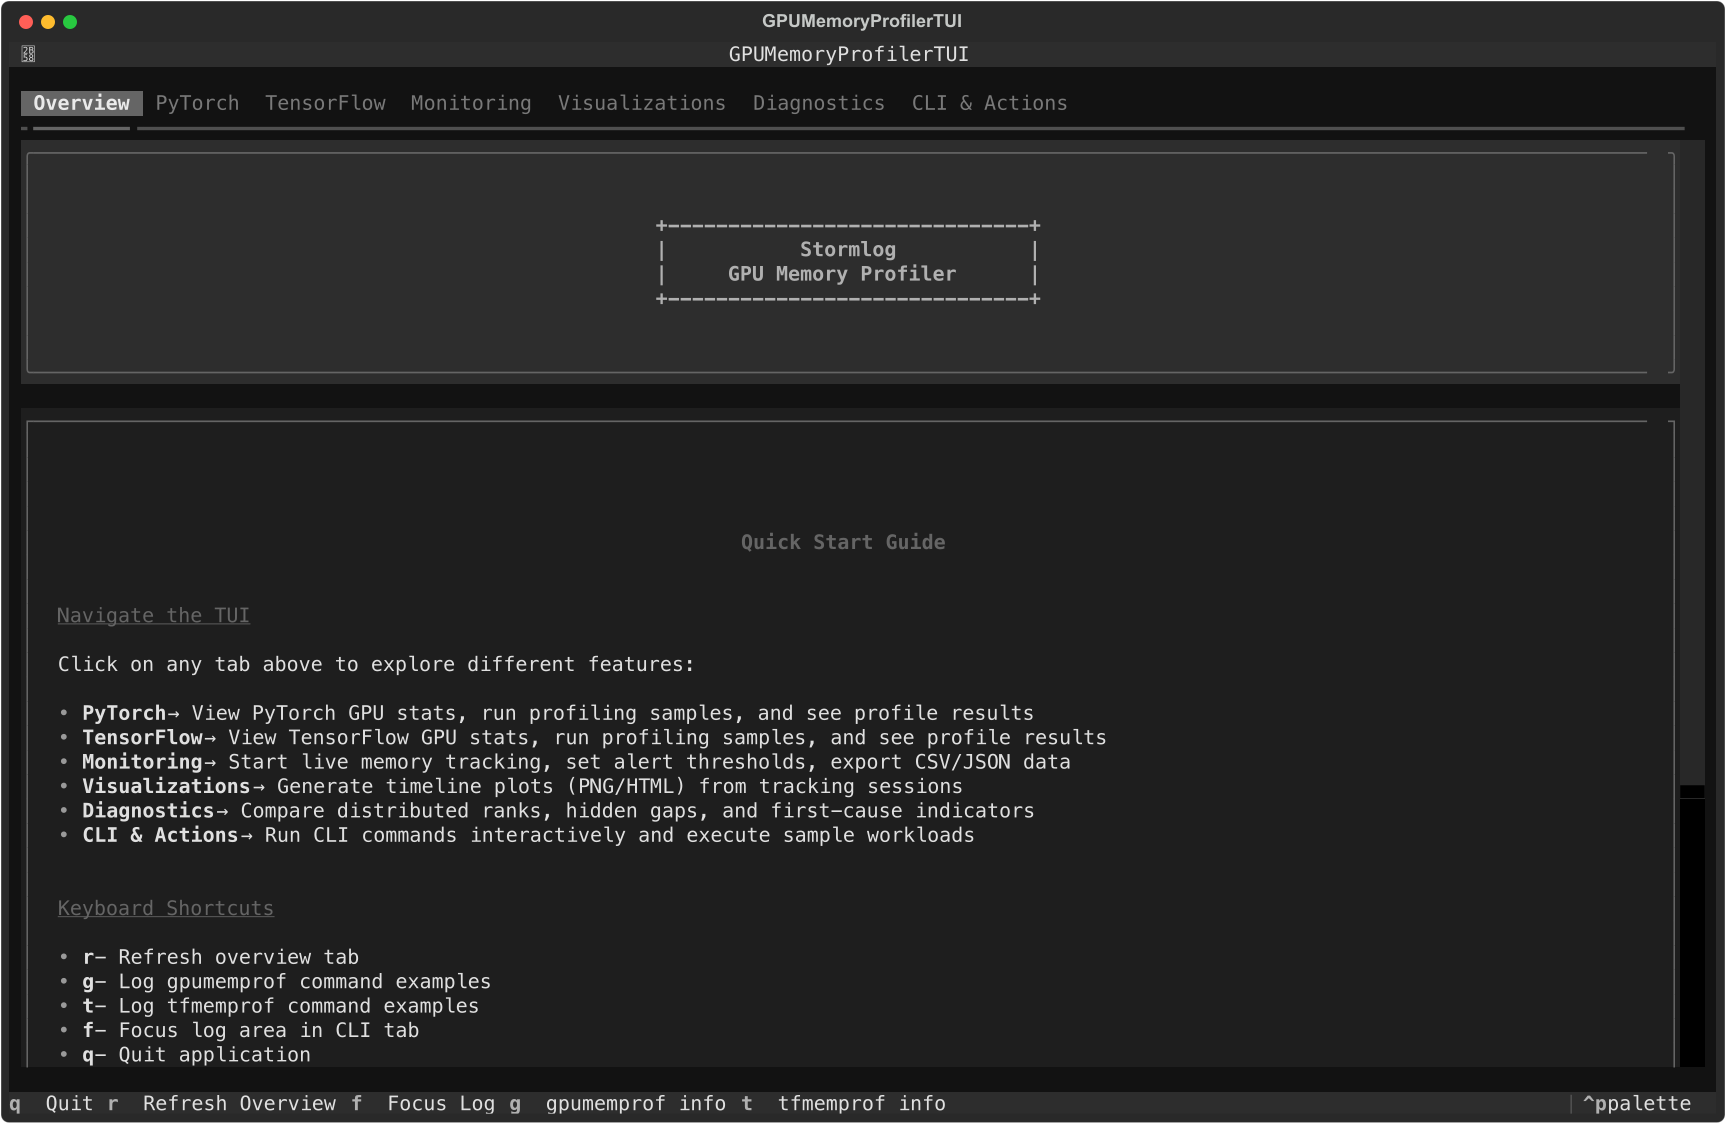
Overview tab with current system summary and navigation guidance.
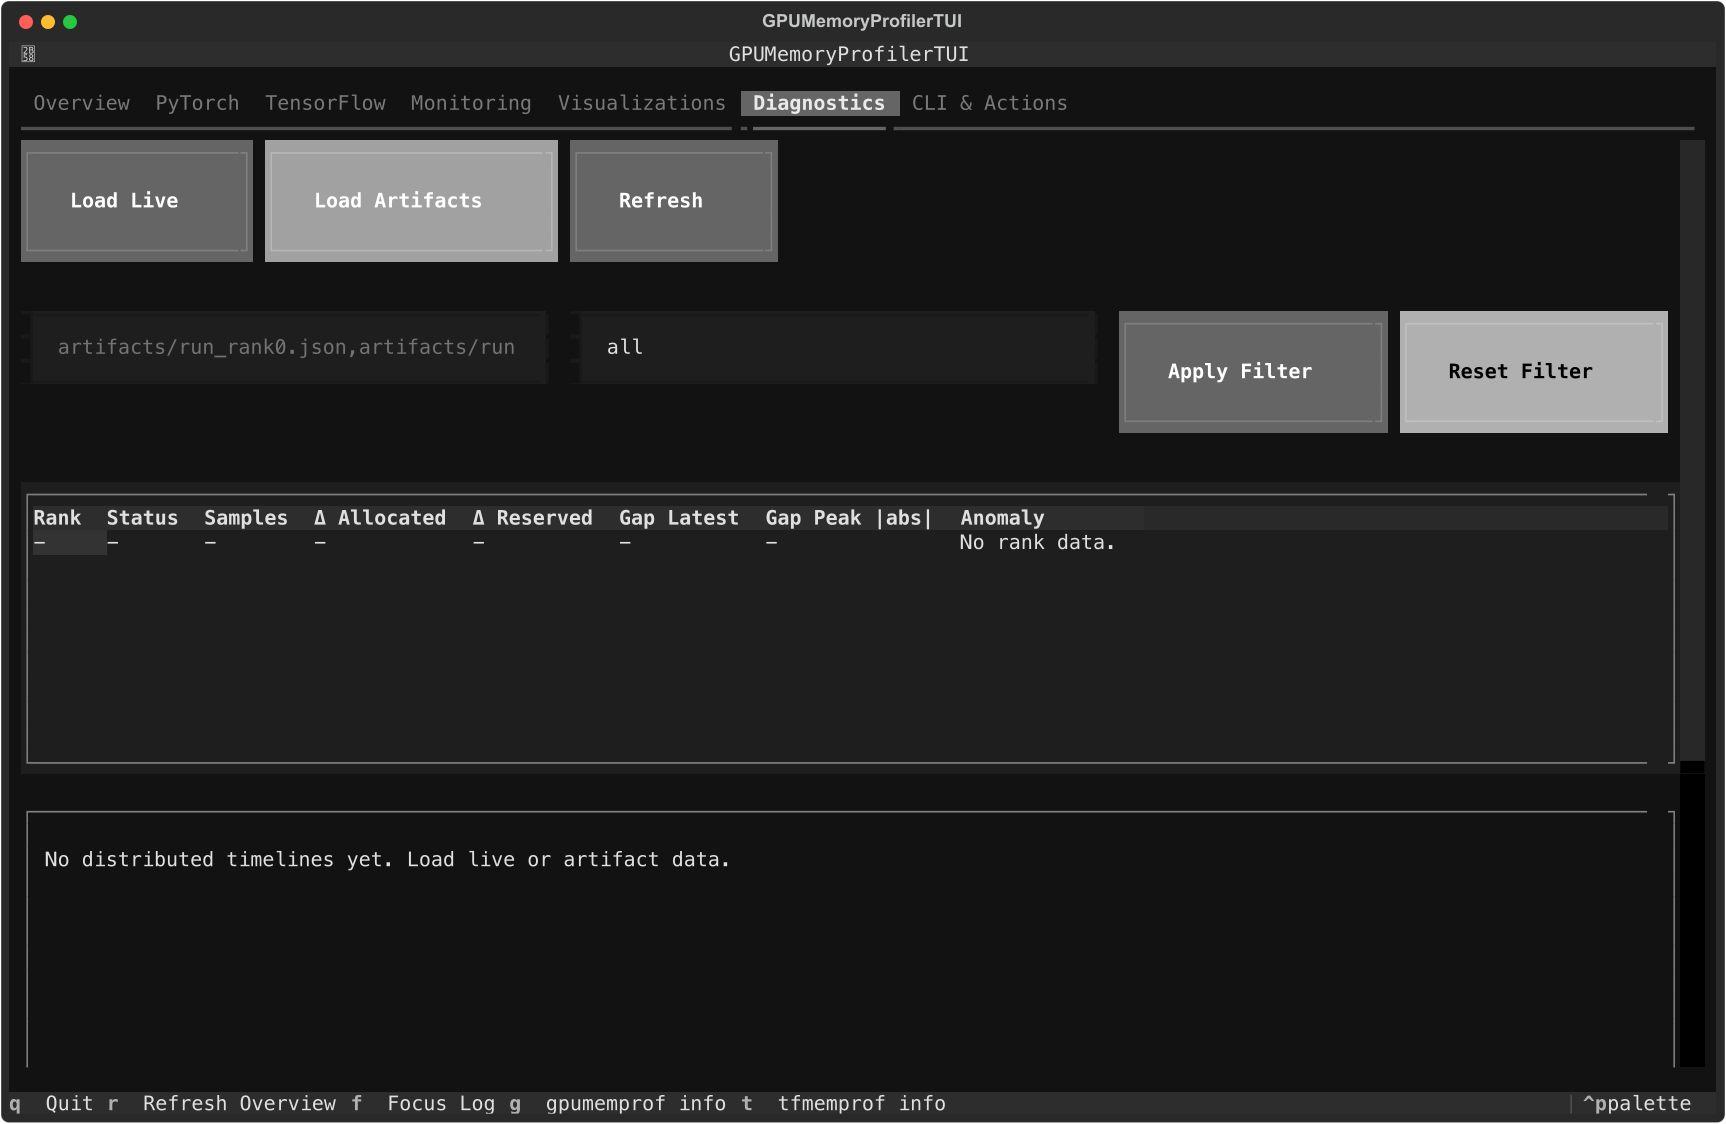
Diagnostics tab with the current artifact loader, rank table, and timeline panes.
Use the Monitoring tab to start live tracking, export CSV or JSON events to ./exports, and tune warning or critical thresholds. In Visualizations, refresh the live timeline and save PNG or HTML exports under ./visualizations. In Diagnostics, load live telemetry or artifact paths and rebuild rank-level diagnostics without leaving the terminal.
For screen-by-screen details, see docs/tui.md.
Examples and walkthroughs
- Documentation home
- Installation guide
- Usage guide
- CLI guide
- Examples guide
- Testing guide
- PyTorch guide
- TensorFlow guide
- Long-form article
Launch QA scenarios
python -m examples.cli.quickstart
python -m examples.cli.capability_matrix --mode smoke --target both --oom-mode simulated
python -m examples.scenarios.cpu_telemetry_scenario
python -m examples.scenarios.oom_flight_recorder_scenario --mode simulated
CPU-only and laptop workflows
If CUDA is not available, Stormlog still supports:
gpumemprof infogpumemprof monitorgpumemprof trackCPUMemoryProfilerCPUMemoryTracker- the TUI overview, monitoring, diagnostics, and CLI tabs
See docs/cpu_compatibility.md for the CPU-only path.
Contributing
See CONTRIBUTING.md and CODE_OF_CONDUCT.md.
License
Release history Release notifications | RSS feed


Download files
Download the file for your platform. If you're not sure which to choose, learn more about installing packages.
Source Distribution
Built Distribution
Filter files by name, interpreter, ABI, and platform.
If you're not sure about the file name format, learn more about wheel file names.
Copy a direct link to the current filters
File details
Details for the file stormlog-0.2.4.tar.gz.
File metadata
- Download URL: stormlog-0.2.4.tar.gz
- Upload date:
- Size: 6.0 MB
- Tags: Source
- Uploaded using Trusted Publishing? No
- Uploaded via: twine/6.2.0 CPython/3.10.19
File hashes
| Algorithm | Hash digest | |
|---|---|---|
| SHA256 |
3a03834e92523707275bf5b8f30d019283afcfdc813607e458bd0dab4b107cfc
|
|
| MD5 |
7201dfead0d5bfc9b603acbfdb0a53a3
|
|
| BLAKE2b-256 |
fd656aea0b70e618ea5501eb63c42aba3e038018c527387d8ebb13d91a217b32
|
File details
Details for the file stormlog-0.2.4-py3-none-any.whl.
File metadata
- Download URL: stormlog-0.2.4-py3-none-any.whl
- Upload date:
- Size: 145.9 kB
- Tags: Python 3
- Uploaded using Trusted Publishing? No
- Uploaded via: twine/6.2.0 CPython/3.10.19
File hashes
| Algorithm | Hash digest | |
|---|---|---|
| SHA256 |
95025aa54d306095ae343ee859f2632d1c96f407e6b7cd29ca3f864bf4e32354
|
|
| MD5 |
4180f429b9ed5deee31a0394816a5f54
|
|
| BLAKE2b-256 |
b8b970d1cead6ebdb8a62dbef4a1ed10df145a19527af00a06bcdb93e632dfb9
|


