
streamlit-lightweight-charts
Streamlit wrapper for performant Tradingview's Financial: lightweight-charts
The Lightweight Charts library is the best choice to display financial data as an interactive chart on a web page without affecting loading speed and performance.
Versions
- Version 0.7.19 - FIX: React build was not been commited
- Version 0.7.20 - Example loading from CSV
How to install:
python -m pip install streamlit-lightweight-charts
How to use:
from streamlit_lightweight_charts import renderLightweightCharts

renderLightweightCharts(charts: <List of Dicts> , key: <str>)
API
-
charts:
<List of Dicts> -
key:
<str>when creating multiple charts in one page
e.g.:
Overlaid Charts
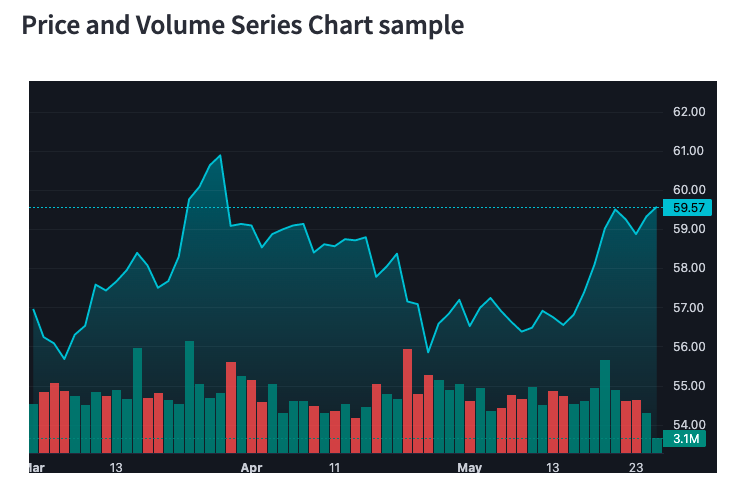
Click for a working sample on Streamlit Cloud ⬆
import streamlit as st
from streamlit_lightweight_charts import renderLightweightCharts
import streamlit_lightweight_charts.dataSamples as data

priceVolumeChartOptions = {
    "height": 400,
    "rightPriceScale": {
        "scaleMargins": {
            "top": 0.2,
            "bottom": 0.25,
        },
        "borderVisible": False,
    },
    "overlayPriceScales": {
        "scaleMargins": {
            "top": 0.7,
            "bottom": 0,
        }
    },
    "layout": {
        "background": {
            "type": 'solid',
            "color": '#131722'
        },
        "textColor": '#d1d4dc',
    },
    "grid": {
        "vertLines": {
            "color": 'rgba(42, 46, 57, 0)',
        },
        "horzLines": {
            "color": 'rgba(42, 46, 57, 0.6)',
        }
    }
}

priceVolumeSeries = [
    {
        "type": 'Area',
        "data": data.priceVolumeSeriesArea,
        "options": {
            "topColor": 'rgba(38,198,218, 0.56)',
            "bottomColor": 'rgba(38,198,218, 0.04)',
            "lineColor": 'rgba(38,198,218, 1)',
            "lineWidth": 2,
        }
    },
    {
        "type": 'Histogram',
        "data": data.priceVolumeSeriesHistogram,
        "options": {
            "color": '#26a69a',
            "priceFormat": {
                "type": 'volume',
            },
            "priceScaleId": "" # set as an overlay setting,
        },
        "priceScale": {
            "scaleMargins": {
                "top": 0.7,
                "bottom": 0,
            }
        }
    }
]
st.subheader("Price and Volume Series Chart")

renderLightweightCharts([
    {
        "chart": priceVolumeChartOptions,
        "series": priceVolumeSeries
    }
], 'priceAndVolume')
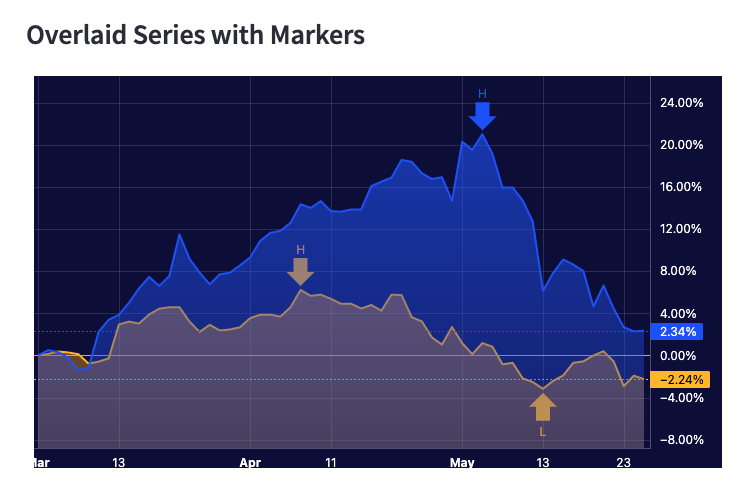
Click for a working sample on Streamlit Cloud ⬆
import streamlit as st
from streamlit_lightweight_charts import renderLightweightCharts
import streamlit_lightweight_charts.dataSamples as data

overlaidAreaSeriesOptions = {
    "height": 400,
    "rightPriceScale": {
        "scaleMargins": {
            "top": 0.1,
            "bottom": 0.1,
        },
        "mode": 2, # PriceScaleMode: 0-Normal, 1-Logarithmic, 2-Percentage, 3-IndexedTo100
        "borderColor": 'rgba(197, 203, 206, 0.4)',
    },
    "timeScale": {
        "borderColor": 'rgba(197, 203, 206, 0.4)',
    },
    "layout": {
        "background": {
            "type": 'solid',
            "color": '#100841'
        },
        "textColor": '#ffffff',
    },
    "grid": {
        "vertLines": {
            "color": 'rgba(197, 203, 206, 0.4)',
            "style": 1, # LineStyle: 0-Solid, 1-Dotted, 2-Dashed, 3-LargeDashed
        },
        "horzLines": {
            "color": 'rgba(197, 203, 206, 0.4)',
            "style": 1, # LineStyle: 0-Solid, 1-Dotted, 2-Dashed, 3-LargeDashed
        }
    }
}

seriesOverlaidChart = [
    {
        "type": 'Area',
        "data": data.seriesMultipleChartArea01,
        "options": {
            "topColor": 'rgba(255, 192, 0, 0.7)',
            "bottomColor": 'rgba(255, 192, 0, 0.3)',
            "lineColor": 'rgba(255, 192, 0, 1)',
            "lineWidth": 2,
        },
        "markers": [
            {
                "time": '2019-04-08',
                "position": 'aboveBar',
                "color": 'rgba(255, 192, 0, 1)',
                "shape": 'arrowDown',
                "text": 'H',
                "size": 3
            },
            {
                "time": '2019-05-13',
                "position": 'belowBar',
                "color": 'rgba(255, 192, 0, 1)',
                "shape": 'arrowUp',
                "text": 'L',
                "size": 3
            },
        ]
    },
    {
        "type": 'Area',
        "data": data.seriesMultipleChartArea02,
        "options": {
            "topColor": 'rgba(67, 83, 254, 0.7)',
            "bottomColor": 'rgba(67, 83, 254, 0.3)',
            "lineColor": 'rgba(67, 83, 254, 1)',
            "lineWidth": 2,
        },
        "markers": [

            {
                "time": '2019-05-03',
                "position": 'aboveBar',
                "color": 'rgba(67, 83, 254, 1)',
                "shape": 'arrowDown',
                "text": 'PEAK',
                "size": 3
            },
        ]
    }
]
st.subheader("Overlaid Series with Markers")

renderLightweightCharts([
    {
        "chart": overlaidAreaSeriesOptions,
        "series": seriesOverlaidChart
    }
], 'overlaid')
Streamlit integration
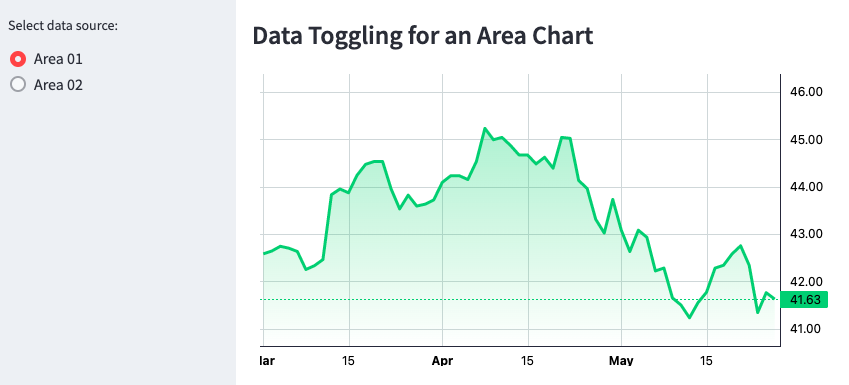
Click for a working sample on Streamlit Cloud ⬆
import streamlit as st
from streamlit_lightweight_charts import renderLightweightCharts
import streamlit_lightweight_charts.dataSamples as data

chartOptions = {
    "layout": {
        "textColor": 'black',
        "background": {
            "type": 'solid',
            "color": 'white'
        }
    }
}

st.subheader("Data Toggling for an Area Chart")

data_select = st.sidebar.radio('Select data source:', ('Area 01', 'Area 02'))

if data_select == 'Area 01':
    renderLightweightCharts( [
        {
            "chart": chartOptions,
            "series": [{
                "type": 'Area',
                "data": data.seriesMultipleChartArea01,
                "options": {}
            }],
        }
    ], 'area')
else:
    renderLightweightCharts( [
        {
            "chart": chartOptions,
            "series": [{
                "type": 'Area',
                "data": data.seriesMultipleChartArea02,
                "options": {}
            }],
        }
    ], 'area')
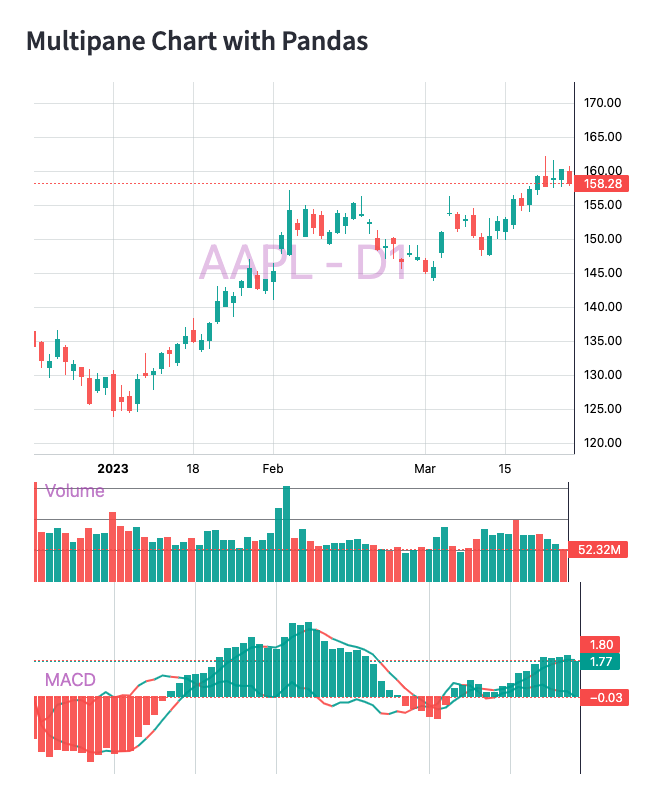
import streamlit as st
from streamlit_lightweight_charts import renderLightweightCharts

import json
import numpy as np
import yfinance as yf
import pandas as pd
import pandas_ta as ta

COLOR_BULL = 'rgba(38,166,154,0.9)' # #26a69a
COLOR_BEAR = 'rgba(239,83,80,0.9)'  # #ef5350

# Request historic pricing data via finance.yahoo.com API
df = yf.Ticker('AAPL').history(period='4mo')[['Open', 'High', 'Low', 'Close', 'Volume']]

# Some data wrangling to match required format
df = df.reset_index()
df.columns = ['time','open','high','low','close','volume']                  # rename columns
df['time'] = df['time'].dt.strftime('%Y-%m-%d')                             # Date to string
df['color'] = np.where(  df['open'] > df['close'], COLOR_BEAR, COLOR_BULL)  # bull or bear
df.ta.macd(close='close', fast=6, slow=12, signal=5, append=True)           # calculate macd

# export to JSON format
candles = json.loads(df.to_json(orient = "records"))
volume = json.loads(df.rename(columns={"volume": "value",}).to_json(orient = "records"))
macd_fast = json.loads(df.rename(columns={"MACDh_6_12_5": "value"}).to_json(orient = "records"))
macd_slow = json.loads(df.rename(columns={"MACDs_6_12_5": "value"}).to_json(orient = "records"))
df['color'] = np.where(  df['MACD_6_12_5'] > 0, COLOR_BULL, COLOR_BEAR)  # MACD histogram color
macd_hist = json.loads(df.rename(columns={"MACD_6_12_5": "value"}).to_json(orient = "records"))


chartMultipaneOptions = [
    {
        "width": 600,
        "height": 400,
        "layout": {
            "background": {
                "type": "solid",
                "color": 'white'
            },
            "textColor": "black"
        },
        "grid": {
            "vertLines": {
                "color": "rgba(197, 203, 206, 0.5)"
                },
            "horzLines": {
                "color": "rgba(197, 203, 206, 0.5)"
            }
        },
        "crosshair": {
            "mode": 0
        },
        "priceScale": {
            "borderColor": "rgba(197, 203, 206, 0.8)"
        },
        "timeScale": {
            "borderColor": "rgba(197, 203, 206, 0.8)",
            "barSpacing": 15
        },
        "watermark": {
            "visible": True,
            "fontSize": 48,
            "horzAlign": 'center',
            "vertAlign": 'center',
            "color": 'rgba(171, 71, 188, 0.3)',
            "text": 'AAPL - D1',
        }
    },
    {
        "width": 600,
        "height": 100,
        "layout": {
            "background": {
                "type": 'solid',
                "color": 'transparent'
            },
            "textColor": 'black',
        },
        "grid": {
            "vertLines": {
                "color": 'rgba(42, 46, 57, 0)',
            },
            "horzLines": {
                "color": 'rgba(42, 46, 57, 0.6)',
            }
        },
        "timeScale": {
            "visible": False,
        },
        "watermark": {
            "visible": True,
            "fontSize": 18,
            "horzAlign": 'left',
            "vertAlign": 'top',
            "color": 'rgba(171, 71, 188, 0.7)',
            "text": 'Volume',
        }
    },
    {
        "width": 600,
        "height": 200,
        "layout": {
            "background": {
                "type": "solid",
                "color": 'white'
            },
            "textColor": "black"
        },
        "timeScale": {
            "visible": False,
        },
        "watermark": {
            "visible": True,
            "fontSize": 18,
            "horzAlign": 'left',
            "vertAlign": 'center',
            "color": 'rgba(171, 71, 188, 0.7)',
            "text": 'MACD',
        }
    }
]

seriesCandlestickChart = [
    {
        "type": 'Candlestick',
        "data": candles,
        "options": {
            "upColor": COLOR_BULL,
            "downColor": COLOR_BEAR,
            "borderVisible": False,
            "wickUpColor": COLOR_BULL,
            "wickDownColor": COLOR_BEAR
        }
    }
]

seriesVolumeChart = [
    {
        "type": 'Histogram',
        "data": volume,
        "options": {
            "priceFormat": {
                "type": 'volume',
            },
            "priceScaleId": "" # set as an overlay setting,
        },
        "priceScale": {
            "scaleMargins": {
                "top": 0,
                "bottom": 0,
            },
            "alignLabels": False
        }
    }
]

seriesMACDchart = [
    {
        "type": 'Line',
        "data": macd_fast,
        "options": {
            "color": 'blue',
            "lineWidth": 2
        }
    },
    {
        "type": 'Line',
        "data": macd_slow,
        "options": {
            "color": 'green',
            "lineWidth": 2
        }
    },
    {
        "type": 'Histogram',
        "data": macd_hist,
        "options": {
            "color": 'red',
            "lineWidth": 1
        }
    }
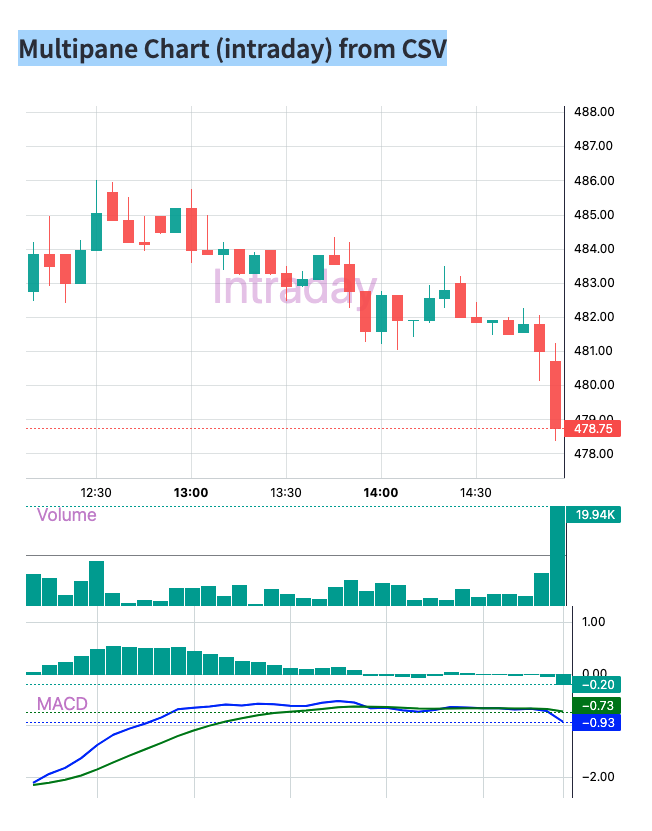
]

st.subheader("Multipane Chart with Pandas")

renderLightweightCharts([
    {
        "chart": chartMultipaneOptions[0],
        "series": seriesCandlestickChart
    },
    {
        "chart": chartMultipaneOptions[1],
        "series": seriesVolumeChart
    },
    {
        "chart": chartMultipaneOptions[2],
        "series": seriesMACDchart
    }
], 'multipane')
import streamlit as st
from streamlit_lightweight_charts import renderLightweightCharts

import json
import numpy as np
import pandas as pd

COLOR_BULL = 'rgba(38,166,154,0.9)' # #26a69a
COLOR_BEAR = 'rgba(239,83,80,0.9)'  # #ef5350

CSVFILE = 'https://github.com/freyastreamlit/streamlit-lightweight-charts/blob/main/examples/MultiPaneChartsFromCSV.csv?raw=true'

df = pd.read_csv(CSVFILE, skiprows=0, parse_dates=['datetime'], skip_blank_lines=True)

df['time'] = df['datetime'].view('int64') // 10**9  # We will use time in UNIX timestamp
df['color'] = np.where(  df['open'] > df['close'], COLOR_BEAR, COLOR_BULL)  # bull or bear

# export to JSON format
candles = json.loads(
    df.filter(['time','open','high','low','close'], axis=1)
      .to_json(orient = "records") )

volume = json.loads(
    df.filter(['time','volume'], axis=1)
      .rename(columns={"volume": "value",})
      .to_json(orient = "records") )

macd_fast = json.loads(
    df.filter(['time','macd_fast'], axis=1)
      .rename(columns={"macd_fast": "value"})
      .to_json(orient = "records"))

macd_slow = json.loads(
    df.filter(['time','macd_slow'], axis=1)
      .rename(columns={"macd_slow": "value"})
      .to_json(orient = "records"))

df['color'] = np.where(  df['macd_hist'] > 0, COLOR_BULL, COLOR_BEAR)  # MACD histogram color
macd_hist = json.loads(
    df.filter(['time','macd_hist'], axis=1)
      .rename(columns={"macd_hist": "value"})
      .to_json(orient = "records"))

chartMultipaneOptions = [
    {
        "width": 600,
        "height": 400,
        "layout": {
            "background": {
                "type": "solid",
                "color": 'white'
            },
            "textColor": "black"
        },
        "grid": {
            "vertLines": {
                "color": "rgba(197, 203, 206, 0.5)"
                },
            "horzLines": {
                "color": "rgba(197, 203, 206, 0.5)"
            }
        },
        "crosshair": {
            "mode": 0
        },
        "priceScale": {
            "borderColor": "rgba(197, 203, 206, 0.8)"
        },
        "timeScale": {
            "borderColor": "rgba(197, 203, 206, 0.8)",
            "barSpacing": 10,
            "minBarSpacing": 8,
            "timeVisible": True,
            "secondsVisible": False,
        },
        "watermark": {
            "visible": True,
            "fontSize": 48,
            "horzAlign": 'center',
            "vertAlign": 'center',
            "color": 'rgba(171, 71, 188, 0.3)',
            "text": 'Intraday',
        }
    },
    {
        "width": 600,
        "height": 100,
        "layout": {
            "background": {
                "type": 'solid',
                "color": 'transparent'
            },
            "textColor": 'black',
        },
        "grid": {
            "vertLines": {
                "color": 'rgba(42, 46, 57, 0)',
            },
            "horzLines": {
                "color": 'rgba(42, 46, 57, 0.6)',
            }
        },
        "timeScale": {
            "visible": False,
        },
        "watermark": {
            "visible": True,
            "fontSize": 18,
            "horzAlign": 'left',
            "vertAlign": 'top',
            "color": 'rgba(171, 71, 188, 0.7)',
            "text": 'Volume',
        }
    },
    {
        "width": 600,
        "height": 200,
        "layout": {
            "background": {
                "type": "solid",
                "color": 'white'
            },
            "textColor": "black"
        },
        "timeScale": {
            "visible": False,
        },
        "watermark": {
            "visible": True,
            "fontSize": 18,
            "horzAlign": 'left',
            "vertAlign": 'center',
            "color": 'rgba(171, 71, 188, 0.7)',
            "text": 'MACD',
        }
    }
]

seriesCandlestickChart = [
    {
        "type": 'Candlestick',
        "data": candles,
        "options": {
            "upColor": COLOR_BULL,
            "downColor": COLOR_BEAR,
            "borderVisible": False,
            "wickUpColor": COLOR_BULL,
            "wickDownColor": COLOR_BEAR
        }
    }
]

seriesVolumeChart = [
    {
        "type": 'Histogram',
        "data": volume,
        "options": {
            "priceFormat": {
                "type": 'volume',
            },
            "priceScaleId": "" # set as an overlay setting,
        },
        "priceScale": {
            "scaleMargins": {
                "top": 0,
                "bottom": 0,
            },
            "alignLabels": False
        }
    }
]

seriesMACDchart = [
    {
        "type": 'Line',
        "data": macd_fast,
        "options": {
            "color": 'blue',
            "lineWidth": 2
        }
    },
    {
        "type": 'Line',
        "data": macd_slow,
        "options": {
            "color": 'green',
            "lineWidth": 2
        }
    },
    {
        "type": 'Histogram',
        "data": macd_hist,
        "options": {
            # "color": 'red',
            "lineWidth": 1
        }
    }
]

st.subheader("Multipane Chart (intraday) from CSV")

renderLightweightCharts([
    {
        "chart": chartMultipaneOptions[0],
        "series": seriesCandlestickChart
    },
    {
        "chart": chartMultipaneOptions[1],
        "series": seriesVolumeChart
    },
    {
        "chart": chartMultipaneOptions[2],
        "series": seriesMACDchart
    }
], 'multipane')
Basic charts
import streamlit as st
from streamlit_lightweight_charts import renderLightweightCharts

chartOptions = {
    "layout": {
        "textColor": 'black',
        "background": {
            "type": 'solid',
            "color": 'white'
        }
    }
}

seriesLineChart = [{
    "type": 'Line',
    "data": [
        { "time": '2018-12-22', "value": 32.51 },
        { "time": '2018-12-23', "value": 31.11 },
        { "time": '2018-12-24', "value": 27.02 },
        { "time": '2018-12-25', "value": 27.32 },
        { "time": '2018-12-26', "value": 25.17 },
        { "time": '2018-12-27', "value": 28.89 },
        { "time": '2018-12-28', "value": 25.46 },
        { "time": '2018-12-29', "value": 23.92 },
        { "time": '2018-12-30', "value": 22.68 },
        { "time": '2018-12-31', "value": 22.67 },
    ],
    "options": {}
}]

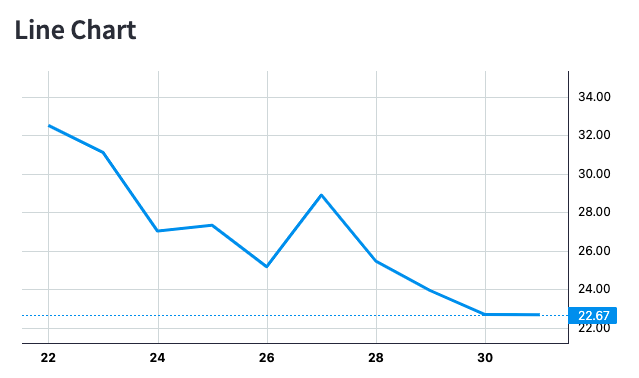
st.subheader("Line Chart with Watermark")

renderLightweightCharts([
    {
        "chart": chartOptions,
        "series": seriesLineChart
    }
], 'line')

import streamlit as st
from streamlit_lightweight_charts import renderLightweightCharts

chartOptions = {
    "layout": {
        "textColor": 'black',
        "background": {
            "type": 'solid',
            "color": 'white'
        }
    }
}

seriesAreaChart = [{
    "type": 'Area',
    "data": [
        { "time": '2018-12-22', "value": 32.51 },
        { "time": '2018-12-23', "value": 31.11 },
        { "time": '2018-12-24', "value": 27.02 },
        { "time": '2018-12-25', "value": 27.32 },
        { "time": '2018-12-26', "value": 25.17 },
        { "time": '2018-12-27', "value": 28.89 },
        { "time": '2018-12-28', "value": 25.46 },
        { "time": '2018-12-29', "value": 23.92 },
        { "time": '2018-12-30', "value": 22.68 },
        { "time": '2018-12-31', "value": 22.67 },
    ],
    "options": {}
}]

st.subheader("Area Chart with Watermark")
renderLightweightCharts( [
    {
        "chart": chartOptions,
        "series": seriesAreaChart,
    }
], 'area')
import streamlit as st
from streamlit_lightweight_charts import renderLightweightCharts

chartOptions = {
    "layout": {
        "textColor": 'black',
        "background": {
            "type": 'solid',
            "color": 'white'
        }
    }
}

seriesHistogramChart = [{
    "type": 'Histogram',
    "data": [
        { "value": 1, "time": 1642425322 },
        { "value": 8, "time": 1642511722 },
        { "value": 10, "time": 1642598122 },
        { "value": 20, "time": 1642684522 },
        { "value": 3, "time": 1642770922, "color": 'red' },
        { "value": 43, "time": 1642857322 },
        { "value": 41, "time": 1642943722, "color": 'red' },
        { "value": 43, "time": 1643030122 },
        { "value": 56, "time": 1643116522 },
        { "value": 46, "time": 1643202922, "color": 'red' }
    ],
    "options": { "color": '#26a69a' }
}]

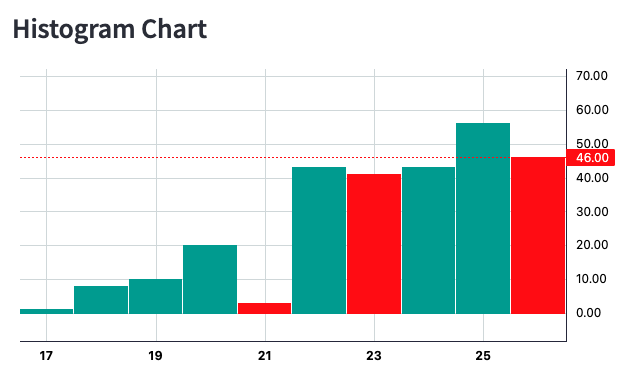
st.subheader("Histogram Chart with Watermark")

renderLightweightCharts([
    {
        "chart": chartOptions,
        "series": seriesHistogramChart
    }
], 'histogram')
import streamlit as st
from streamlit_lightweight_charts import renderLightweightCharts

chartOptions = {
    "layout": {
        "textColor": 'black',
        "background": {
            "type": 'solid',
            "color": 'white'
        }
    }
}

seriesBarChart = [{
    "type": 'Bar',
    "data": [
        { "open": 10, "high": 10.63, "low": 9.49, "close": 9.55, "time": 1642427876 },
        { "open": 9.55, "high": 10.30, "low": 9.42, "close": 9.94, "time": 1642514276 },
        { "open": 9.94, "high": 10.17, "low": 9.92, "close": 9.78, "time": 1642600676 },
        { "open": 9.78, "high": 10.59, "low": 9.18, "close": 9.51, "time": 1642687076 },
        { "open": 9.51, "high": 10.46, "low": 9.10, "close": 10.17, "time": 1642773476 },
        { "open": 10.17, "high": 10.96, "low": 10.16, "close": 10.47, "time": 1642859876 },
        { "open": 10.47, "high": 11.39, "low": 10.40, "close": 10.81, "time": 1642946276 },
        { "open": 10.81, "high": 11.60, "low": 10.30, "close": 10.75, "time": 1643032676 },
        { "open": 10.75, "high": 11.60, "low": 10.49, "close": 10.93, "time": 1643119076 },
        { "open": 10.93, "high": 11.53, "low": 10.76, "close": 10.96, "time": 1643205476 }
    ],
    "options": {
        "upColor": '#26a69a',
        "downColor": '#ef5350'
    }
}]

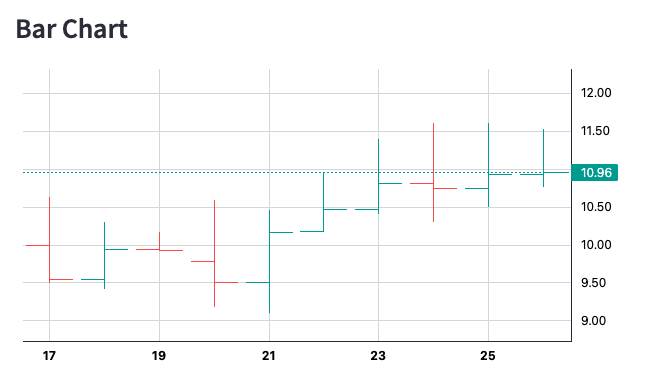
st.subheader("Bar Chart with Watermark")
renderLightweightCharts([
    {
        "chart": chartOptions,
        "series": seriesBarChart
    }
], 'bar')
import streamlit as st
from streamlit_lightweight_charts import renderLightweightCharts

chartOptions = {
    "layout": {
        "textColor": 'black',
        "background": {
            "type": 'solid',
            "color": 'white'
        }
    }
}

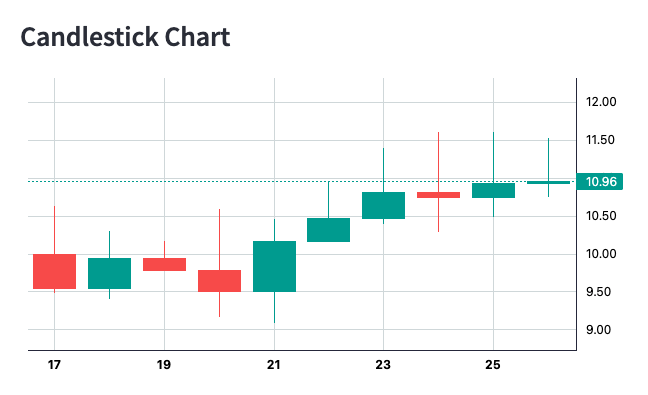
seriesCandlestickChart = [{
    "type": 'Candlestick',
    "data": [
        { "open": 10, "high": 10.63, "low": 9.49, "close": 9.55, "time": 1642427876 },
        { "open": 9.55, "high": 10.30, "low": 9.42, "close": 9.94, "time": 1642514276 },
        { "open": 9.94, "high": 10.17, "low": 9.92, "close": 9.78, "time": 1642600676 },
        { "open": 9.78, "high": 10.59, "low": 9.18, "close": 9.51, "time": 1642687076 },
        { "open": 9.51, "high": 10.46, "low": 9.10, "close": 10.17, "time": 1642773476 },
        { "open": 10.17, "high": 10.96, "low": 10.16, "close": 10.47, "time": 1642859876 },
        { "open": 10.47, "high": 11.39, "low": 10.40, "close": 10.81, "time": 1642946276 },
        { "open": 10.81, "high": 11.60, "low": 10.30, "close": 10.75, "time": 1643032676 },
        { "open": 10.75, "high": 11.60, "low": 10.49, "close": 10.93, "time": 1643119076 },
        { "open": 10.93, "high": 11.53, "low": 10.76, "close": 10.96, "time": 1643205476 }
    ],
    "options": {
        "upColor": '#26a69a',
        "downColor": '#ef5350',
        "borderVisible": False,
        "wickUpColor": '#26a69a',
        "wickDownColor": '#ef5350'
    }
}]

st.subheader("Candlestick Chart with Watermark")

renderLightweightCharts([
    {
        "chart": chartOptions,
        "series": seriesCandlestickChart
    }
], 'candlestick')
import streamlit as st
from streamlit_lightweight_charts import renderLightweightCharts

chartOptions = {
    "layout": {
        "textColor": 'black',
        "background": {
            "type": 'solid',
            "color": 'white'
        }
    }
}

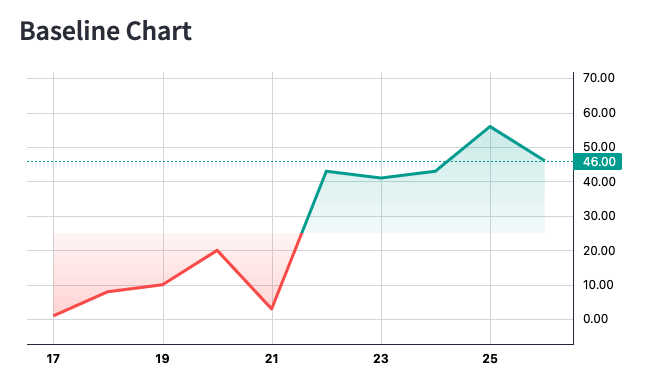
seriesBaselineChart = [{
    "type": 'Baseline',
    "data": [
        { "value": 1, "time": 1642425322 },
        { "value": 8, "time": 1642511722 },
        { "value": 10, "time": 1642598122 },
        { "value": 20, "time": 1642684522 },
        { "value": 3, "time": 1642770922 },
        { "value": 43, "time": 1642857322 },
        { "value": 41, "time": 1642943722 },
        { "value": 43, "time": 1643030122 },
        { "value": 56, "time": 1643116522 },
        { "value": 46, "time": 1643202922 }
    ],
    "options": {
        "baseValue": { "type": "price", "price": 25 },
        "topLineColor": 'rgba( 38, 166, 154, 1)',
        "topFillColor1": 'rgba( 38, 166, 154, 0.28)',
        "topFillColor2": 'rgba( 38, 166, 154, 0.05)',
        "bottomLineColor": 'rgba( 239, 83, 80, 1)',
        "bottomFillColor1": 'rgba( 239, 83, 80, 0.05)',
        "bottomFillColor2": 'rgba( 239, 83, 80, 0.28)'
    }
}]

st.subheader("Baseline Chart with Watermark")

renderLightweightCharts([
    {
        "chart": chartOptions,
        "series": seriesBaselineChart
    }
], 'baseline')
1 maintainer

Metadata
1 maintainer
Release files for streamlit-lightweight-charts 0.7.20
For a detailed explanation of source distributions (sdists) and built distributions (wheels), please see the package formats documentation.
Source distribution (sdist)
| File | Size | Uploaded | |
|---|---|---|---|
| streamlit-lightweight-charts-0.7.20.tar.gz | 661.8 kB | Details |
Built distribution (wheel)
| File | Interpreter | ABI | Platform | Reset |
|---|---|---|---|---|
| streamlit_lightweight_charts-0.7.20-py3-none-any.whl | Python 3 | none | any | Details |
Total release size: 1.3 MB
Release files / streamlit-lightweight-charts-0.7.20.tar.gz
| Download URL | streamlit-lightweight-charts-0.7.20.tar.gz |
|---|---|
| Size | 661.8 kB |
| Tags | Source |
|
SHA-256 checksum How to use checksums |
1341348b8286c23975246b391956295c70cb315c06eaec9a51b31e5bcf774ef5
|
|
BLAKE2b-256 checksum How to use checksums |
7e514a1b5c968746baf403845e4dc58d0e4c789f0a4274a690b06d1f11e073a2
|
| Upload date | |
|
Uploaded using Trusted Publishing? What is trusted publishing? |
No |
| Uploaded via |
twine/4.0.2 CPython/3.9.5
|
Release files / streamlit_lightweight_charts-0.7.20-py3-none-any.whl
| Download URL | streamlit_lightweight_charts-0.7.20-py3-none-any.whl |
|---|---|
| Size | 669.3 kB |
| Tags | Python 3 |
|
SHA-256 checksum How to use checksums |
61e0edc669dac626176a16da173414f577161f28107a3475762640d5665c7fe4
|
|
BLAKE2b-256 checksum How to use checksums |
95d1adc3380ab8f92c7c89516a562186349a61cf063a931e88811398fccd2024
|
| Upload date | |
|
Uploaded using Trusted Publishing? What is trusted publishing? |
No |
| Uploaded via |
twine/4.0.2 CPython/3.9.5
|














