
Spatial analysis toolkit for evaluating NYC subway accessibility, reliability, and equity gaps.
Verified details
These details have been verified by PyPIProject links
GitHub Statistics
Maintainers

Project description
subway-access



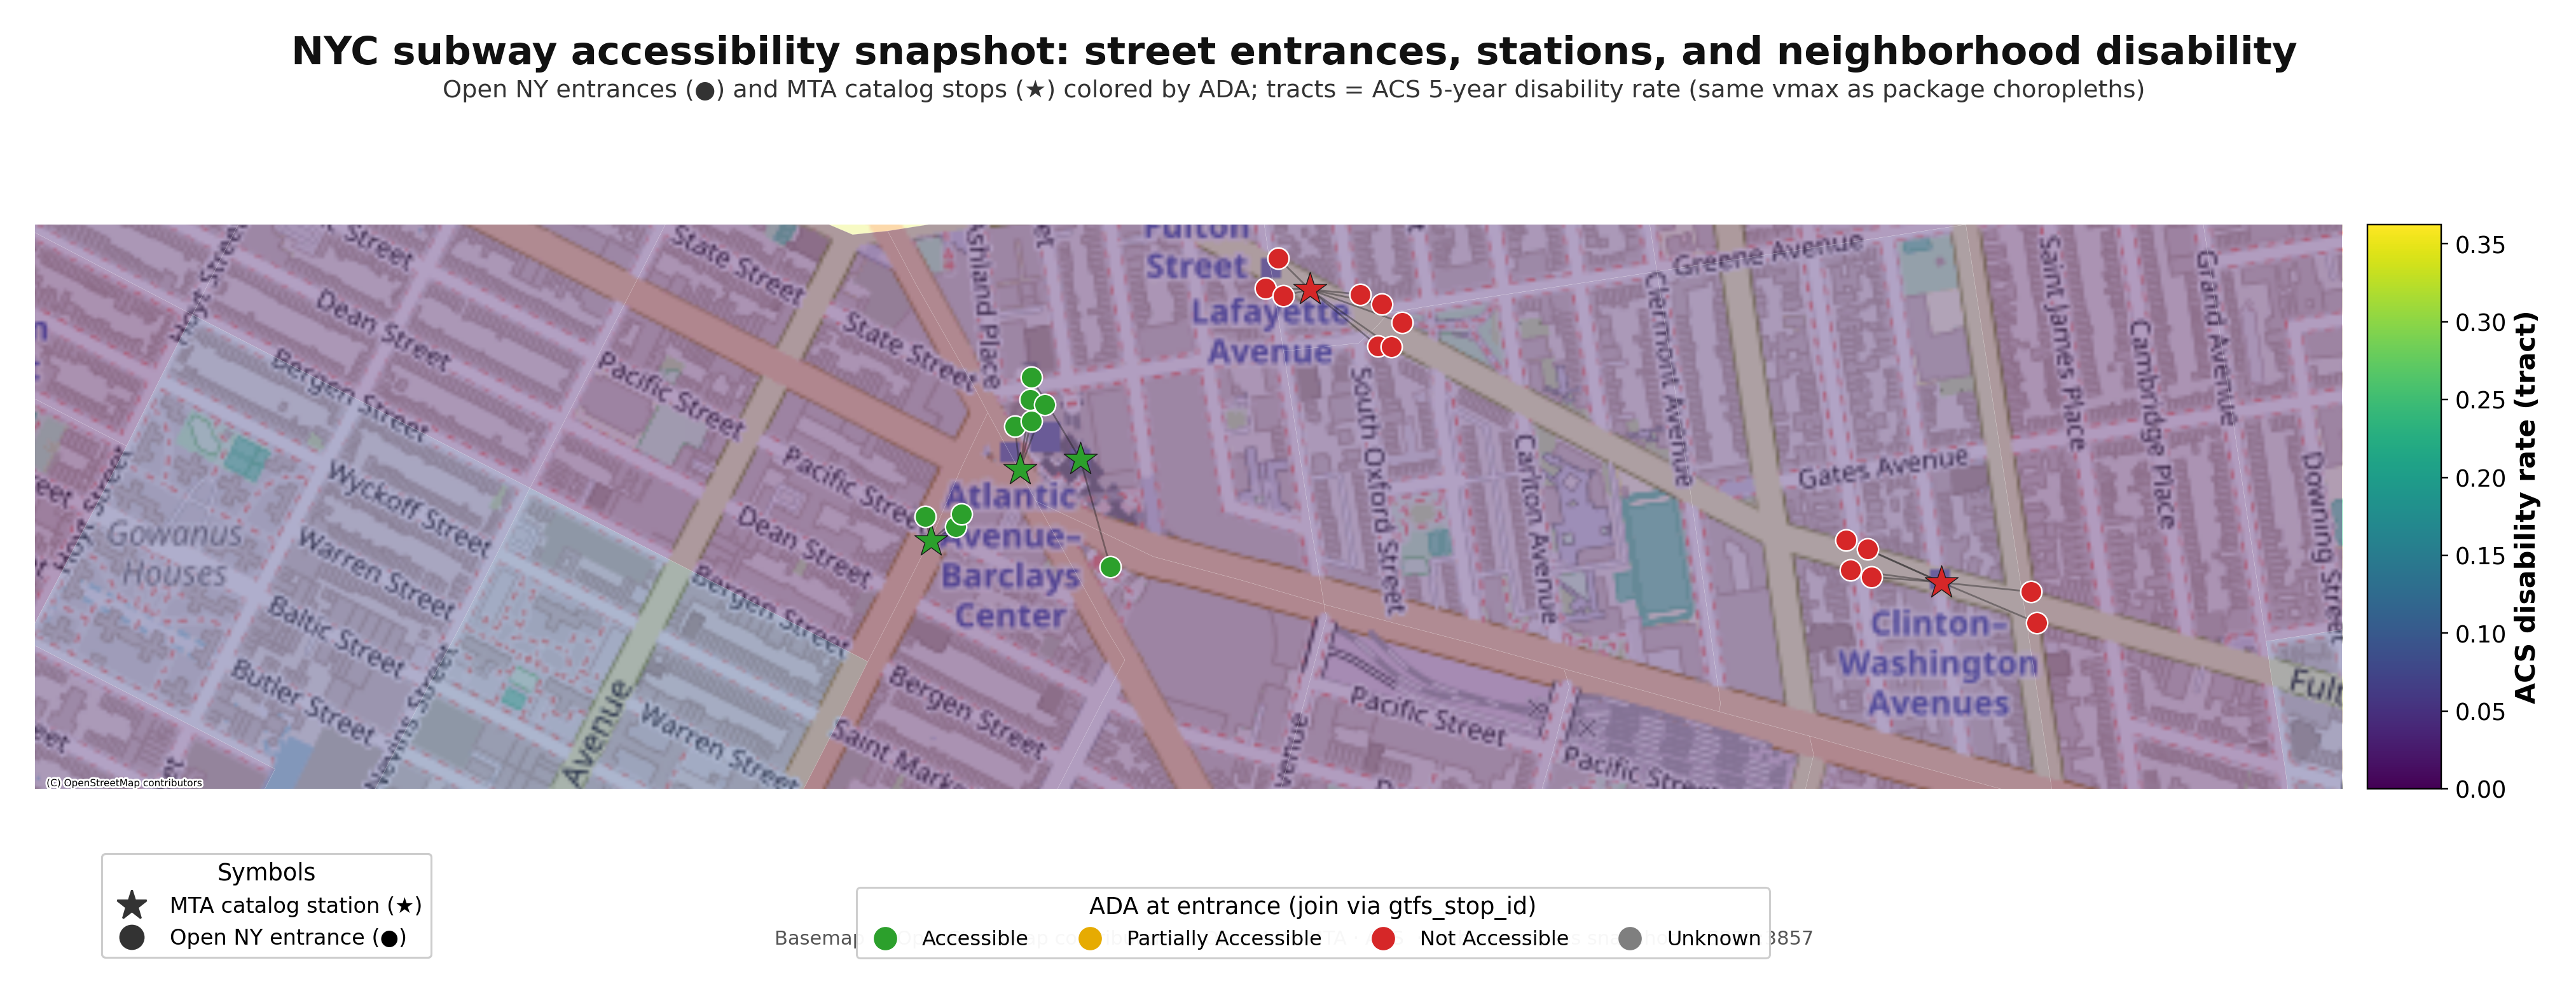
subway-access is a Python toolkit for reproducible NYC subway accessibility
analysis. It fetches live MTA and Census data, scores every census tract for
accessible-station coverage, measures elevator reliability, and produces
research-ready panel datasets -- all from a single pip install.
Authored by Blaise Albis-Burdige.
What ships in the package
Data pipeline:
- Fetch MTA subway stations, ADA status, elevator/escalator availability history, equipment assets, street-level entrances, and GTFS-Pathways from public APIs
- Fetch ACS 5-year tract-level demographics (disability, senior, poverty rates)
- Cache reusable local snapshot bundles per study area
- Run the full workflow from the installed
subway-accessCLI
Analysis:
- Euclidean and OSM-network walk catchments
- Tract-level accessibility gap scoring and rolling station reliability
- Station-level metrics combining coverage, need, and reliability
- Borough and group-level summary aggregation
- Export to GeoJSON, CSV, and station metric formats
Composable factor pipeline (v0.4):
- Class-based
Factor/Pipelinesystem inspired by Quantopian's Zipline - 7 built-in factors: NeedScore, Coverage, GapScore, NearestStationDistance, NearestStationTravelMinutes, StationCount, ReliabilityWeightedCoverage
- Custom factors via subclassing -- bring in external data (housing costs, economic indicators) as first-class inputs
PipelineResultwith.to_records()and optional.to_dataframe()
Temporal panel infrastructure (v0.4):
- Multi-vintage ACS fetcher for longitudinal demographic data
- Station ADA upgrade timeline construction
- Geographic panel dataset builder (tract x year) with treatment/control splitting
- Distance-based spatial weights matrix with PySAL bridge
Helpers (v0.4):
- Multi-borough snapshot iteration with independent caching
- Generic CSV export from frozen dataclasses with auto fieldnames
- Metadata and markdown report writing utilities
10 public modules, 123 public symbols across models, io, analysis,
factors, helpers, export, pipeline, temporal, and cli.
Quickstart
pip install subway-access
For the full plotting + geographic + network stack:
pip install "subway-access[all]"
Fetch a real official-data borough snapshot:
subway-access fetch-snapshot --geography borough --value Manhattan --cache-dir cache/manhattan
Then analyze the cached snapshot:
subway-access analyze-snapshot --cache-dir cache/manhattan --output-dir artifacts/manhattan
Python example
from pathlib import Path

from subway_access import analysis, models, pipeline

snapshot = pipeline.fetch_study_area_snapshot(
    models.AccessibilityQuery(geography="borough", value="Manhattan"),
    cache_dir=Path("cache/manhattan"),
)
catchments = analysis.generate_catchments(
    snapshot.stations,
    models.CatchmentRequest(minutes=10),
)
scores = analysis.score_accessibility(
    snapshot.stations,
    catchments,
    snapshot.demographics,
)
reliability = analysis.compute_reliability(
    snapshot.stations,
    snapshot.outages,
    models.TimeWindow(days=30),
)
gaps = analysis.analyze_gaps(scores)
print(len(gaps.records), len(reliability.records))
Factor pipeline
The composable factor pipeline lets you build custom classification models that
run in a single pass over every tract. Each Factor receives row-level context
(tract demographics, station data, catchments, and an extensible extras slot for
external data) and returns a typed value.
from subway_access.factors import (
    CoverageFactor,
    FactorContext,
    GapScoreFactor,
    NearestStationDistanceFactor,
    NeedScoreFactor,
    Pipeline,
    ReliabilityWeightedCoverageFactor,
    StationCountFactor,
)

# Compose a pipeline from built-in factors.
pipe = (
    Pipeline()
    .add(NeedScoreFactor())
    .add(CoverageFactor())
    .add(GapScoreFactor())
    .add(NearestStationDistanceFactor())
    .add(StationCountFactor())
)

# Build contexts from a loaded snapshot.
contexts = [
    FactorContext(tract=t, stations=snapshot.stations, catchments=catchments)
    for t in snapshot.demographics.tracts
]

# Run all factors across all tracts.
result = pipe.run(contexts)
result.to_records()  # tuple of dicts
result.to_dataframe()  # pandas DataFrame (optional dep)
Custom factors are simple subclasses:
from subway_access.factors import Factor, FactorContext


class HousingCostFactor(Factor):
    name = "median_rent"
    dtype = "float"

    def __init__(self, rents: dict[str, float]) -> None:
        self._rents = rents

    def compute(self, context: FactorContext) -> float:
        return self._rents.get(context.tract.tract_id, 0.0)
Add reliability weighting to distinguish nominal from effective coverage:
# Build reliability scores from outage data.
reliability = analysis.compute_reliability(
    snapshot.stations, snapshot.outages, models.TimeWindow(days=365)
)
rel_scores = {r.station_id: r.reliability_score for r in reliability.records}

# Add reliability-weighted coverage to the pipeline.
pipe = pipe.add(ReliabilityWeightedCoverageFactor(rel_scores))
For a full worked example using the factor pipeline across all five boroughs
with geographic choropleths, diagnostic checks, and auto-generated reporting,
see
examples/accessibility-change-over-time/.
Temporal panel
Build geographic panel datasets for difference-in-differences or spatial autoregressive panel estimation:
from subway_access.temporal import build_panel_dataset, build_upgrade_timeline

# Build an upgrade timeline from station data + known upgrade years.
timeline = build_upgrade_timeline(
    snapshot.stations,
    known_upgrades={"station_1": 2019, "station_2": 2021},
)

# Construct the panel (tract x year).
panel = build_panel_dataset(vintage_estimates, station_locations, timeline)
panel.treatment_group()  # tracts that gained accessibility
panel.control_group()  # tracts that did not
panel.to_dataframe()  # pandas DataFrame with (unit_id, period) index
The accessibility-change-over-time example builds a full 5-borough panel (2,317 tracts x 7 years = 16,219 observations) and produces a research report with treatment-vs-control balance checks, spatial weights, and model specification.
Examples
examples/ follows a self-contained project pattern. Each folder has its own
pyproject.toml, README.md, main.py, and tracked reports/ output.
fetch-borough-snapshot/-- minimal data fetchborough-gap-analysis/-- gap scoring and visualizationoutage-reliability-report/-- station reliability analysismulti-borough-access-profile/-- cross-borough comparisonnetwork-access-comparison/-- Euclidean vs OSM walking networkaccessibility-change-over-time/-- full research pipeline with factor analysis, geographic maps, temporal panel, diagnostic checks, and auto-generated report (sample report)example-template/-- bootstrap template for new examples
Methodology
The workflow is intentionally explicit and reproducible:
- Select a study area through
nyc-geo-toolkit(borough, community district, council district) - Fetch official MTA and Census sources into a local cache
- Load cached files into typed, frozen in-memory datasets
- Generate Euclidean walk catchments (800 m / 10-min default) or OSM network isochrones
- Score tract centroids against accessible-station catchments via the factor pipeline
- Compute tract need, rolling reliability, and station metrics
- Optionally build a temporal panel for causal analysis
- Export publishable GeoJSON, CSV, and markdown outputs
Euclidean access remains the documented baseline. The network comparison layer shows how real walking routes change the coverage picture. The factor pipeline and temporal panel support research-grade analysis on top of the same data foundation.
Documentation
- Hosted docs: subway-access.readthedocs.io
- Local preview:
make docs - Strict docs build:
make docs-build
Quick links: Home, Getting Started, CLI Reference, Architecture, Python API, Contributing, Releasing, Changelog
Development
make install      # full contributor environment with all extras
make test         # pytest suite
make lint         # ruff + mypy + public API audit
make check        # lint + tests (pre-push gate)
make docs-build   # strict mkdocs build
make ci           # full local CI equivalent
License
MIT.
Project details
Verified details
These details have been verified by PyPIProject links
GitHub Statistics
Maintainers


Download files
Download the file for your platform. If you're not sure which to choose, learn more about installing packages.
Source Distribution
Built Distribution
Filter files by name, interpreter, ABI, and platform.
If you're not sure about the file name format, learn more about wheel file names.
Copy a direct link to the current filters
File details
Details for the file subway_access-0.4.1.tar.gz.
File metadata
- Download URL: subway_access-0.4.1.tar.gz
- Upload date:
- Size: 3.2 MB
- Tags: Source
- Uploaded using Trusted Publishing? Yes
- Uploaded via: twine/6.1.0 CPython/3.13.12
File hashes
| Algorithm | Hash digest | |
|---|---|---|
| SHA256 |
442e207f335d8df6aa727eb70ee46ff1d99d6e0b5044b1ed21441f2dac9eb1b3
|
|
| MD5 |
00452f2311c13af7abd1be553deab7d7
|
|
| BLAKE2b-256 |
d05b6945d0f93aefb12b84722b7e0444cc687d8b4cf5c9a039395c1b79229385
|
Provenance
The following attestation bundles were made for subway_access-0.4.1.tar.gz:
Publisher:
cd.yml on random-walks/subway-access
-
Statement:
-
Statement type:
https://in-toto.io/Statement/v1 -
Predicate type:
https://docs.pypi.org/attestations/publish/v1 -
Subject name:
subway_access-0.4.1.tar.gz -
Subject digest:
442e207f335d8df6aa727eb70ee46ff1d99d6e0b5044b1ed21441f2dac9eb1b3 - Sigstore transparency entry: 1280241852
- Sigstore integration time:
-
Permalink:
random-walks/subway-access@566048e15ccf8b2111a66a5b700cc8b4b38ac14b -
Branch / Tag:
refs/tags/0.4.1 - Owner: https://github.com/random-walks
-
Access:
public
-
Token Issuer:
https://token.actions.githubusercontent.com -
Runner Environment:
github-hosted -
Publication workflow:
cd.yml@566048e15ccf8b2111a66a5b700cc8b4b38ac14b -
Trigger Event:
release
-
Statement type:
File details
Details for the file subway_access-0.4.1-py3-none-any.whl.
File metadata
- Download URL: subway_access-0.4.1-py3-none-any.whl
- Upload date:
- Size: 71.9 kB
- Tags: Python 3
- Uploaded using Trusted Publishing? Yes
- Uploaded via: twine/6.1.0 CPython/3.13.12
File hashes
| Algorithm | Hash digest | |
|---|---|---|
| SHA256 |
d2a79df10fe0eee43f95220f8f246be160f9055c751a4c670db33a2deef72279
|
|
| MD5 |
d1fa857673b4b4700d0e6114f4fa6c24
|
|
| BLAKE2b-256 |
e0749e3eb087921d7ba5c6825a4a9c5d4e2763908b66933b91593a5f0484eb34
|
Provenance
The following attestation bundles were made for subway_access-0.4.1-py3-none-any.whl:
Publisher:
cd.yml on random-walks/subway-access
-
Statement:
-
Statement type:
https://in-toto.io/Statement/v1 -
Predicate type:
https://docs.pypi.org/attestations/publish/v1 -
Subject name:
subway_access-0.4.1-py3-none-any.whl -
Subject digest:
d2a79df10fe0eee43f95220f8f246be160f9055c751a4c670db33a2deef72279 - Sigstore transparency entry: 1280241858
- Sigstore integration time:
-
Permalink:
random-walks/subway-access@566048e15ccf8b2111a66a5b700cc8b4b38ac14b -
Branch / Tag:
refs/tags/0.4.1 - Owner: https://github.com/random-walks
-
Access:
public
-
Token Issuer:
https://token.actions.githubusercontent.com -
Runner Environment:
github-hosted -
Publication workflow:
cd.yml@566048e15ccf8b2111a66a5b700cc8b4b38ac14b -
Trigger Event:
release
-
Statement type:






