
SuperBased Observer — capture, normalize, compress, and analyze AI coding tool activity across Claude Code, Codex, Cursor, Cline/Roo, and Copilot.

Project description
superbased-observer





Homepage: https://superbased.app/
This is the PyPI distribution.
pip install superbased-observerbundles the same prebuilt binary that@superbased/observerships on npm — version numbers are kept in lock-step. Pick whichever package manager fits your environment; the resultingobservercommand on your$PATHis identical.
Capture, normalize, compress, and analyze every AI coding tool call you run — across Claude Code, Codex, Cursor, Cline / Roo Code, GitHub Copilot (VS Code), GitHub Copilot CLI, OpenCode, OpenClaw, Pi, Google Antigravity, Gemini CLI, and Cowork — in one local single-binary tool. No telemetry, no cloud, no data leaves your machine.
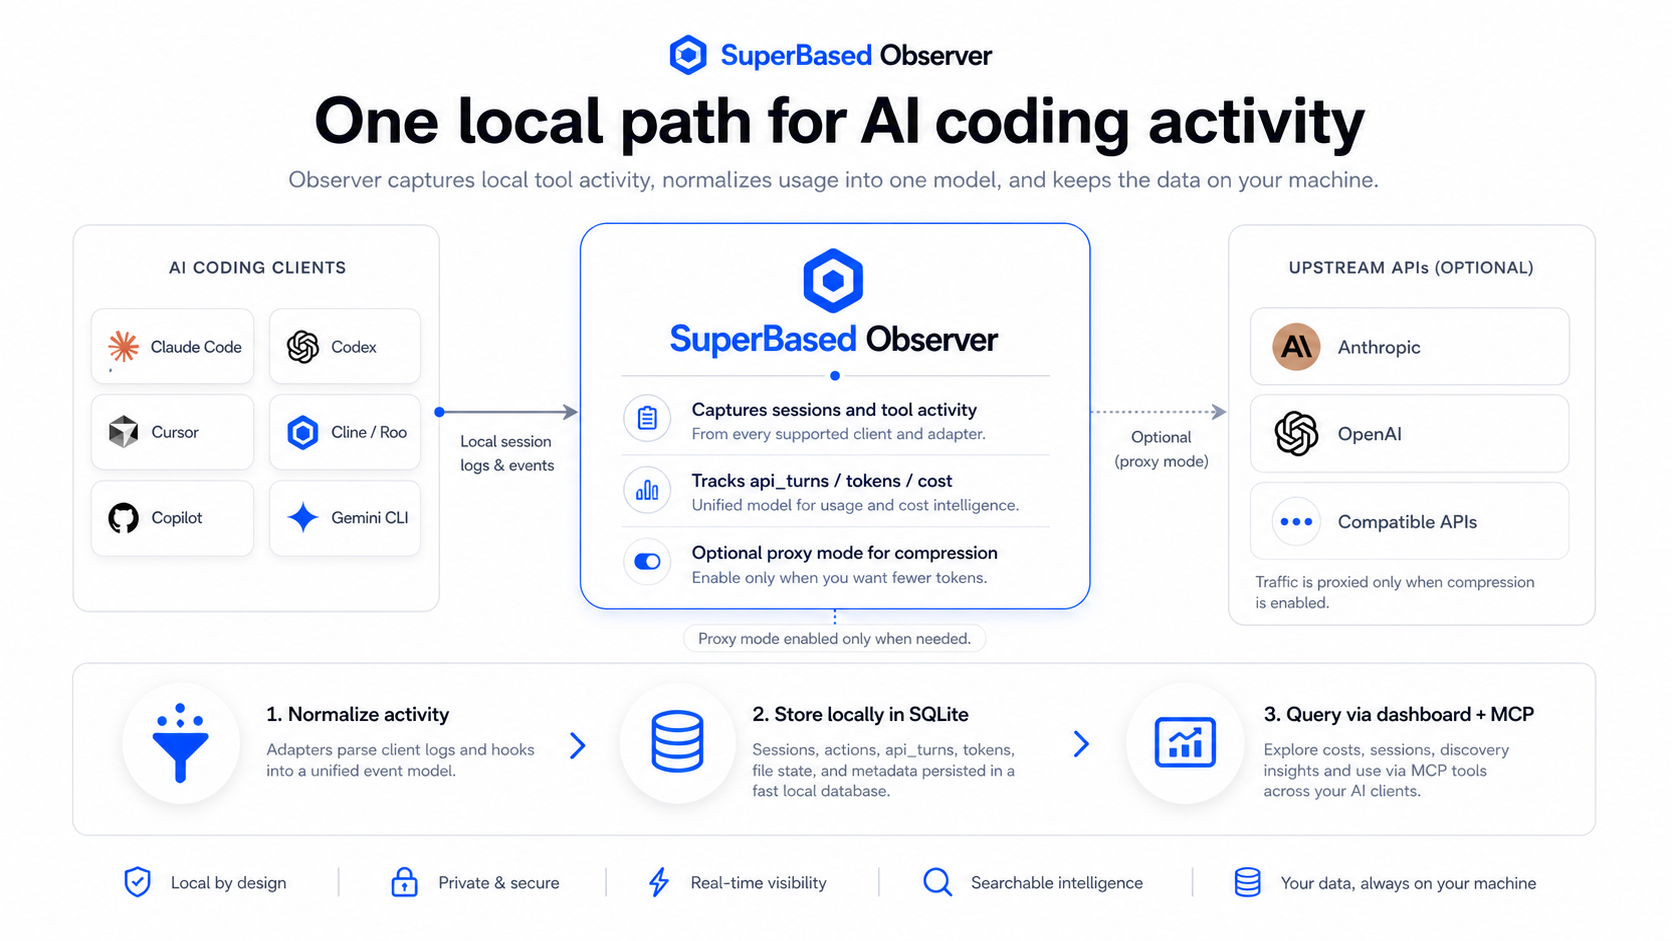
Table of contents
- Install
- Five-minute quickstart
- Per-AI-client setup
- Architecture in detail
- Dashboard tour
- MCP tools reference
- Compression mechanisms
- Cost and token math
- Terminology and glossary
- CLI reference
- Configuration
- Troubleshooting
- Security and privacy
- Source, contributing, license
Install
pip install superbased-observer
observer --version
Or with uv (recommended for tools — installs in an isolated env automatically):
uv tool install superbased-observer
observer --version
Or with pipx (same idea as uv tool):
pipx install superbased-observer
observer --version
Plain pip install --user superbased-observer works too, but
uv tool / pipx keep the install isolated from your project's
Python environment, which is generally what you want for a CLI tool.
Pre-built wheels ship for:
| Platform | Architecture | Wheel tag |
|---|---|---|
| Linux | x64 | manylinux2014_x86_64 (glibc ≥ 2.17) |
| Linux | arm64 | manylinux2014_aarch64 |
| macOS (Intel) | x64 | macosx_10_15_x86_64 |
| macOS (Apple Silicon) | arm64 | macosx_11_0_arm64 |
| Windows | x64 | win_amd64 |
Each wheel bundles its platform's prebuilt binary directly — no postinstall download, no compile step, no Go toolchain required. pip picks the right wheel for your machine automatically.
If your platform isn't listed, build from source — instructions in the main repo.
Already use @superbased/observer from npm? Don't install both
globally — whichever directory comes first on $PATH wins, which
gets confusing if their versions drift mid-upgrade. Pick one.
Five-minute quickstart
# 1) Install.
pip install superbased-observer    # or: uv tool install superbased-observer

# 2) Start everything: proxy + watcher + dashboard in one process.
#    Hooks auto-register for every detected AI tool, and the
#    dashboard opens in your browser (suppress with --no-open).
observer start
From here the dashboard drives:
- Route your AI client through the proxy — on the Compression
tab's Proxy banner, click your tool's status pill, then
Route through the observer proxy…. The button previews the
exact file change and writes only on confirm. (Every other
routing mechanism —
observer init, theobserver claude/observer codexwrappers, plain env vars — is listed in Per-AI-client setup.) - Use your AI tool as normal. The Overview tab's onboarding checklist tracks your first captured session; cost, compression, and cache numbers populate within minutes of real activity.
observer init is OPTIONAL — run it only if you want the MCP server
registered with your AI clients (gives them on-demand tools like
check_file_freshness / get_cost_summary, at the cost of ~1,800
tokens of schema per turn). Skip it for an MCP-free install.
What start does vs what init adds:
| Step | Hooks | Proxy listening | Watcher | Dashboard | MCP in AI clients | Codex proxy route |
|---|---|---|---|---|---|---|
observer start alone |
auto-registers ✓ | ✓ | ✓ | ✓ | — | — |
observer init + observer start |
✓ | ✓ | ✓ | ✓ | ✓ | ✓ |
observer init --skip-mcp + start |
✓ | ✓ | ✓ | ✓ | — | ✓ |
MCP and codex routing are explicit-only because both write per-client
config files. Hooks self-heal on every start.
Per-AI-client setup
Routing through the proxy — the canonical section
Accurate token counts, conversation compression, and cache tracking
all require your AI client to send its API traffic through the local
proxy on 127.0.0.1:8820. There is one decision to make — how to
route — and four mechanisms that all end at the same proxy. Pick the
first one that fits:
| Mechanism | What it does | Use it when |
|---|---|---|
| Dashboard button (recommended) | On the Compression tab's Proxy banner, click your tool's status pill, then Route through the observer proxy…. It previews the exact file change and writes only on confirm: Claude Code gets "env": { "ANTHROPIC_BASE_URL": … } in ~/.claude/settings.json; Codex gets an observer model provider in ~/.codex/config.toml. Durable — every later session routes automatically, no wrapper, no env vars. Undo: remove the entry, or observer uninstall --claude-code / --codex. |
You have a browser open. This is the default path. |
observer init |
Writes the same durable routing from the CLI, alongside hooks + MCP registration (each side defaults on; opt out with --skip-hooks / --skip-mcp / --skip-proxy-route). |
Headless machines, scripted setups. |
Wrapper commands — observer claude / observer codex |
Launch the tool with routing injected for that session only; nothing is written to any config file. The claude wrapper also re-exports a fresh Pro/Max OAuth token so the SDK's OAuth path can't bypass the proxy (an expired stored token is left alone — Claude Code then refreshes natively). observer claude --verify runs the pre-flight checks without launching. |
Trying the proxy out, or you don't want config writes. |
| Env var export | export ANTHROPIC_BASE_URL=http://127.0.0.1:8820 (Anthropic clients) or export OPENAI_BASE_URL=http://127.0.0.1:8820/v1 (OpenAI clients — note the /v1) in the shell that launches the tool. |
One-off shells; clients without a button or wrapper. |
Routing is per-tool, not global: route Claude Code and Codex independently, and both can coexist on one machine — the proxy routes by URL path.
Claude Code + MCP servers: set
ENABLE_TOOL_SEARCH=truein the same environment. Claude Code's SDK disables deferred MCP schema loading wheneverANTHROPIC_BASE_URLis set and eager-inlines every registered MCP schema (~+21K tokens/turn) — enough to turn the proxy into a net cost. The override restores lazy loading; the proxy forwardstool_referenceblocks byte-identically.
If the daemon is down while a tool is routed, Claude Code does not silently bypass to the real API — it retries the dead port (verified live: it hangs rather than failing over).
observer doctorand the dashboard's Health panel flag this state as a "proxy routing gap"; bring the daemon back withobserver start.
Capture modes per client
The proxy covers the clients that speak the Anthropic / OpenAI wire APIs. Everything else is captured passively from session logs. The table below is the full per-client reference.
| AI client | Env var | Capture mode |
|---|---|---|
| Claude Code | ANTHROPIC_BASE_URL=http://127.0.0.1:8820 |
proxy + JSONL |
| Cursor (Anthropic mode) | ANTHROPIC_BASE_URL=http://127.0.0.1:8820 |
proxy + JSONL |
| Codex | OPENAI_BASE_URL=http://127.0.0.1:8820/v1 (note /v1) |
proxy + JSONL with API-key auth; ChatGPT-plan login currently behaves as JSONL only |
| Cursor (OpenAI mode) | OPENAI_BASE_URL=http://127.0.0.1:8820/v1 |
proxy + JSONL |
| Cline (VS Code) / Roo Code | ANTHROPIC_BASE_URL=... or OPENAI_BASE_URL=... per provider |
proxy + JSONL |
Cline CLI (npm cline 3.0.20+) |
(no proxy route yet — the CLI ignores base-URL env vars; per-provider baseUrl overrides live in ~/.cline/data/settings/providers.json, a credentials file only the operator should edit) |
JSONL — SQLite session metadata at ~/.cline/data/db/sessions.db (schema v1, 28 columns) plus per-session <id>.messages.json content blocks. Captures user_prompt / assistant_text / tool_use / paired tool_result rows + Tier 2 per-API-call token usage from modelInfo overrides. Subagent + team linkage via 5 new ActionMetadata fields (ParentSessionID, ParentAgentID, AgentID, IsSubagent, TeamName). 28-tool taxonomy (10 core + 18 team_* coordination primitives). WSL2 over /mnt/c uses the same stageMirror pattern as opencode/kilocode. Tagged Source=jsonl, Reliability=approximate. |
| GitHub Copilot | (no proxy yet) | JSONL only |
| OpenCode (opencode.ai) | (no proxy yet) | SQLite — actual install path is ~/.local/share/opencode/opencode.db (XDG). Captures token counts + model + cost per assistant message from OpenCode's InfoData (tokens.input/output/reasoning/cache.{read,write} + cost); subtask parts → spawn_subagent actions; todo table → todo_update actions; tool-name coverage extended to webfetch/websearch/task/todowrite/todoread/multiedit. Tagged Source=jsonl, Reliability=approximate. |
| OpenClaw (openclaw.ai) | (no proxy yet) | JSONL + sqlite — ~/.openclaw/tasks/runs.sqlite + ~/.openclaw/agents/<agent>/sessions/sessions.json |
| Pi (pi.dev) | (no proxy yet) | JSONL — ~/.pi/agent/sessions/--<path>--/*.jsonl (per upstream docs/session-format.md v3). Captures user / assistant / toolResult / bashExecution message roles; usage.cost.total → per-message USD; terminal stopReason (stop/length/error/aborted) → task_complete with success=false for failures (mid-turn toolUse is correctly skipped); thinking blocks surface as preceding reasoning. Tagged Source=jsonl, Reliability=approximate. |
| Google Antigravity | (no proxy yet) | Encrypted protobuf — ~/.gemini/antigravity/conversations/*.pb (Linux-native) and the matching Windows-side path on WSL2. Observer ships a per-OS Chromium-pattern oscrypt key fetcher (macOS Keychain / libsecret / DPAPI / WSL2-via-PowerShell helper) and a multi-cipher try-loop for local decryption. Sessions whose ciphers don't validate locally fall back to the language_server's GetCascadeTrajectory gRPC endpoint via a built-in helper (antigravity-bridge.exe on WSL2 / native gRPC elsewhere) — extracts model + per-turn token counts + Tier 0–6 ToolEvents (file views, artifact edits/writes, user prompts, assistant text, run_command terminal snapshots, structured plan steps, final summaries). State index + per-conversation title/workspace URI read from state.vscdb + state.vscdb.backup. Tagged Source=jsonl, Reliability=approximate. |
| Kilo Code IDE extension (legacy) | (no proxy yet) | JSON — <vsCodeGlobalStorage>/kilocode.kilo-code/tasks/<taskId>/api_conversation_history.json. The legacy Kilo extension is a Cline + Roo Code fork and shares the Cline parser; emitted rows are re-tagged Tool="kilo-code" so dashboard rollups don't blur Kilo activity into Cline. Tagged Source=jsonl, Reliability=approximate. |
| Kilo Code CLI (current) | (no proxy route yet — base-URL env vars are not honored; a project-scoped kilo.json provider baseURL override reaches the proxy, but the Gateway provider's model-catalog calls share that base URL and have no upstream there — see docs/kilo-code-adapter.md) |
SQLite — ~/.local/share/kilo/kilo.db on every OS (Kilo intentionally mirrors XDG; Windows does NOT use %APPDATA%). The new @kilocode/cli (npm) is a fork of sst/opencode and uses the same message/part/todo tables shape with Kilo additions (project, workspace, event, session_message, account, permission, session_share). Captures token counts + model + cost per assistant message from message.data.tokens = {total, input, output, reasoning, cache: {read, write}}. Tool name coverage inherits OpenCode's surface (read → read_file, bash → run_command, websearch → web_search, etc.). Tagged Source=jsonl, Reliability=approximate. |
| Gemini CLI | (no proxy yet) | JSONL or single-object JSON — ~/.gemini/tmp/<hash>/chats/session-*.{json,jsonl}. Dual-format dispatch: legacy single-object JSON (size-based cursor, cline-style) and proposed JSONL event records (byte-offset cursor, issue #15292). Action mapping covers read_file / write_file / edit_file / run_command / search_files / web_fetch and arbitrary MCP tool calls. Project root falls back through tool-call cwd → ~/.gemini/history/<hash>/.git/config worktree pointer → synthetic [gemini-cli:<hash>] key (promoted via ON CONFLICT DO UPDATE on sessions.project_id once a future scan supplies a real cwd). Tagged Source=jsonl, Reliability=approximate. |
| Hermes Agent (Nous Research) | (provider-routed; uses your existing ANTHROPIC_BASE_URL / OPENAI_BASE_URL when set) |
Hooks + SQLite — Python plugin at ~/.hermes/plugins/superbased-observer/ registers post_tool_call / post_api_request / on_session_start / on_session_end / subagent_stop callbacks (fire-and-forget via observer hook hermes); the watcher walks ~/.hermes/state.db (schema v14, messages.active = 1 filter) and emits ToolEvent + TokenEvent rows via modernc.org/sqlite. 70+ Hermes tools fold into the normalized action set (read_file / write_file / patch / terminal / search_files / web_search / web_extract / browser_* / delegate_task / todo / clarify / memory + mcp_call fall-through). Token bundles lifted from post_api_request.usage{input/output/cache/reasoning_tokens}; OpenRouter :suffix tails (:free, :beta, :fast) preserved so the dashboard distinguishes paid vs free tiers. Install via observer init --hermes; backfill via observer backfill --hermes-rescan. Tagged Source=jsonl, Reliability=approximate. |
JSONL-only clients are captured passively by the watcher whenever
observer start is running. Hooks self-heal on every start, so a
fresh install captures the JSONL side without any init step. You won't see real-time cost numbers
for them on the Compression tab (those need the proxy), but every tool
call shows up on Sessions / Actions / Discovery / Tools / Patterns and
the JSONL-derived token counts feed the Cost tab. Reliability tagging
is per-adapter: Claude Code emits unreliable (the JSONL stream uses
streaming-time placeholder counts per spec §24); Codex / Cline / Cline CLI /
Pi / OpenCode / OpenClaw / Antigravity / Gemini CLI / Hermes / Kilo Code / Kilo Code CLI emit approximate
(provider-reported usage that hasn't been reconciled against an
upstream invoice).
For Codex specifically, Observer currently has two practical support modes:
Proxy + JSONL: Codex is routed throughOPENAI_BASE_URL=http://127.0.0.1:8820/v1and Observer can link proxy turns to the session, so live compression metrics are available.JSONL only: Observer can still recover sessions, actions, and approximate token counts from~/.codex/sessions, but live proxy compression is currently not available when Codex is logged in with a ChatGPT plan on the local machine.
Architecture in detail
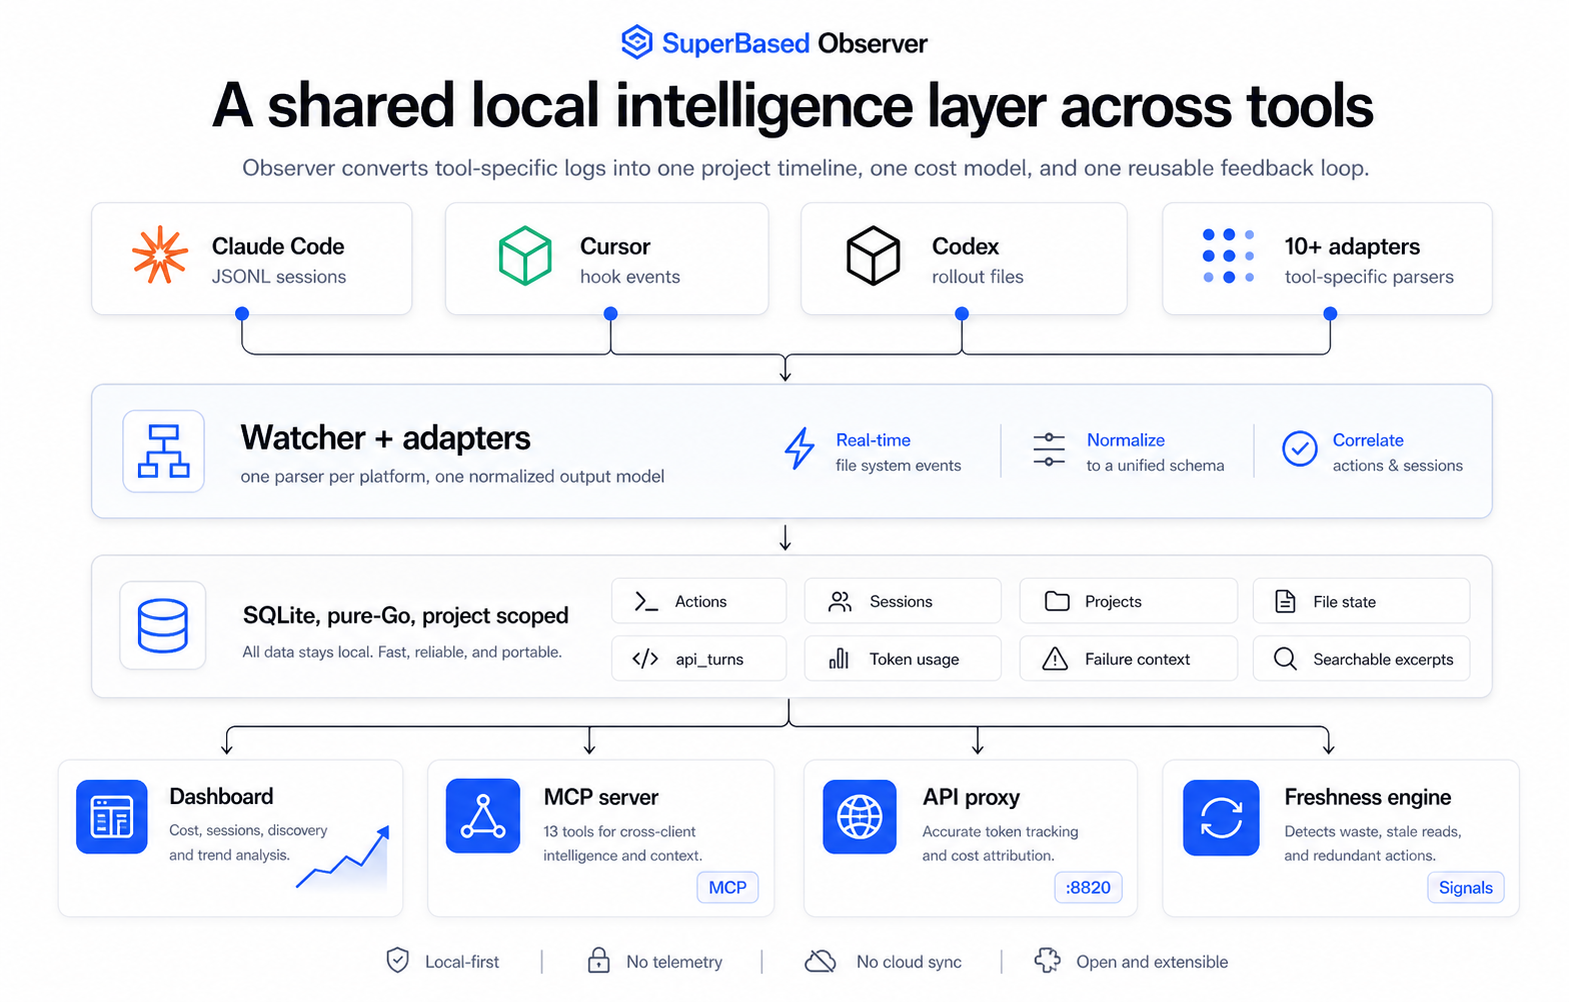
Five components running side by side:
1. JSONL adapters (passive ingest)
Watch ~/.claude/projects/, ~/.codex/sessions/,
~/.gemini/tmp/.../chats/, ~/.gemini/antigravity/conversations/
(and the matching Antigravity index state.vscdb), etc. for new
session log lines. Normalize per-client tool names to a shared
taxonomy (read_file, run_command, spawn_subagent, …) and write
them into the actions table. Active whenever observer start is
running; hooks self-heal on each start so no separate init step is
required for capture.
For Antigravity (which stores conversations as encrypted protobufs),
observer ships a per-OS oscrypt key fetcher (Chromium Safe Storage
pattern: macOS Keychain / Linux libsecret + peanuts fallback / Windows
DPAPI / WSL2-via-PowerShell helper) plus a language_server-aware
gRPC fallback that calls GetCascadeTrajectory through the bundled
antigravity-bridge.exe when local decryption can't validate the
ciphertext. Tier 0–6 ToolEvents (file views, artifact edits/writes,
user prompts, assistant text, run_command terminal snapshots,
structured plan steps, final summaries) are extracted from the
trajectory's wire format without committing to specific .proto field
numbers.
What this gets you: every tool call you've ever run, queryable.
2. API reverse proxy (active capture)
A localhost HTTP server (127.0.0.1:8820) you point your AI client
at via ANTHROPIC_BASE_URL / OPENAI_BASE_URL. Intercepts every
request before it hits Anthropic / OpenAI and:
- Records exact token usage from the upstream
usageenvelope (the most accurate cost source — proxy beats JSONL parsing here). - Runs the conversation compression pipeline to trim large
tool_resultblocks and drop low-importance messages before forwarding upstream. - Captures the
cost_usdthe upstream reports (when present).
What this gets you: ground-truth cost numbers and conversation compression savings you can measure.
3. SQLite store
A single file at ~/.observer/observer.db. Tables include:
projects,sessions,actions— the taxonomyapi_turns— one row per proxy-intercepted upstream requesttoken_usage— JSONL-derived token-row events (deduped via spec §A1)file_state— content hashes for freshness classificationcompression_events— per-event compression detail (post-migration 010)project_patterns— derived patterns fromobserver patternsfailure_context,action_excerpts— diagnostic data
Pure-Go via modernc.org/sqlite, no CGO. WAL mode by default.
4. Local dashboard (:8081)
Fifteen tabs in four groups — Monitor (Overview, Live, Sessions, Actions, Search), Analyze (Cost, Analysis, Tools), Optimize (Compression, Cache, Suggestions, Discovery, Patterns), Configure (Privacy, Settings). See Dashboard tour.
Static HTML + Chart.js. No analytics, no external requests.
5. MCP server (stdio) — opt-in via observer init
13 read-only tools the AI client itself can call mid-conversation —
check_file_freshness, get_last_test_result, search_past_outputs,
etc. (plus retrieve_stashed when the proxy stash is configured).
Powers cross-client tool sharing: if Claude Code ran go test,
Cursor's MCP query for the latest test result will return Claude
Code's run. See MCP tools reference.
Lifecycle: the MCP server is a stdio subprocess spawned by your
AI tool — not by the observer daemon. It's registered into each AI
client's MCP config only when you run observer init. observer start alone does NOT register the MCP server. Adds roughly 1,800
tokens of tool-schema overhead per AI-client turn; opt out with
observer init --skip-mcp (registers hooks only) or by simply not
running init.
Dashboard tour
observer start opens the dashboard automatically on interactive
launches (suppress with --no-open; the URL is also printed —
http://127.0.0.1:8081/ by default). Fifteen tabs in four nav groups
(Monitor / Analyze / Optimize / Configure) — the tour below covers the
core surfaces; Live (recent sessions with a real-time action feed),
Search (full-text over captured tool outputs), and Privacy (capture
map + scrub tester) are self-explanatory once you're in. On an empty
database the Overview tab leads with a three-step onboarding
checklist that takes you from zero to your first captured session
without leaving the browser.
Just looking? The empty-database Overview also offers demo
mode: one click seeds a temporary synthetic dataset so every chart
and table renders with realistic data — parsed through the real
ingest pipeline into a temp DB; your real observer.db is never read
or written. A persistent banner marks demo state, and one click
clears it again. The fastest way to evaluate the dashboard before
routing any real traffic.
Overview tab
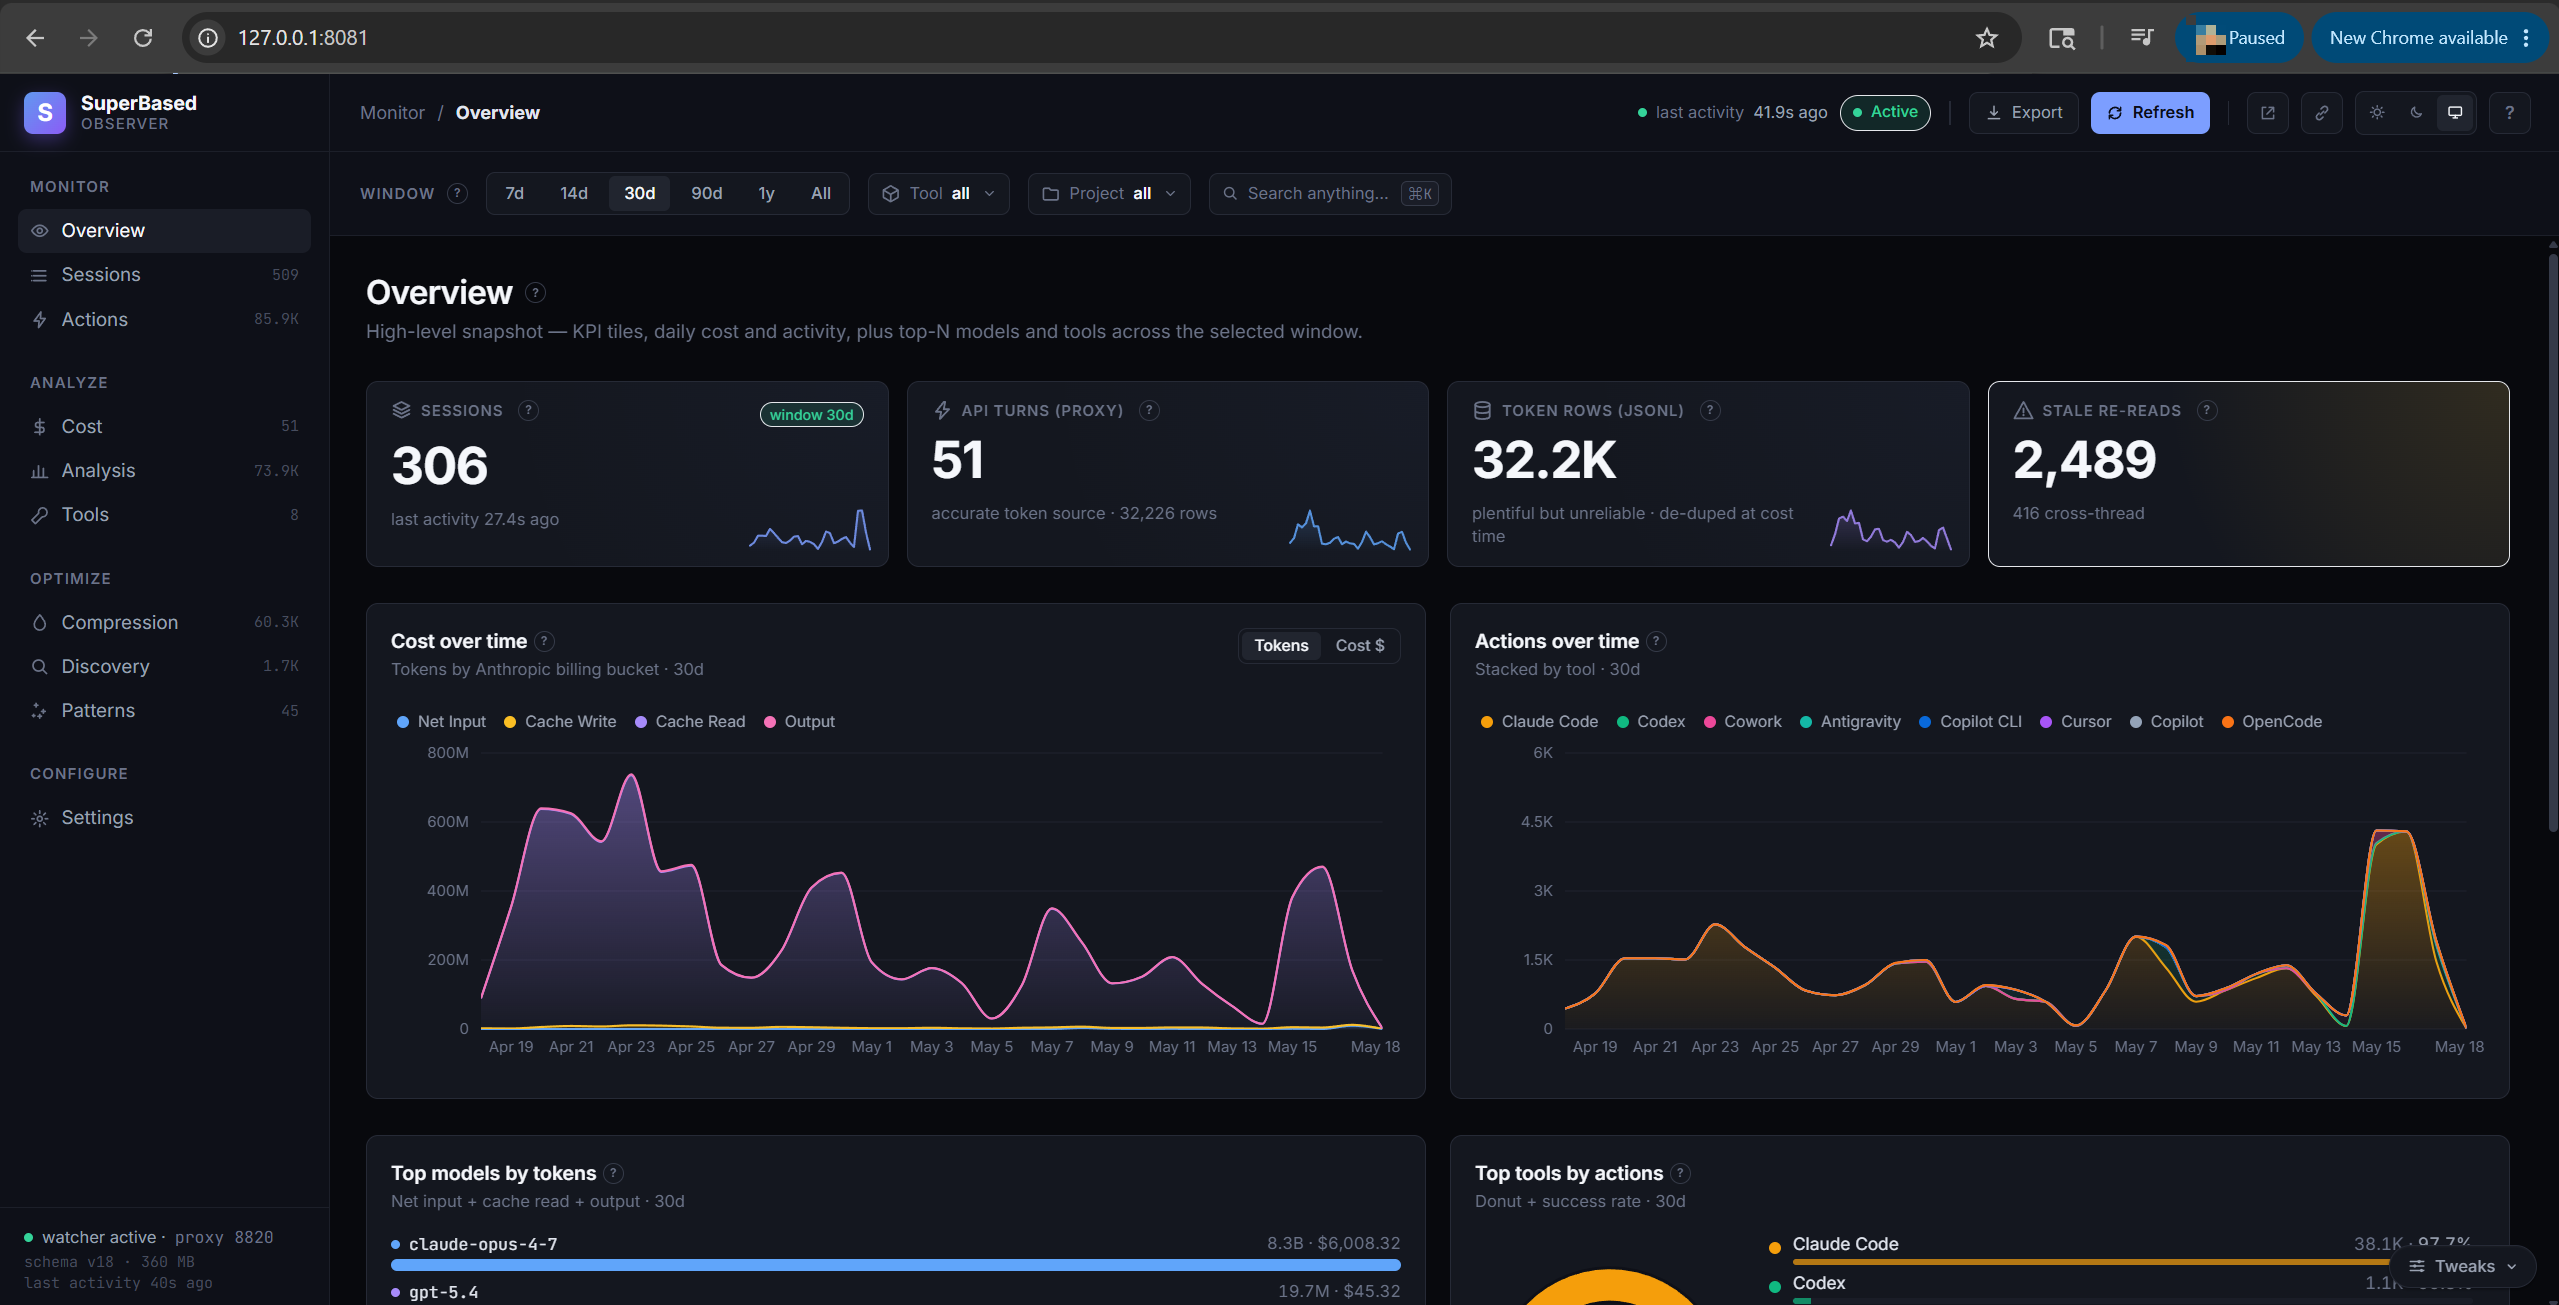
High-level snapshot of the selected window:
- KPI tiles: Sessions count, API turns (proxy-captured), Token rows (JSONL-recovered), Failures (24h)
- Cost over time chart — daily token volume, split into the four billable buckets (net input / cache read / cache write / output)
- Actions over time chart — total actions vs failures
- Top models (by tokens) chart — top-8 models stacked by net input / cache read / output
- Top tools (actions over time) — per-AI-client stacked-area showing when each client is active
Cost tab
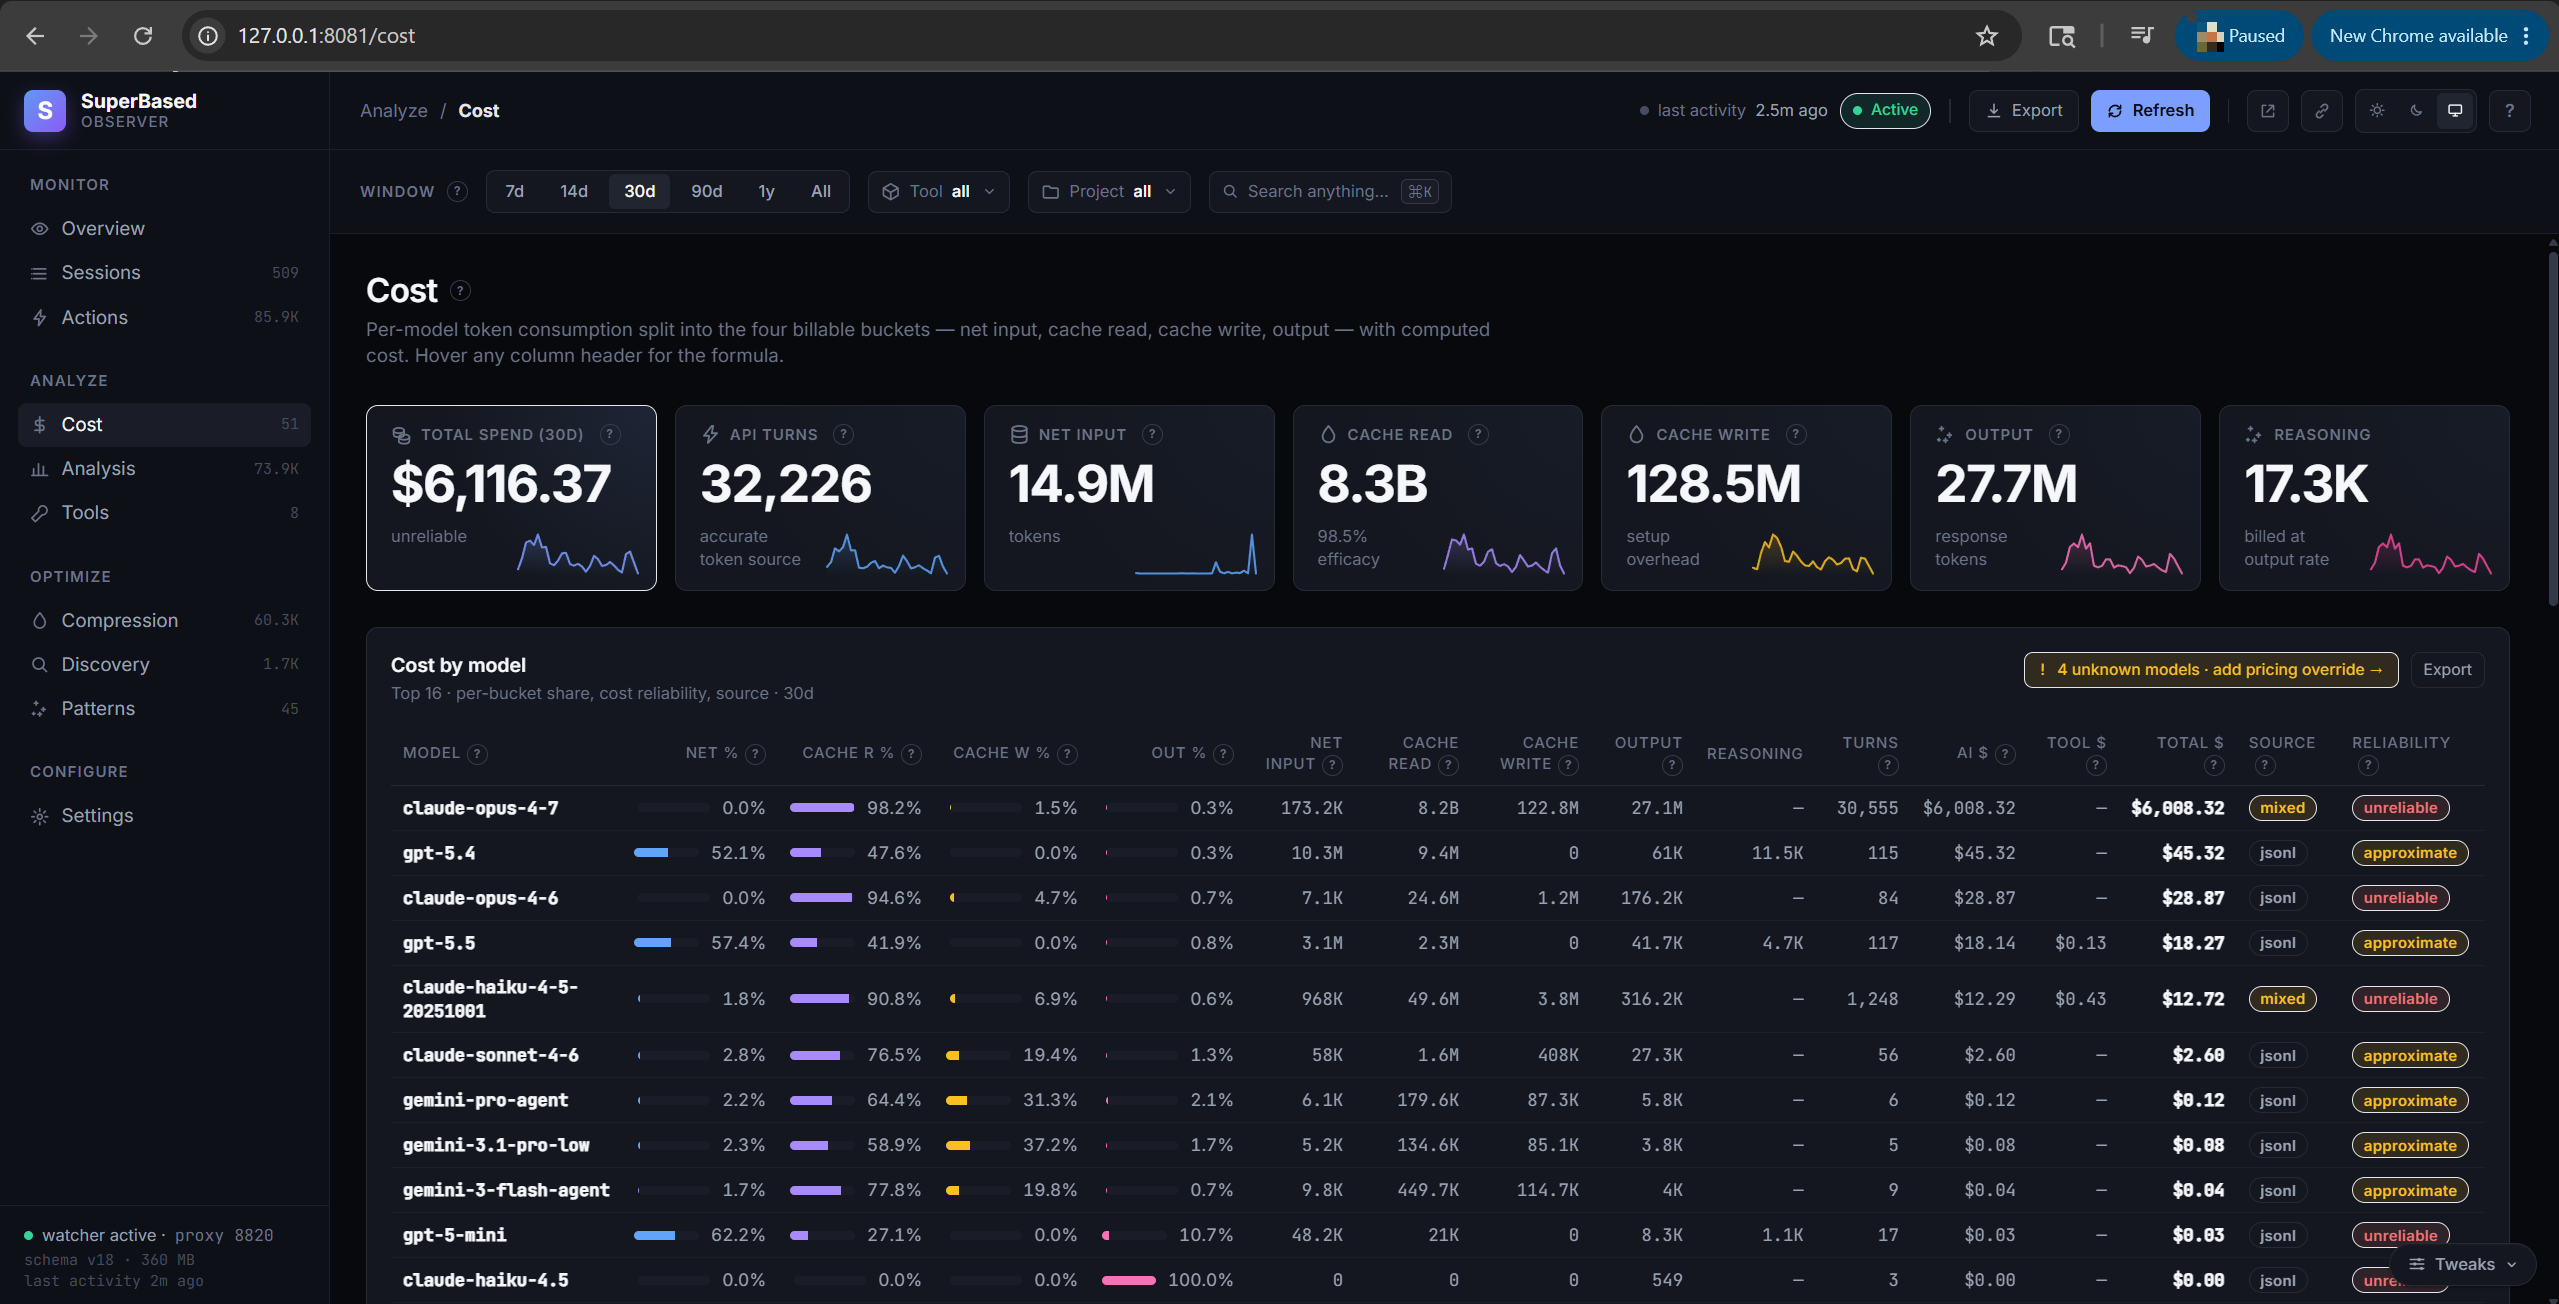
Per-model breakdown over the selected window. Tokens split into the
four billing buckets, with computed dollar cost and a reliability
flag. Cost is always computed locally as tokens × pricing_table[model]
— neither Anthropic nor OpenAI returns cost in their API responses, so
the proxy can't capture upstream-billed cost. Reliability values:
accurate (proxy-captured tokens, exact rate), approximate (JSONL-
sourced tokens, rate may be a family-prefix fallback), unreliable
(Claude Code JSONL streaming placeholders, ~10% off output), unknown
(no pricing entry for the model). Two adapters — OpenCode and Pi —
write their own per-turn cost into estimated_cost_usd; the engine
uses those as-is when present. See
docs/pricing-reference.md for the rate sheet.
Hover any column header for tooltip; click for the full definition in the help drawer.
Analysis tab
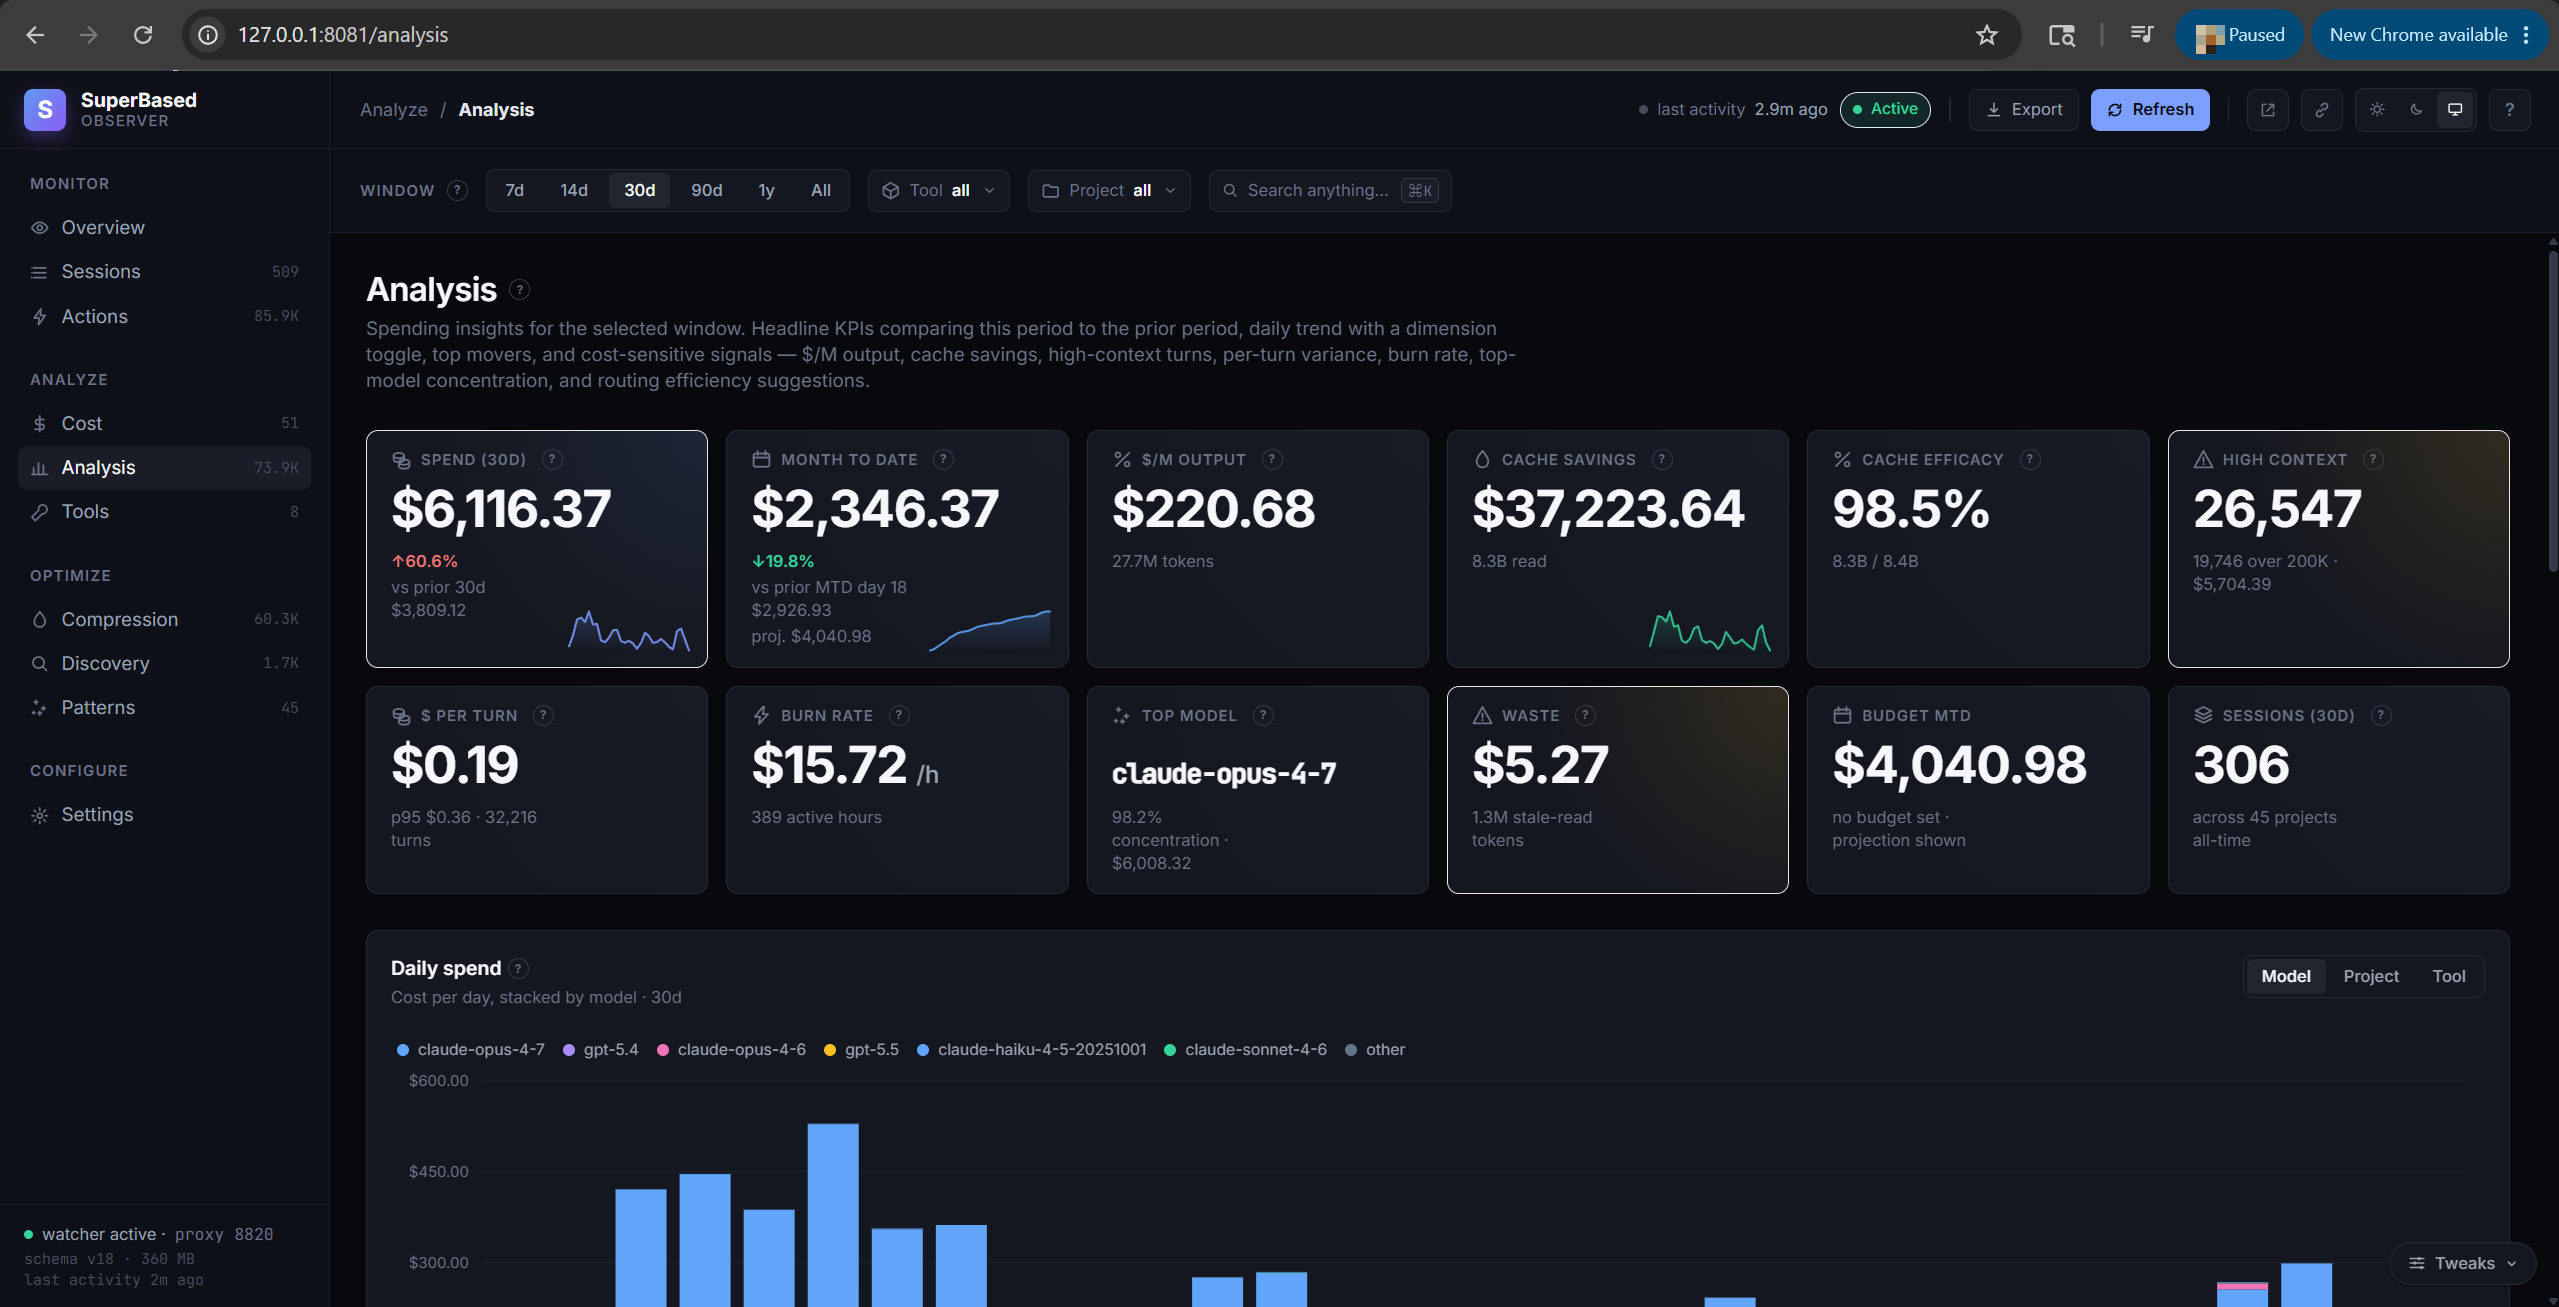
Spending insights for the selected window. Twelve headline KPI
tiles comparing this period to prior: spend Δ%, MTD vs budget with
projection bar, $/M output rate, cache savings + cache efficacy %,
high-context turn count, $/turn, burn rate ($/active hour), top
model concentration %, Discovery waste $, sessions total. Below
the tiles: a daily-spend stacked bar with Model / Project / Tool
dimension toggle, hour-of-day heatmap, top-12 expensive sessions
with explanatory badges (opus, lc_tier, many_turns,
large_prompt), period-over-period movers (top increases / decreases
/ new entrants), and routing-efficiency suggestions (trivial Opus
sessions that could have used Sonnet).
Sessions tab
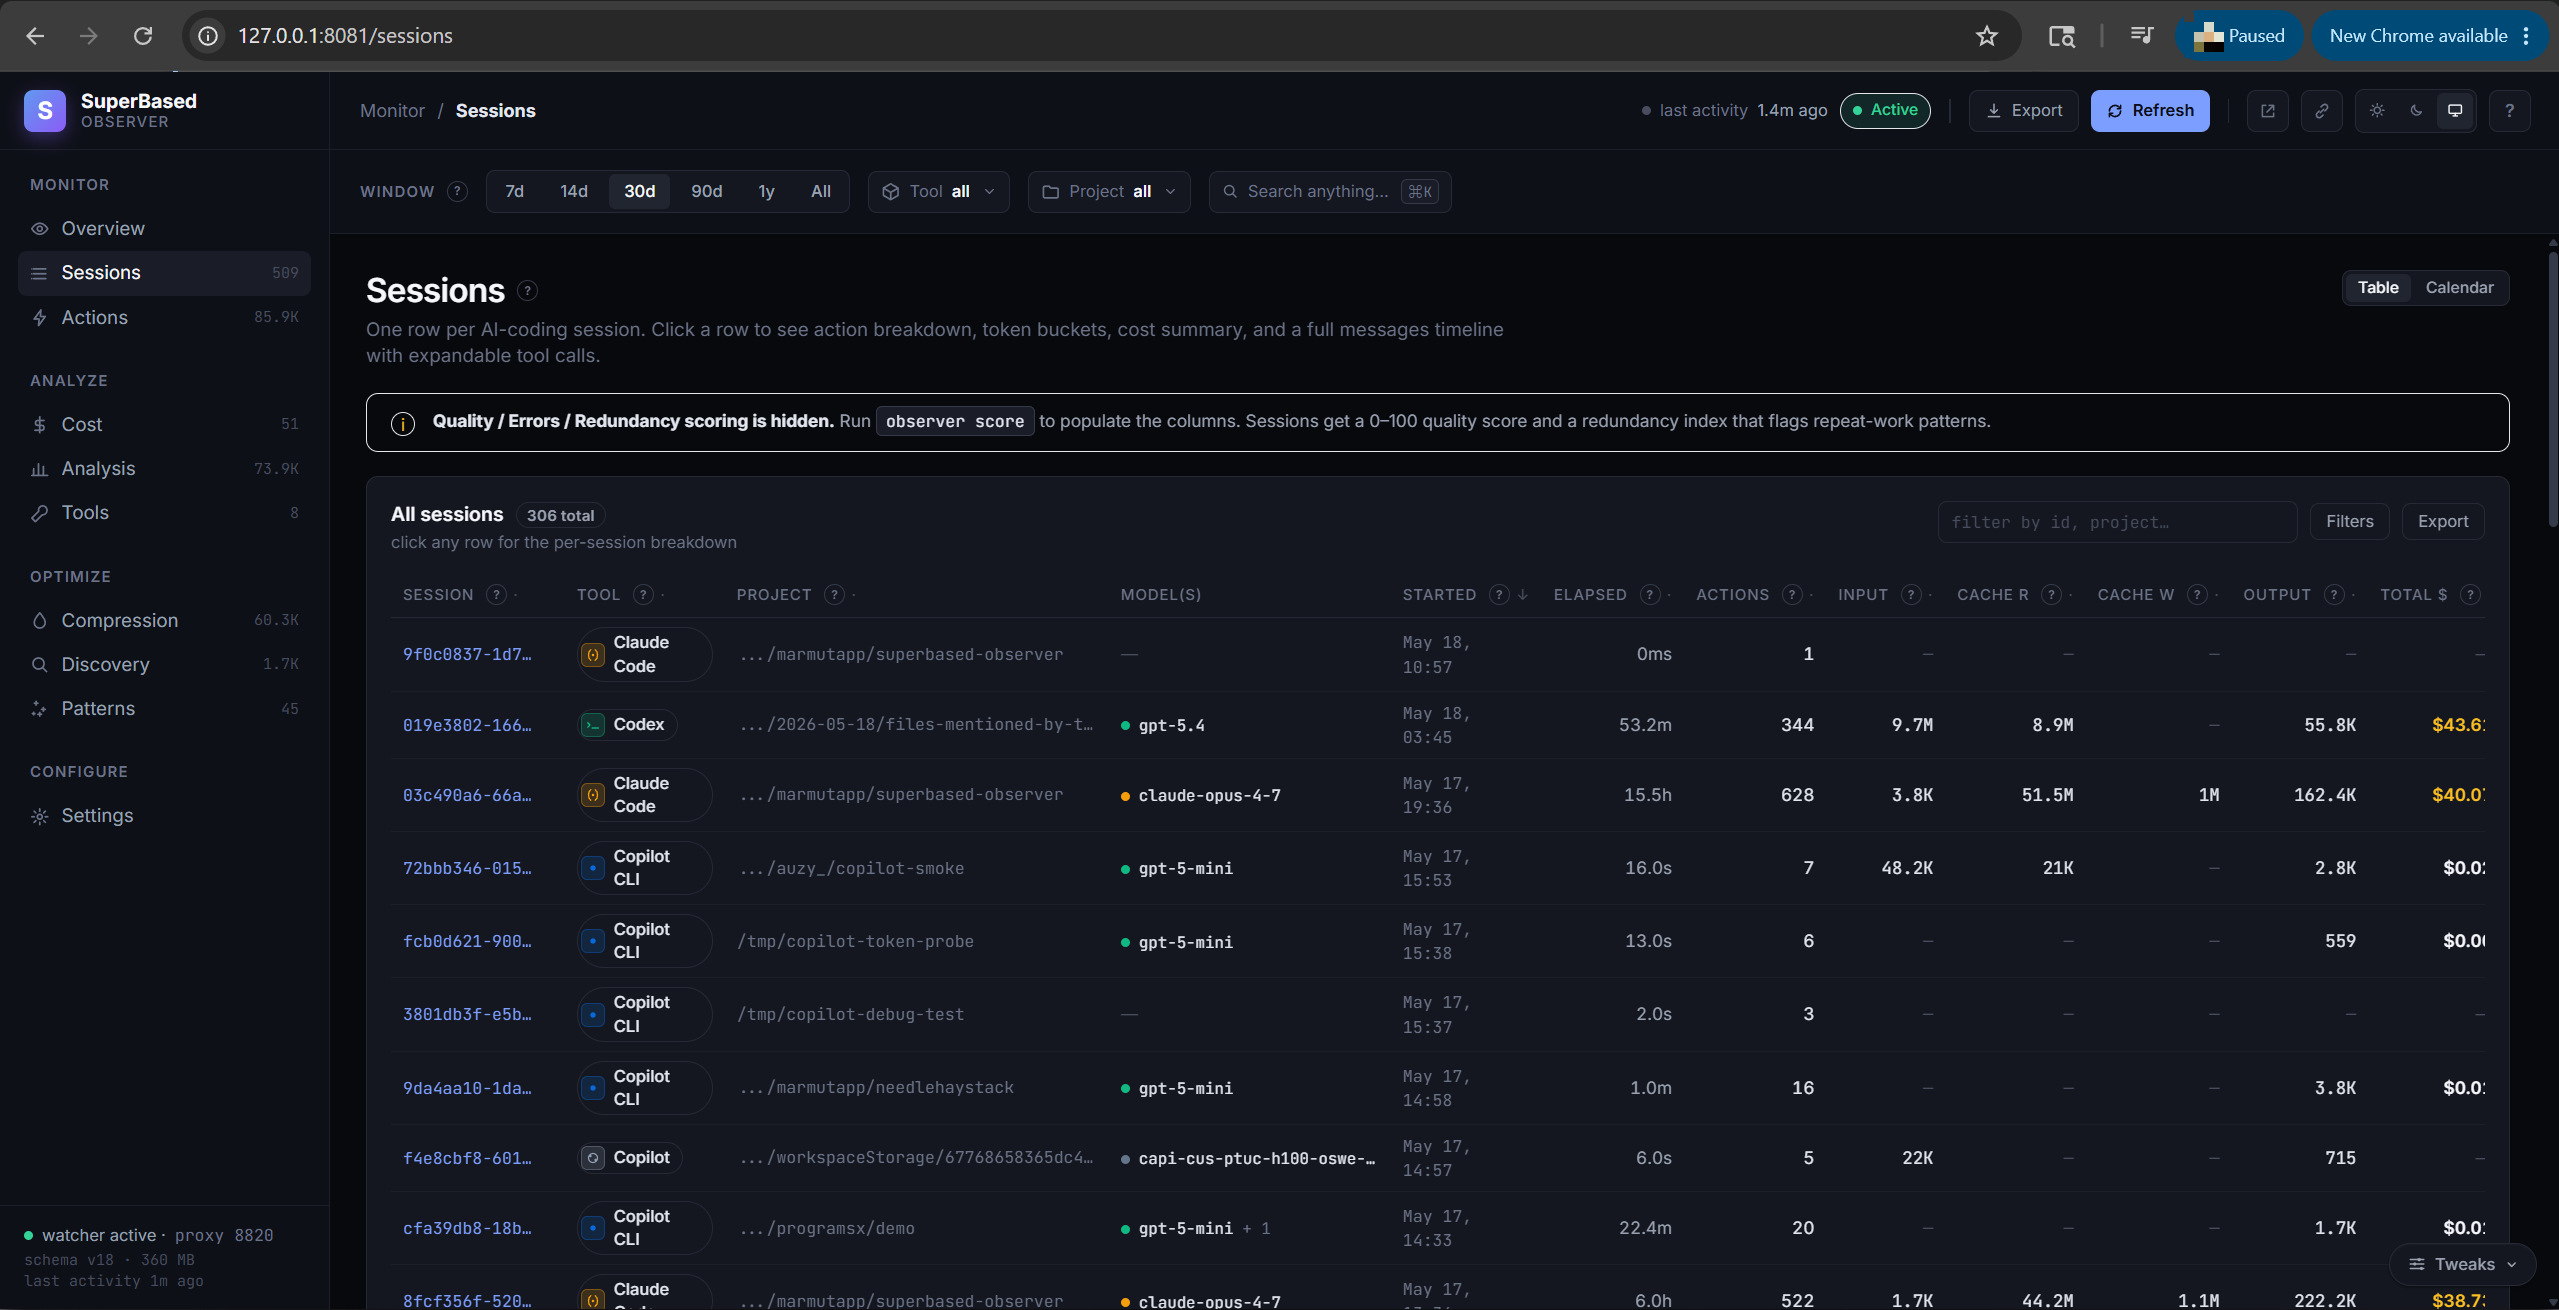
One row per AI-coding session. Each session has a stable ID, a tool
(claude-code / cursor / codex / cline / cline-cli / copilot / copilot-cli /
opencode / openclaw / pi / antigravity / gemini-cli / hermes /
kilo-code / kilo-code-cli), a working-directory project, action
count, sub-agent action count (when the session spawned sub-agents via
the Agent tool), per-session Tokens and Cost columns, and —
if observer score has run — quality / errors / redundancy ratios. The ~ suffix on Cost flags rows whose pricing
was tier-fallback rather than billing-grade ("accurate" reliability).
Click a row to open the session-detail panel:
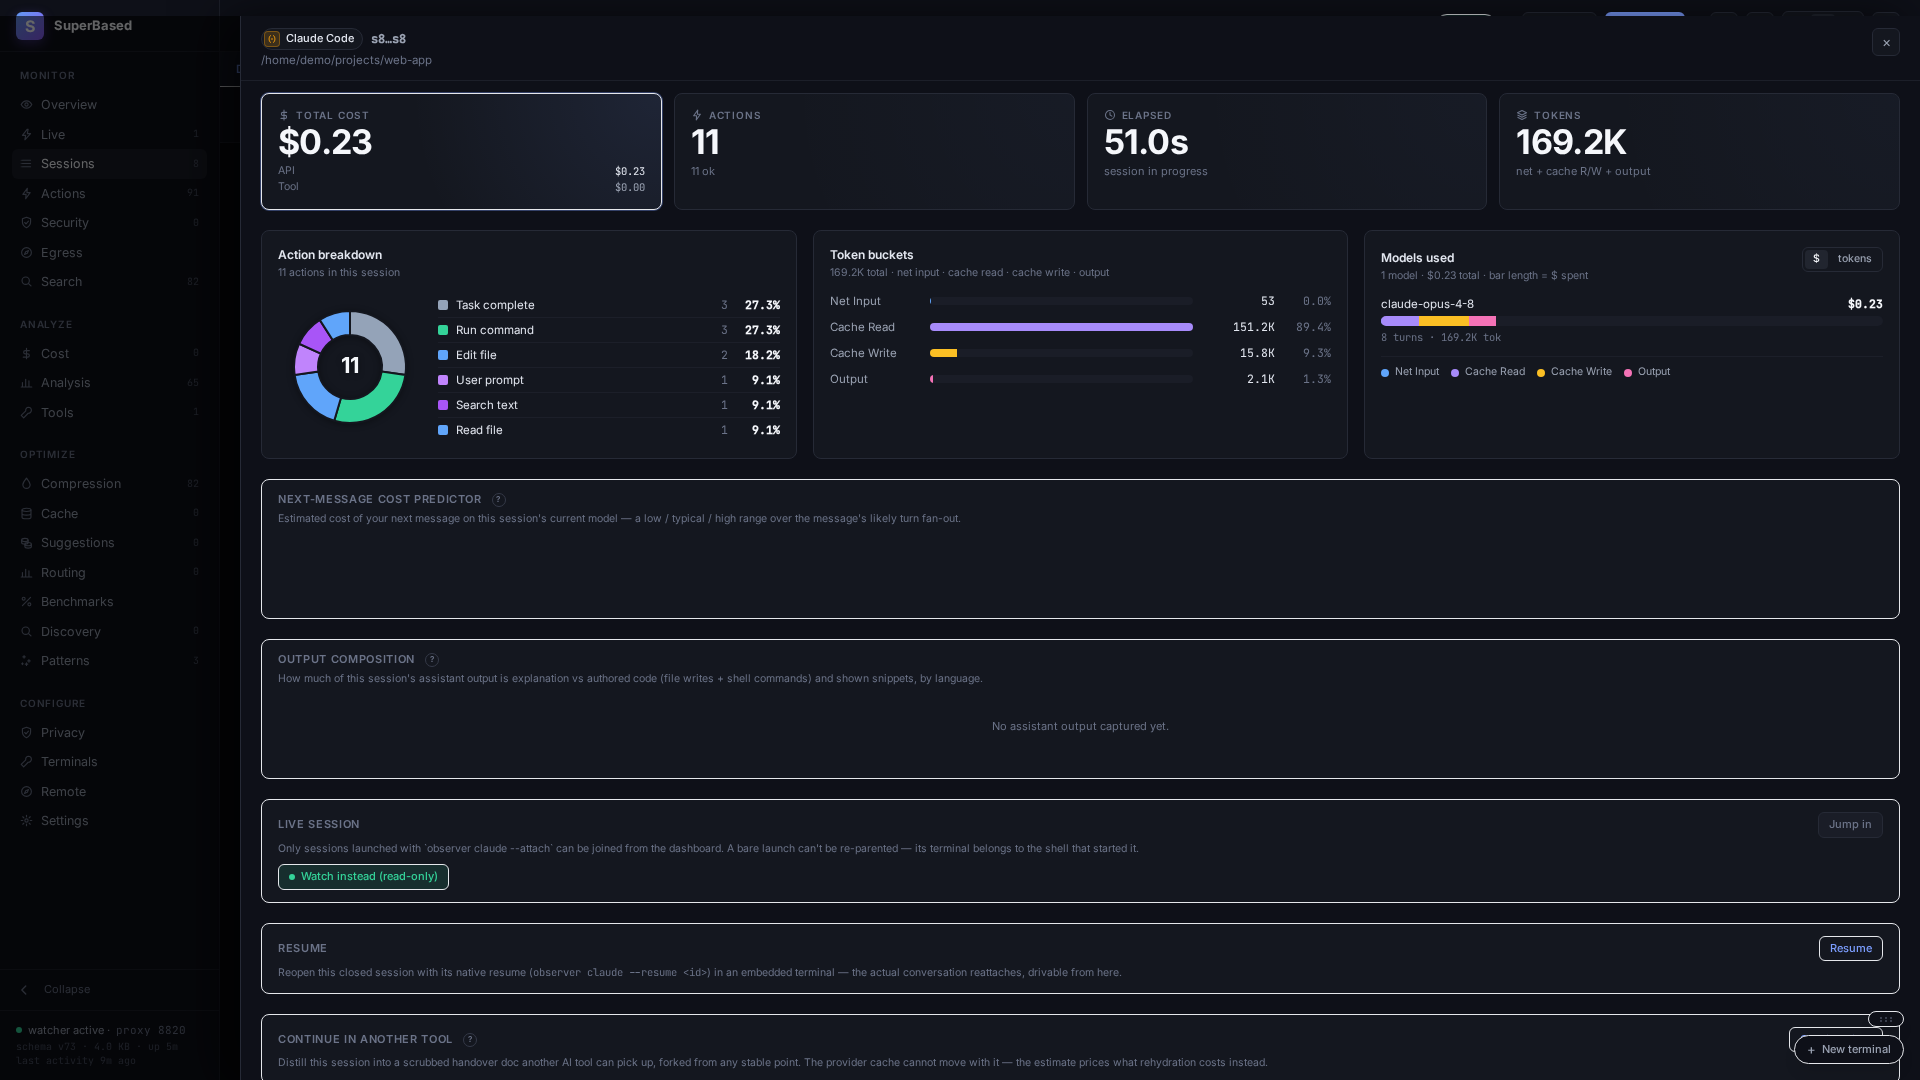
- Top tiles — Tool, Started, Actions count (ok/fail), Cost.
- Action breakdown — chart of action_type counts.
- Tokens — the four billing buckets (Net Input / Cache Read / Cache Write / Output) for the whole session, per-turn-deduped (proxy preferred, JSONL fills gaps).
- Per-model breakdown — when a session uses multiple models (Claude Code's main + sub-agent dispatches always do), a row per model with its tokens and cost.
- Messages — per-message timeline keyed on the upstream
Anthropic
msg_xxx. Each row shows the message id, role, model, the message's own token bucket, cost, and aN ▾pill that expands inline to show the contained tool calls. Toggle radio at the top: Tool messages only (default — assistant turns with ≥1 tool call + user prompts) vs All messages (also pure-text assistant replies). Truncated IDs (session_id, message_id) show a dotted underline on hover and copy the full value to clipboard on click; truncated text fields (target, error message) click to expand in-place. Server-side paginated at 50/100/200 messages per page (selectable in the panel footer) — keeps the browser responsive on multi-thousand-message sessions. Requiresobserver backfill --message-idon first upgrade for historical sessions to surface their parent message ids.
Actions tab
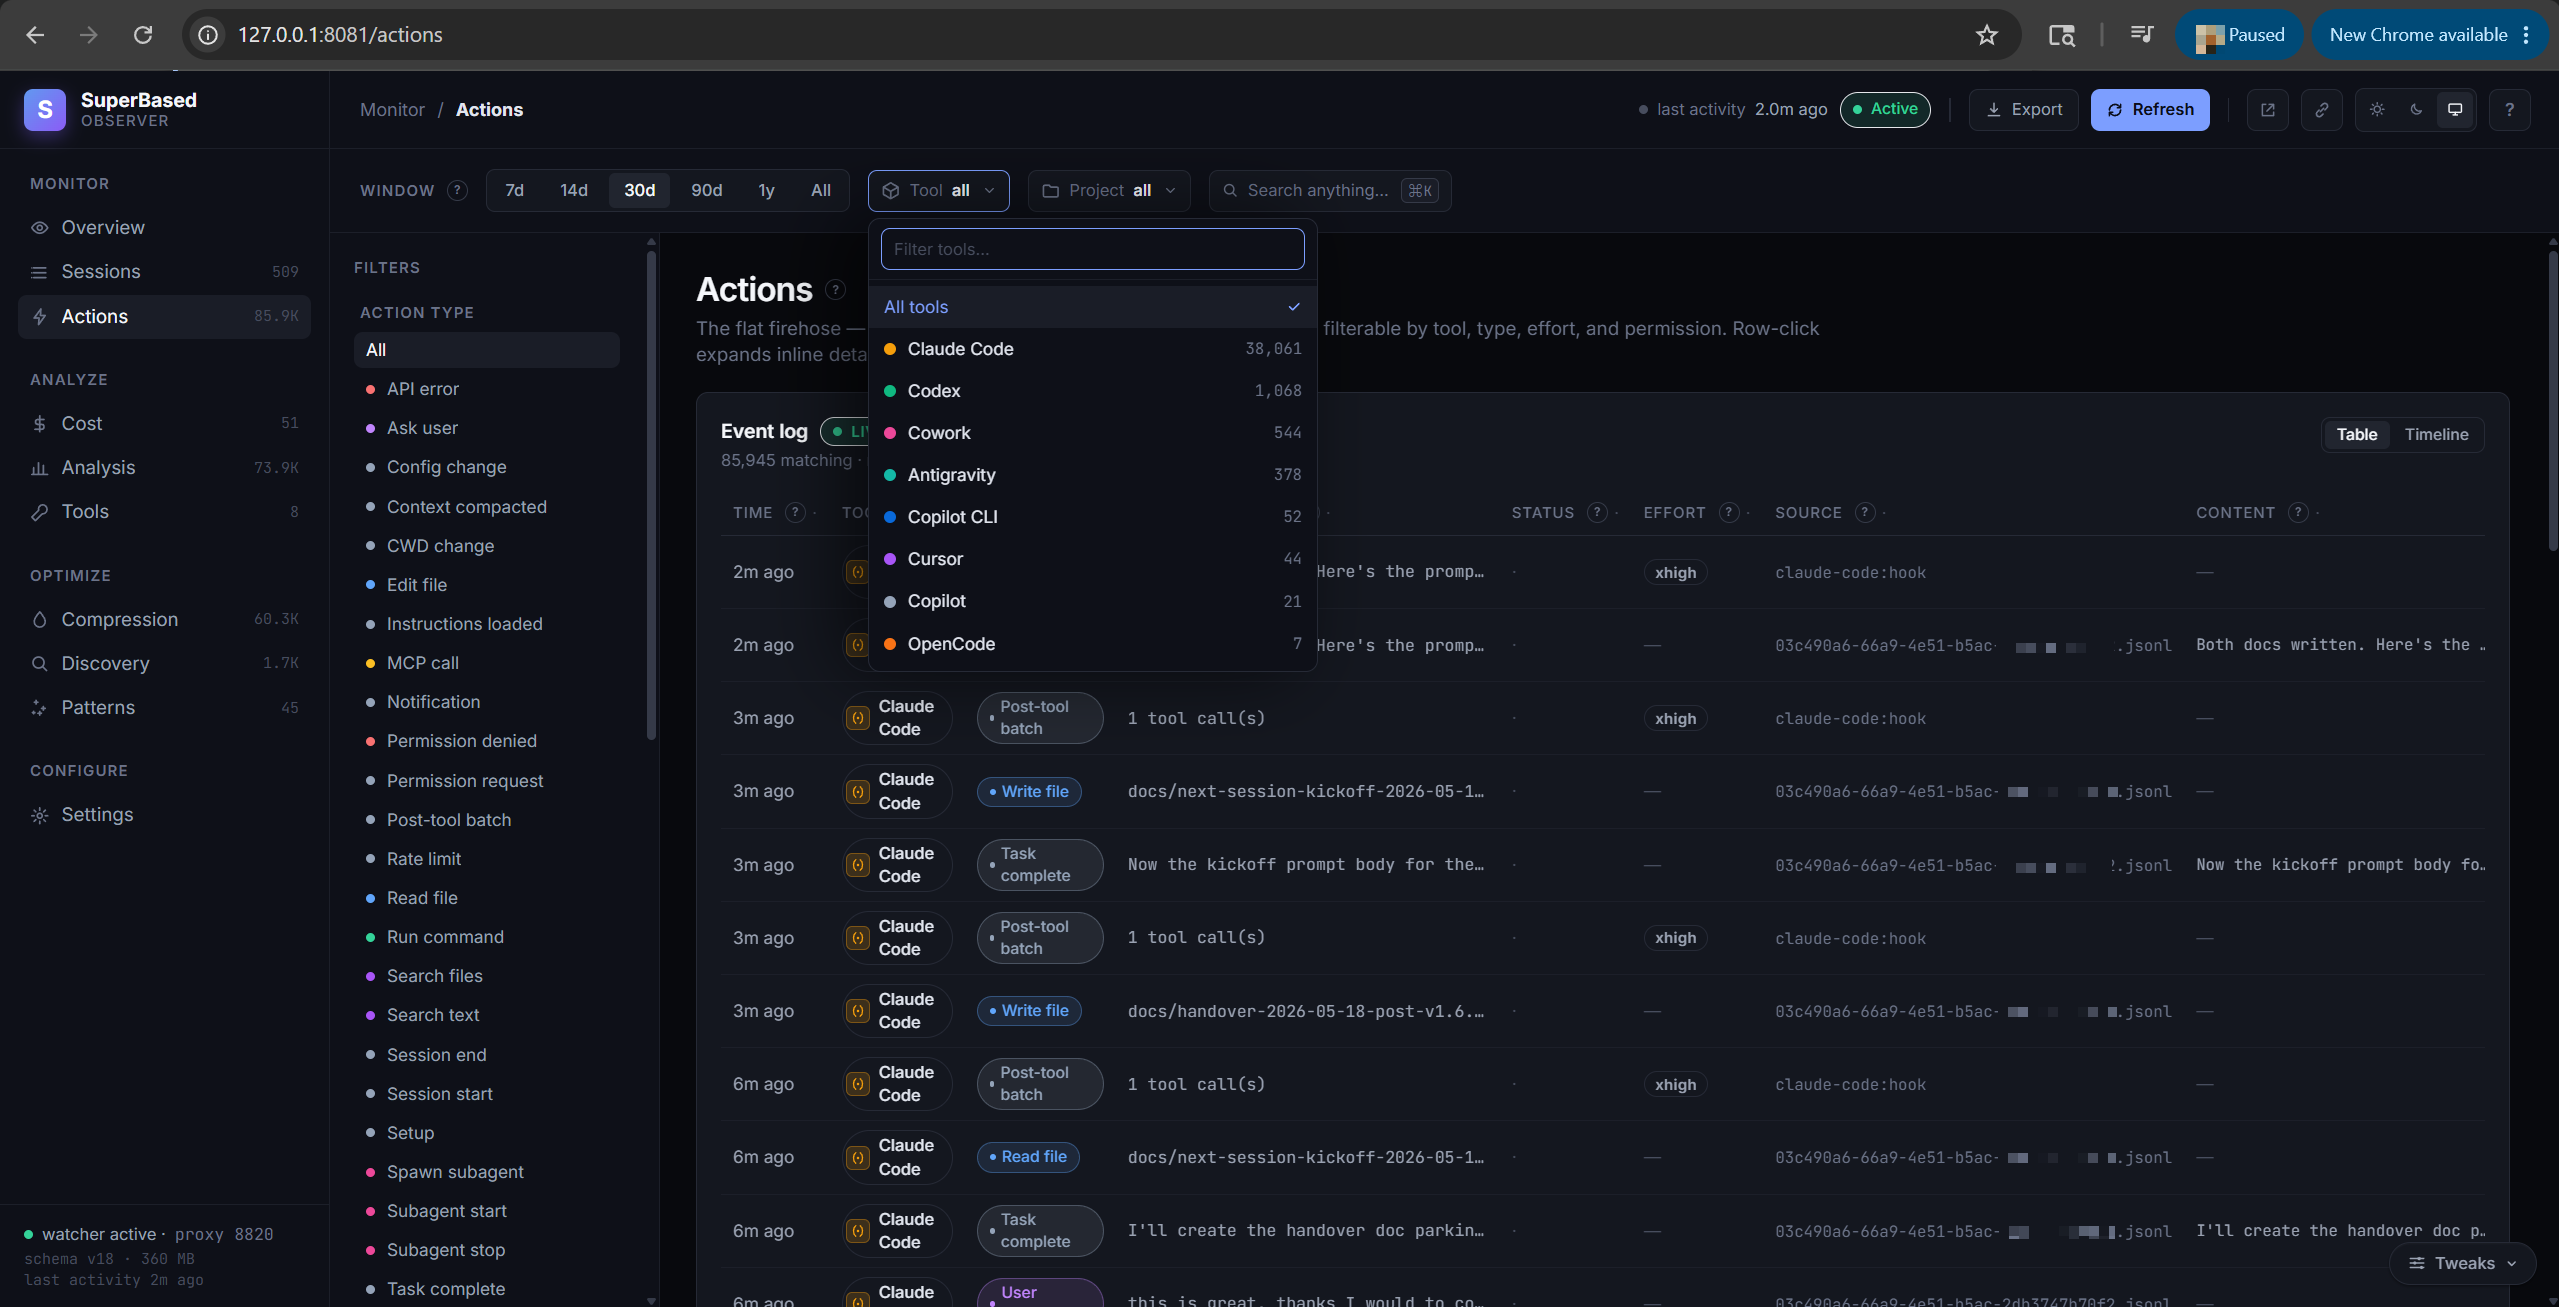
The flat firehose: every recorded tool call, normalized across
adapters. Filter by action type (read_file, write_file,
run_command, spawn_subagent, todo_update, mcp_call, …).
Pagination caps at 50 rows per page; total count is shown next to
the heading.
Tools tab
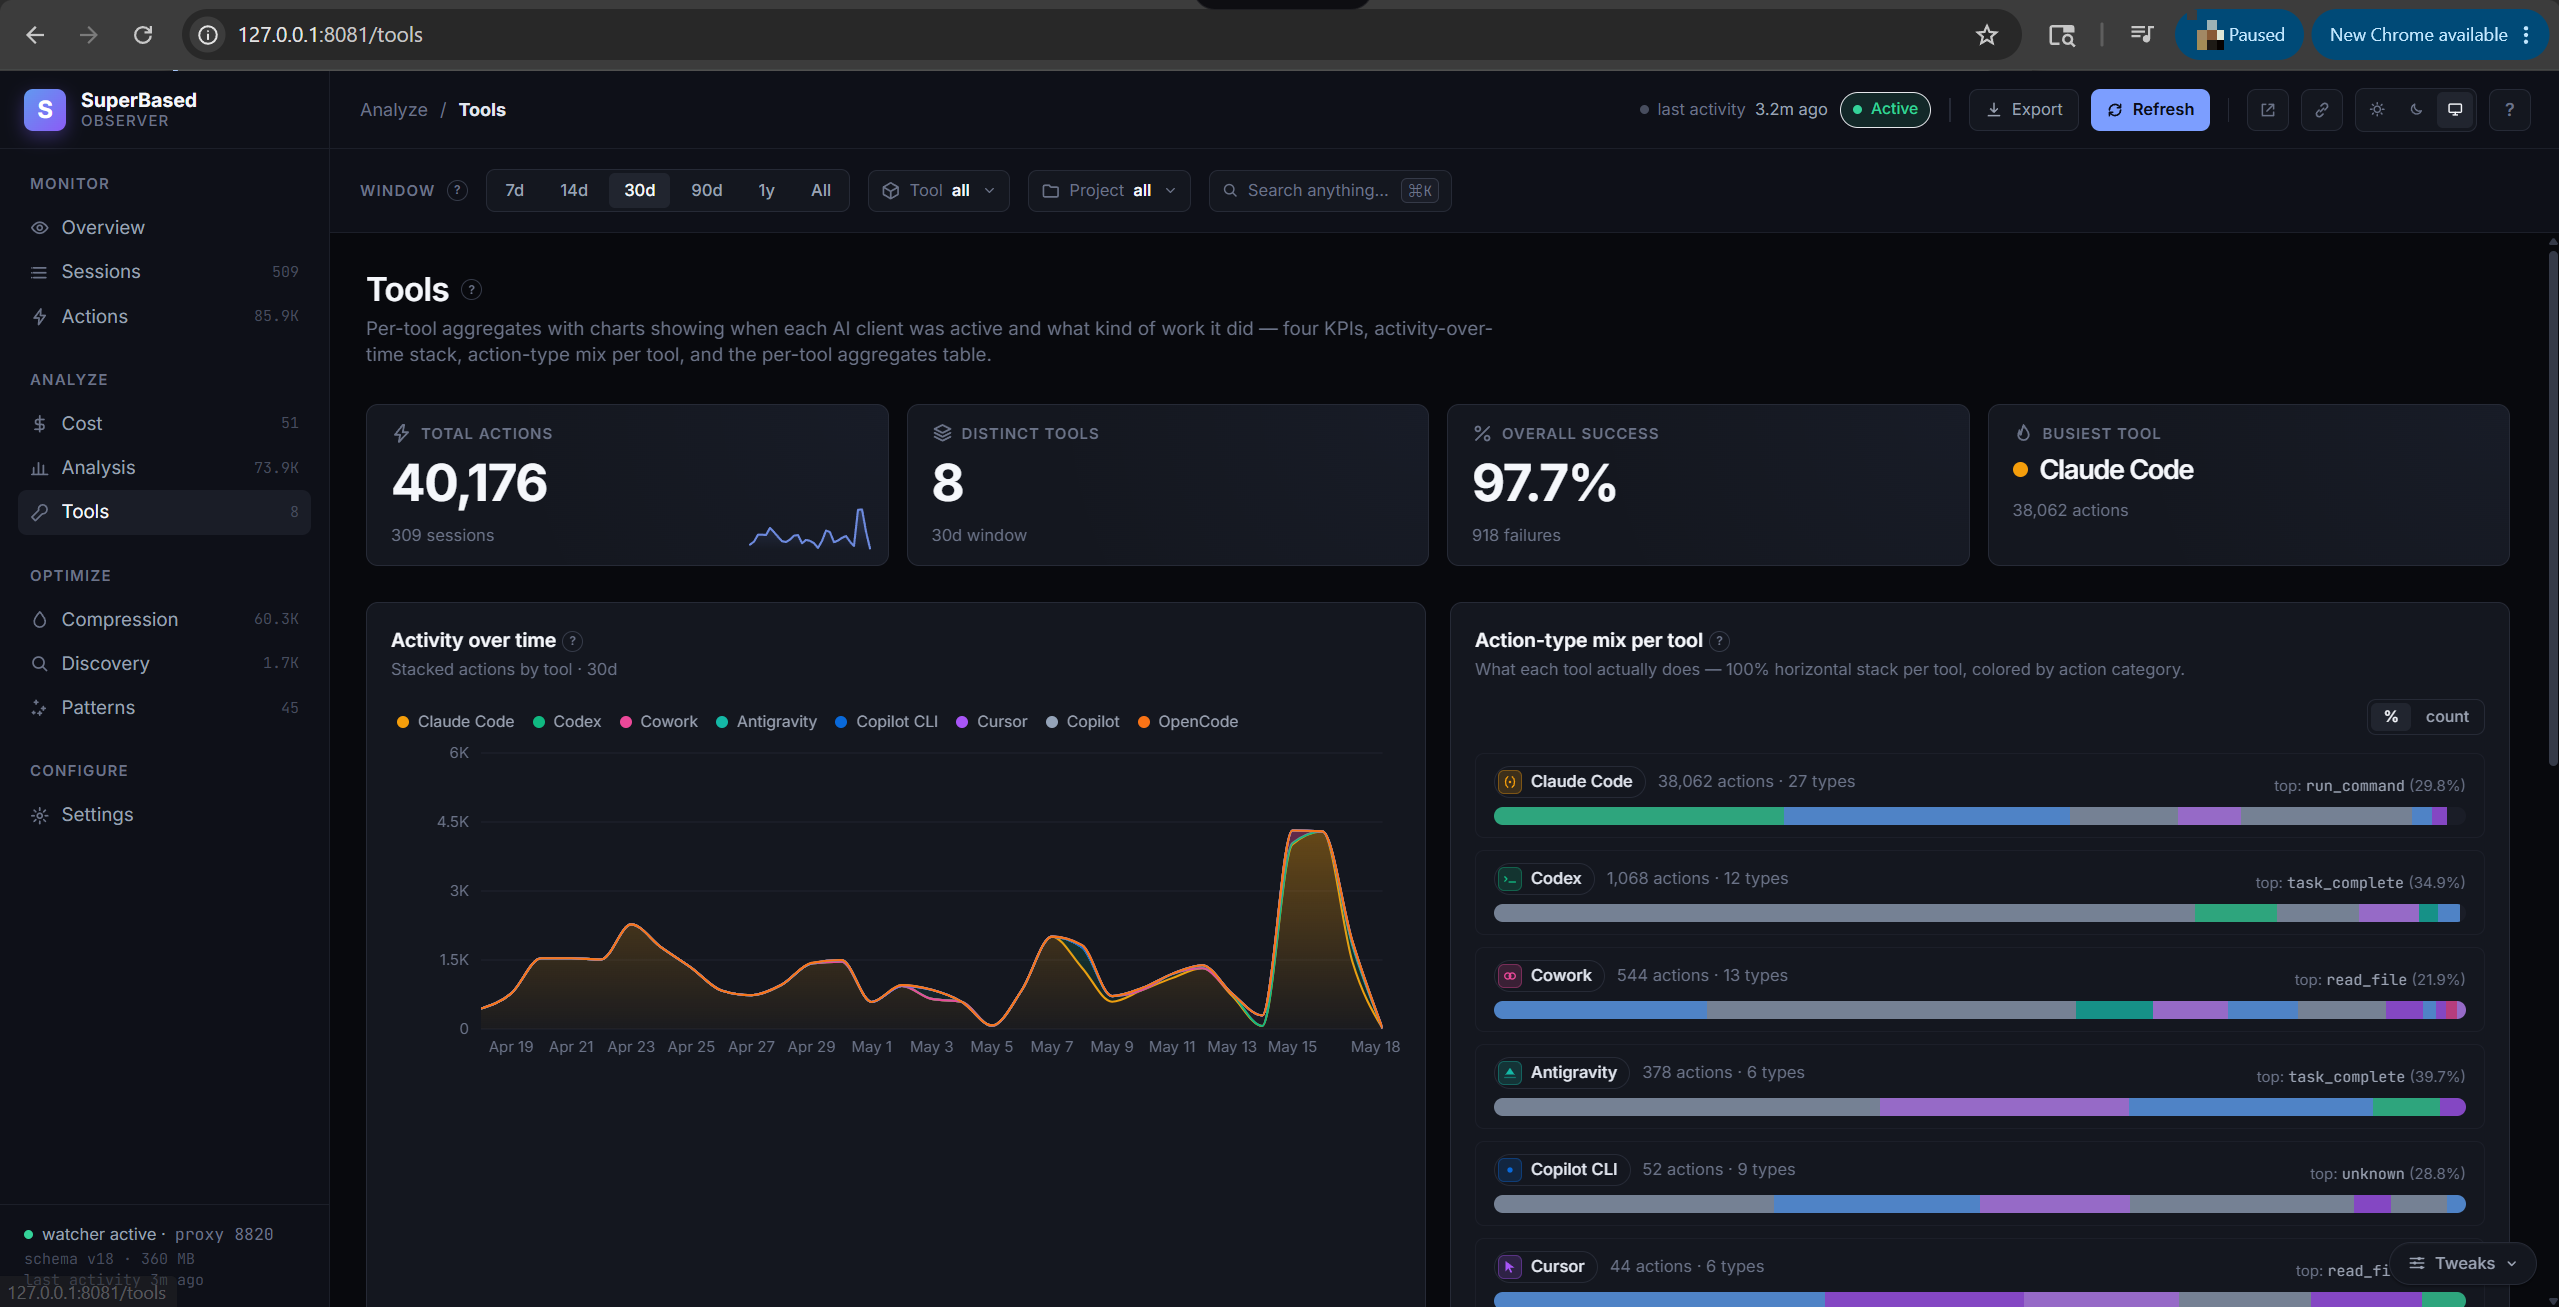
Per-AI-client (the client — claude-code / cursor / codex / etc., not the per-tool name) aggregates plus three views:
- KPI tiles: Total actions, Distinct tools, Overall success rate, Busiest tool
- Activity over time stacked-area showing per-tool action volume per day
- Action-type mix per tool horizontal stacked bar — what each tool actually does (read_file vs edit_file vs run_command vs search_text vs spawn_subagent)
- The full per-tool aggregate table with first/last seen
Compression tab
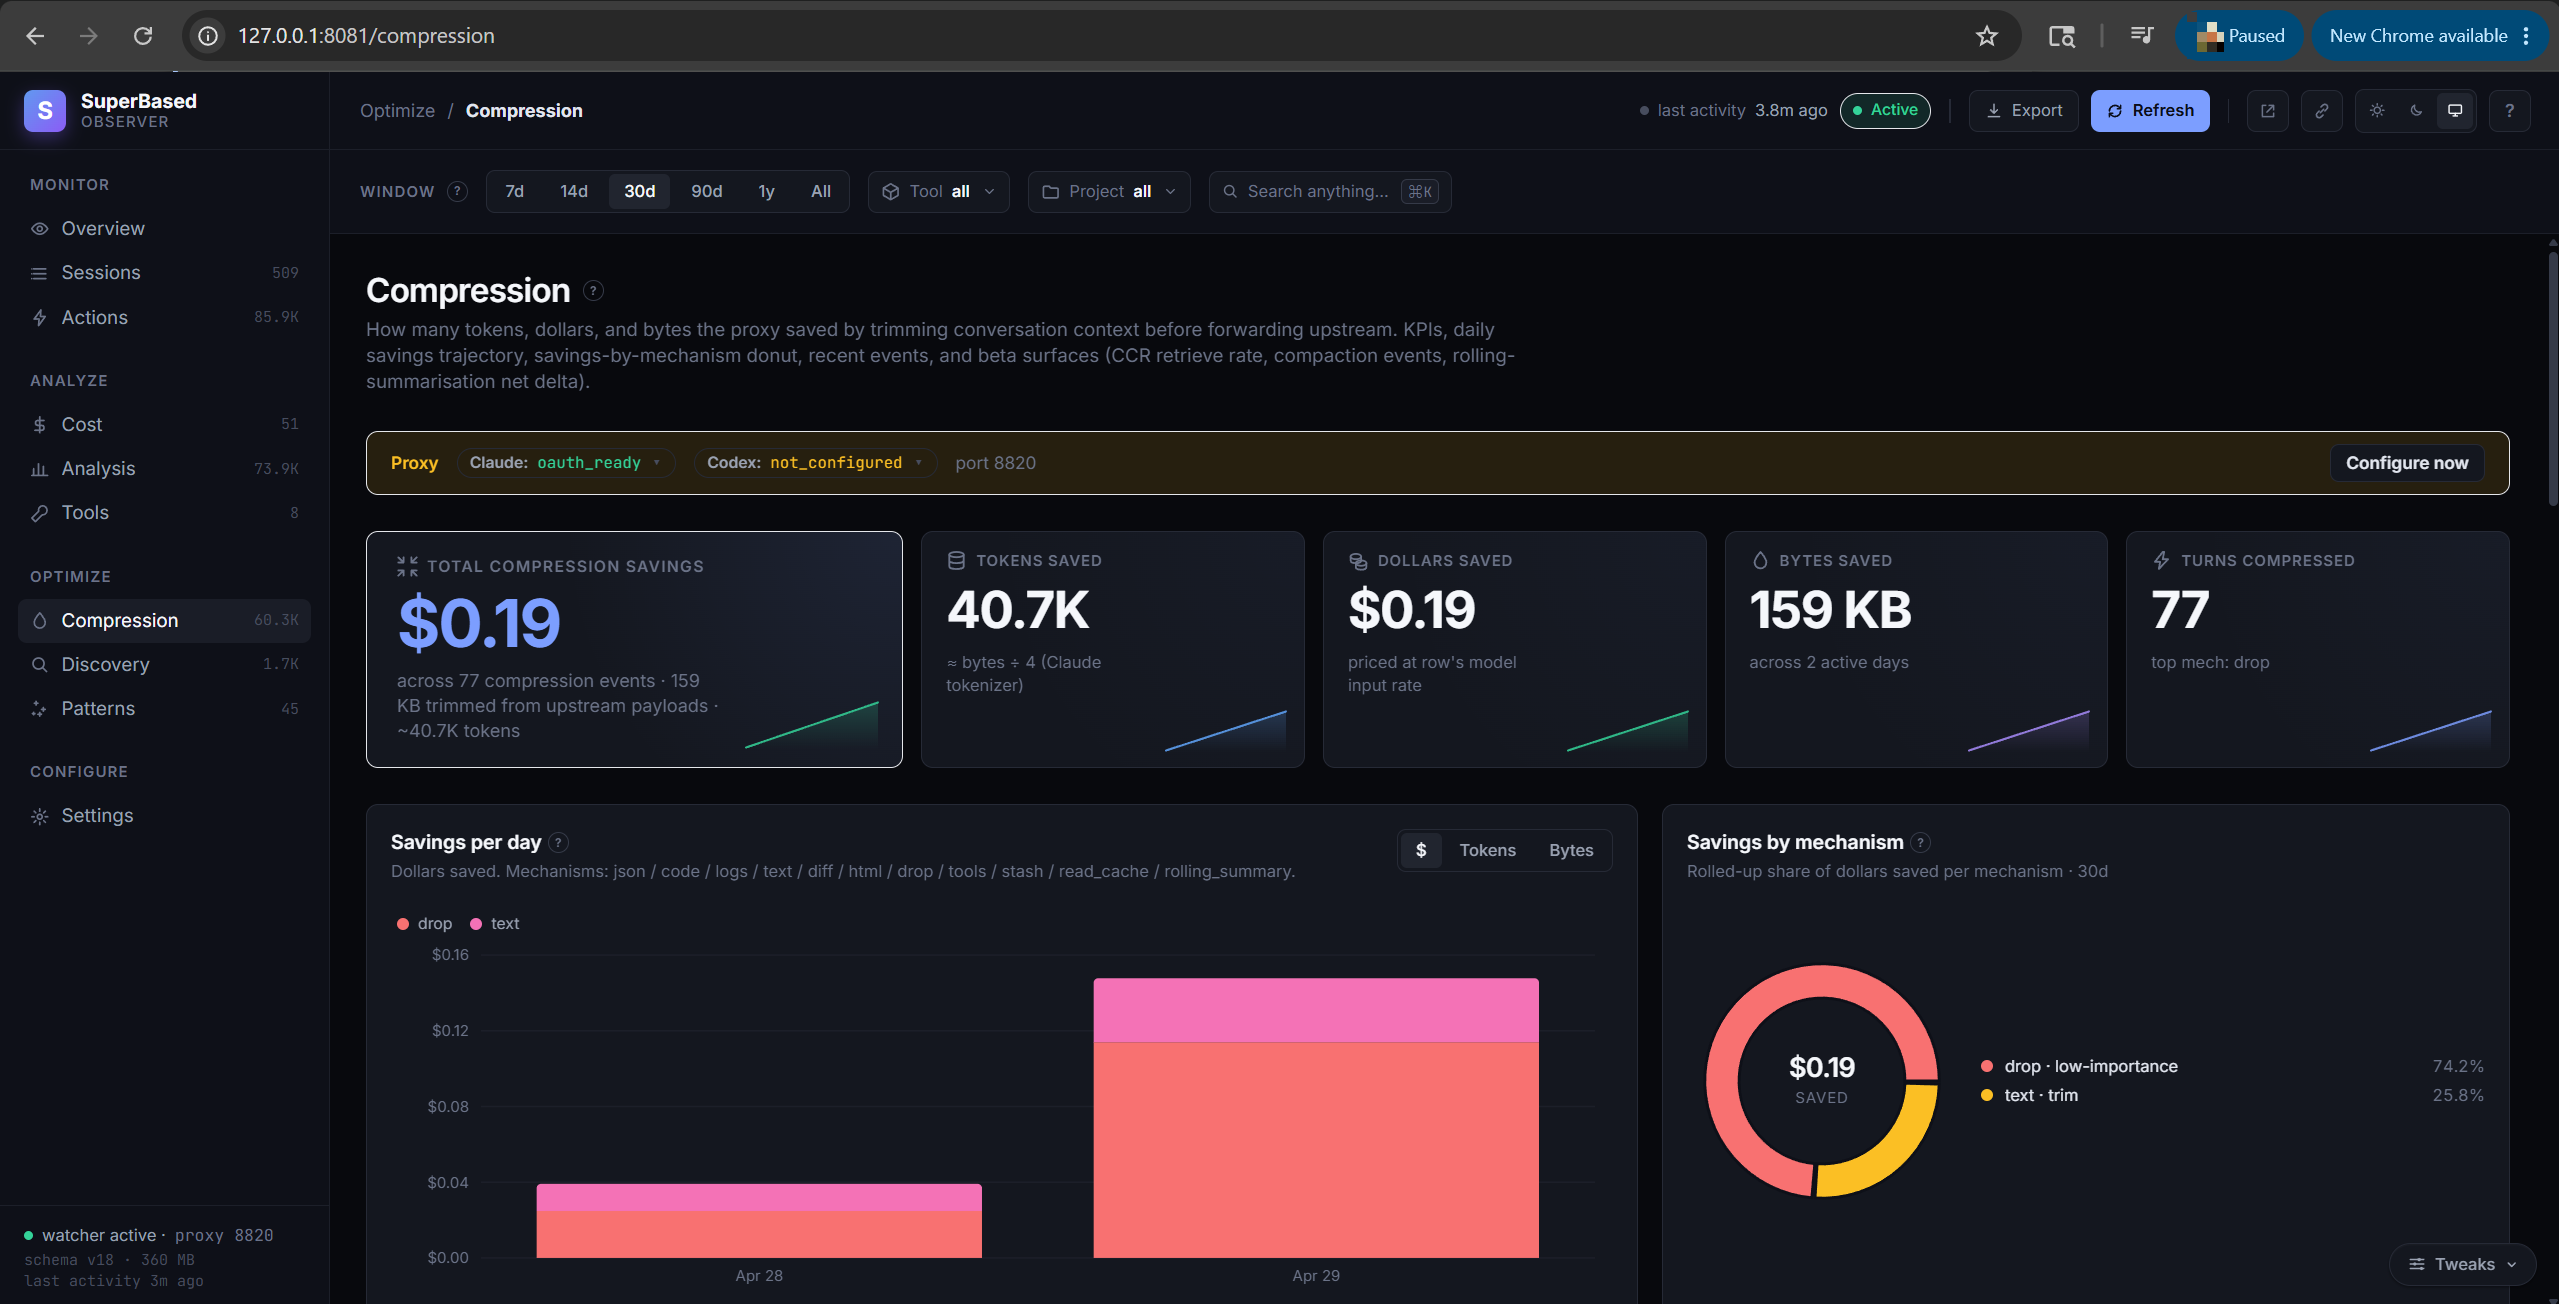
How many tokens and dollars the conversation-compression pipeline saved by trimming requests before forwarding upstream:
- KPI tiles: Tokens saved (est.), Dollars saved (est.), Bytes saved, Turns compressed
- Savings per day chart — daily tokens-saved (left axis) and bytes-saved (right axis)
- Savings by mechanism stacked bar — segments per mechanism (json / code / logs / text / diff / html / drop). Toggle the y-axis between tokens and bytes with the chart-header switch.
- Per-model breakdown table — tokens saved ~, $ saved ~, bytes saved, saved %, turns, tool-results compressed, dropped, markers
- Recent compression events — paginated per-event detail with mechanism, original / compressed / saved bytes, message slot, importance score (for drops), and a Source column showing whether the event came from a main-thread or sub-agent runtime call
Cache tab
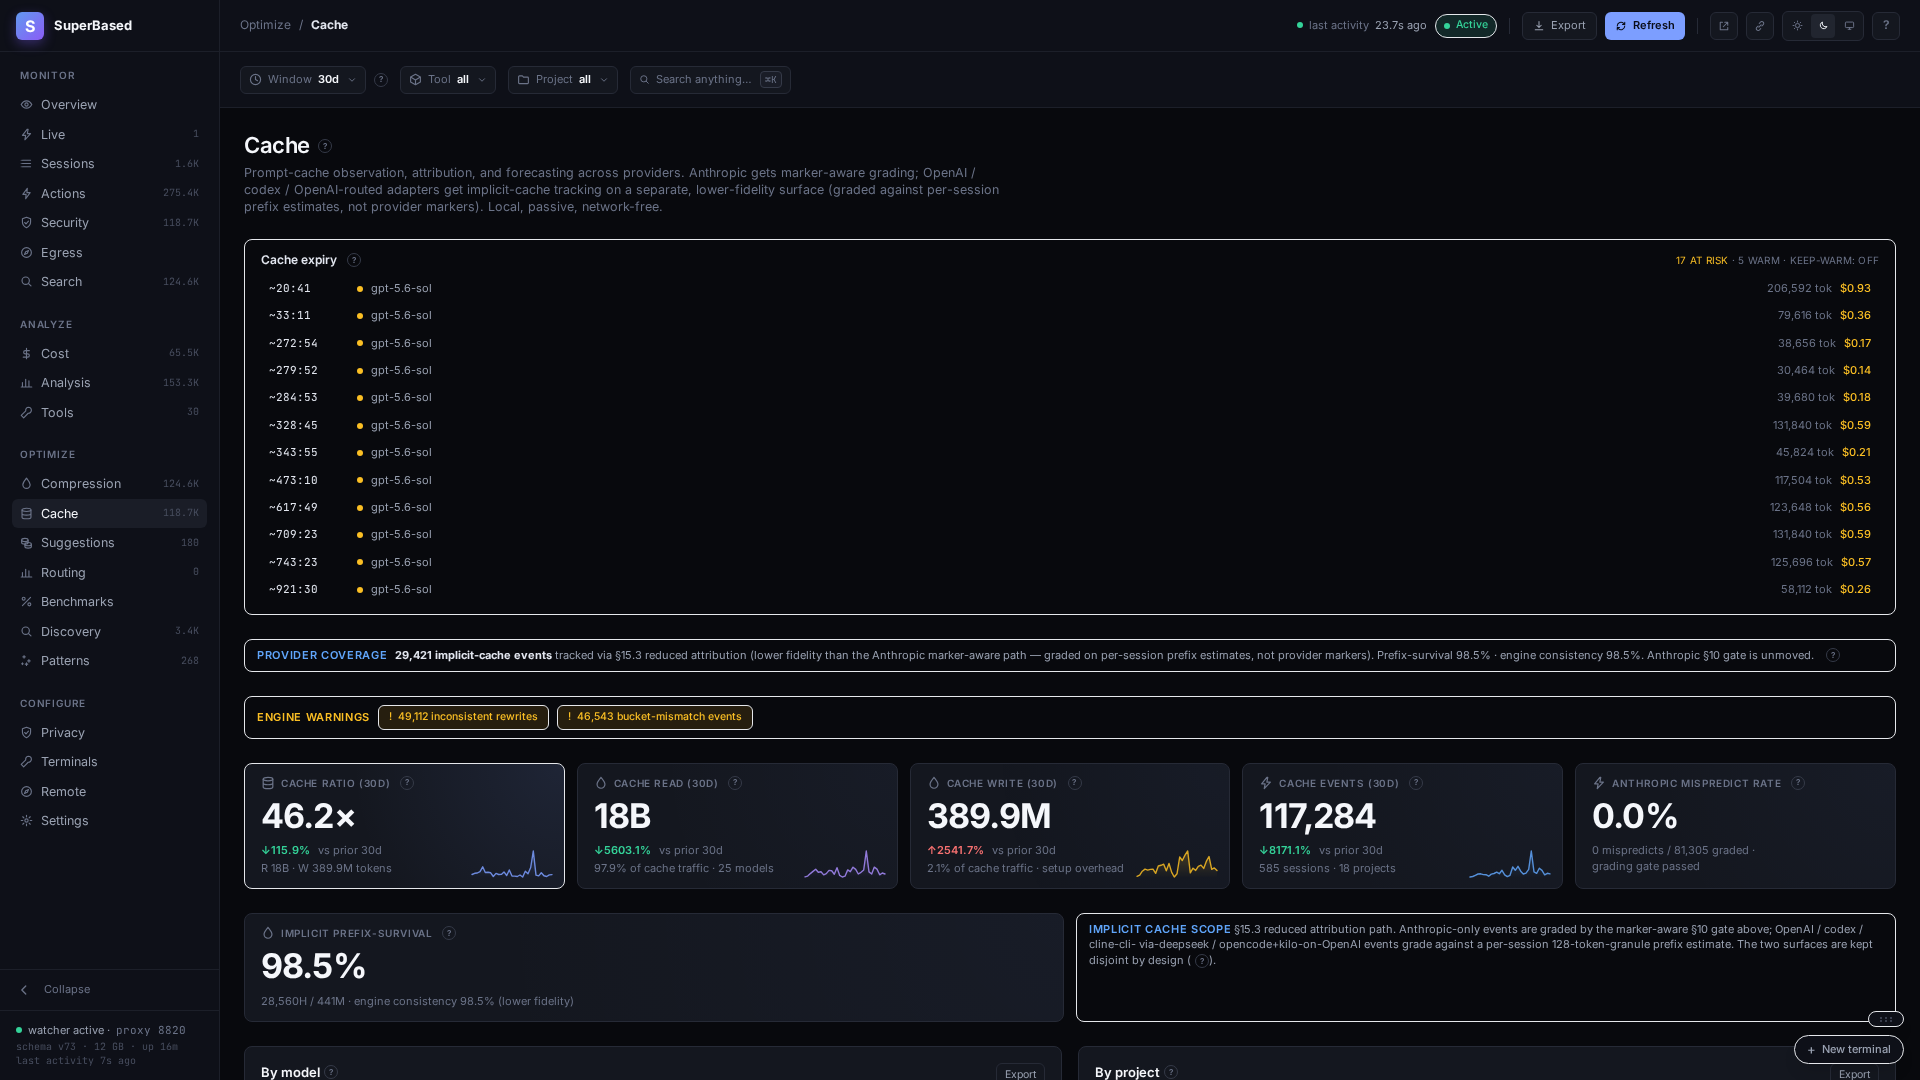
Anthropic prompt-cache observation, attribution, and forecasting — how well your sessions are reusing provider-cached prefixes.
- KPI tiles: Cache ratio (cache_read ÷ cache_write tokens; the headline cache-payback signal), Cache read, Cache write, and Avoidable spend / Event count. The avoidable-spend tile is the dollar overhead of cache rewrites that wouldn't have happened on a perfectly cache-friendly session — it surfaces in warn tone when non-zero.
- By model + By project tables — for each rollup dimension: R%/W% mix bars + absolute Read / Write / Events + cache Ratio + Avoidable $. Identifies the model or repo that's pulling the most overhead.
- Top causes histogram — proportional bar list of
cache_events.causevalues. Healthy baseline issuffix_growth+hitdominating (info-toned warm prefix growth). Real invalidations (system_changed,expiry_rewrite,model_switch_rewrite) render in warn tone. Causes that legitimately fire on real operator toggles — currentlytools_changedon MCP server connect/disconnect — render with a neutral "flagged" pill rather than alarm-red. - Worst sessions table — ranked by rewrite count; click a row to open the session's Cache panel with the full per-turn timeline.
How the cache data gets captured
Two capture paths feed the same engine; both write the same three
local-only tables (cache_segments, cache_entries, cache_events;
migrations 036 + 037 — never pushed to a Teams org server, pinned by
tests/invariant/privacy_test.go::TestSelectUnpushedSinceExcludesCacheTables):
- Tier-1 (proxy) — point your AI client at the local proxy
(
ANTHROPIC_BASE_URL=http://127.0.0.1:8820for Claude Code;OPENAI_BASE_URL=http://127.0.0.1:8820/v1for codex and copilot-cli). The proxy reads the upstream usage envelope (cache_read_input_tokens+cache_creation_input_tokens) and the cachetrack engine attributes each turn live as it streams. Every claude-code prompt-cache event surfaces here in real time. - Tier-2 (transcript watcher) — the watcher tails claude-code
JSONL transcripts and feeds the same engine retroactively for
sessions that didn't route through the proxy. Run
observer backfill --cache-rescanto retrofit pre-cachetrack history.
How to enable / disable
- Default-on. Per spec §11, the loader merges
[cachetrack].enabled = trueif the section is absent. No action needed for a fresh install. - To disable: set
[cachetrack].enabled = falsein~/.observer/config.tomland restartobserver start. - Inspect engine health:
observer cache-health --json— §10 grading gate + read:write consistency + cause-concentration WARNs. - 90-day retention is on by default
(
[cachetrack].retention_days = 90); the maintenance tick prunes stalecache_*rows alongside the existing retention pass.
Operator reference: docs/cache-tracking.md.
Suggestions tab
The advisor — a prescriptive suggestions engine that turns the window's captured activity into ranked, dollar- or minute-quantified recommendations. On by default and entirely local: detectors are pure reads over data the observer already stores, recomputed fresh on every view — zero LLM calls, zero network.
Twenty detectors across four categories:
- cost — session balloons (one session's context growth dominating spend), idle re-cache (cache rewrites after idle gaps), long-context tier crossings, trivial sessions on expensive models, cache hit-rate, cache-write waste, prefix thrash, read-heavy sessions on expensive models, effort overprovisioning, cross-session stale reads, web-search spend, spend spikes ("today is 3× your daily average" — the while-it's-still-happening check, linking to the Live view), routing evidence ready (the advise shadow met its promotion gate with routing still not enforcing — linking to the Shadow card, which owns the evidence and the consent-gated promote).
- latency — fast-tier premium (sessions that paid the 2× fast-tier rate without needing it).
- quality — unrecovered failures, quality regressions.
- hygiene — MCP schema overhead vs. actual MCP calls, compression off while proxied traffic flows, capture running without proxy routing, guard observing idle (recurring high-severity verdicts with zero approvals or tuning — linking to the Security page).
Each card carries the quantified claim ($ or minutes, with a
show math toggle exposing the arithmetic), a confidence score, a
scope chip (window / project / session — session scopes deep-link to
the session detail), and — when a dashboard control can fix the
finding — an action button that navigates to the right surface
(writes only ever happen behind that surface's own consent flow).
snooze 7d quiets a card temporarily; dismiss retires it, with a
7-day cooldown so the same finding doesn't re-nag. The all-clear
state means exactly what it says: nothing worth nagging about in
this window.
Tune it under Settings → Advisor ([advisor] in config.toml):
evidence window (default 14 days), confidence floor (0.5), minimum
claimed savings ($1), and the opt-in session digest — when
session_digest = true, the Claude Code session-start hook injects a
≤400-token digest of the top suggestions into new sessions (off by
default; the hook only reads a pre-computed snapshot, refreshed every
30 minutes). CLI twin: observer advise.
Discovery tab
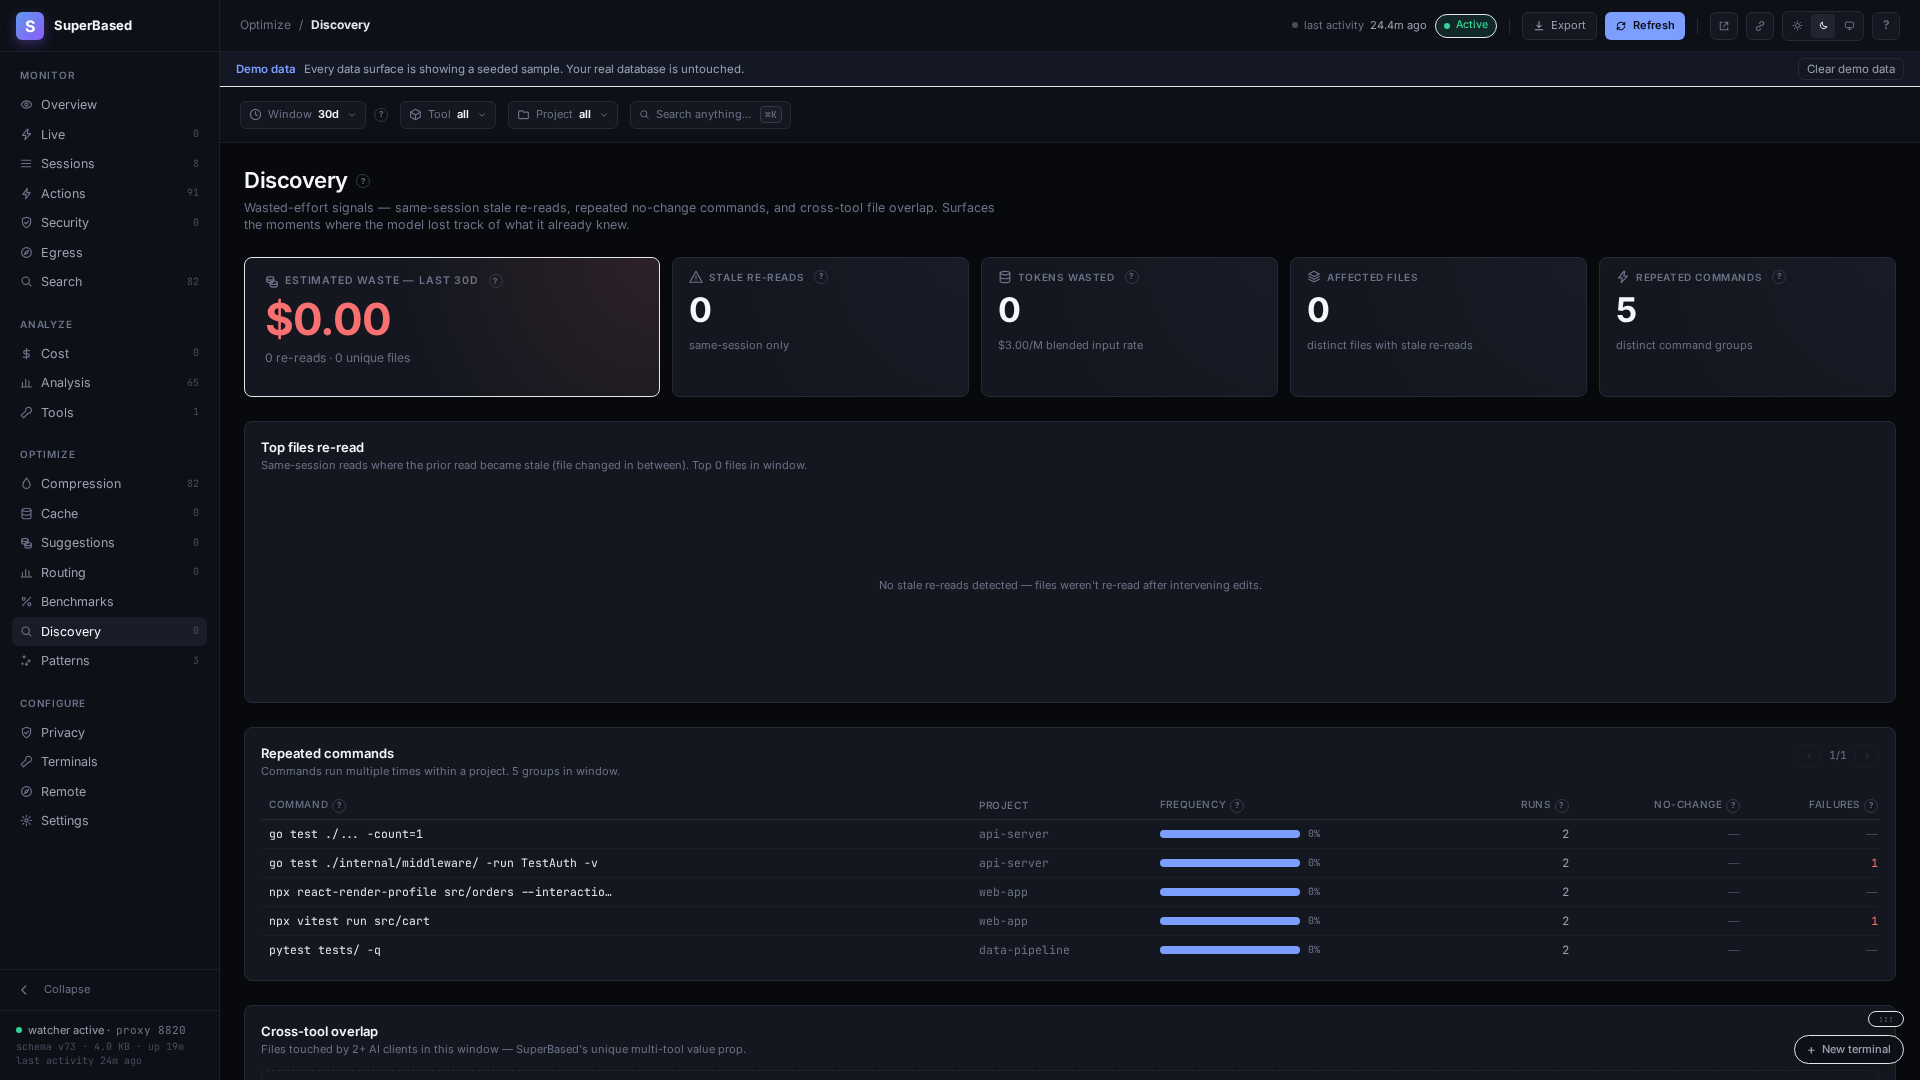
Wasted-effort signals:
- Stale rereads — files re-read after they changed inside the same session. KPI tiles show count, ~Tokens wasted, ~$ wasted (at your blended input rate), affected files. The CROSS-THREAD column flags re-reads that crossed the parent ↔ sub-agent boundary — these are the "pass content via Agent's prompt parameter" candidates.
- Repeated commands — commands run multiple times with no
relevant inputs changed in between (e.g. you ran
go testthree times without editing anything between runs). - Cross-tool overlap — files touched by ≥2 AI clients in the
window (e.g. claude-code AND cursor both edited
auth.ts). This is the visible side of cross-platform tool-call sharing via the MCP server.
Patterns tab
Repeatable behaviours the observer noticed across your sessions —
"after running go test, you almost always run go vet", "when
working on auth.ts, you also touch login.tsx", etc. Each pattern
has a confidence score (decay-weighted: more observations + recent
observations push it higher) and an observation count.
observer patterns derives them; observer suggest writes the
high-confidence ones into CLAUDE.md / AGENTS.md / .cursorrules
so new sessions inherit your habits.
Security tab
The guard layer's operating surface — not just a verdict viewer.
Posture tiles (mode, verdict counts, audit-chain check) over a
filterable verdict timeline (rule / severity / decision / session,
with rule IDs resolved to their full definitions), then the routine
workflows end to end: a consent-gated mode control that shows the
simulate evidence before you flip enforce, the enforce-readiness
card (a replay of your real history under the enforce projection,
with per-rule blocking concentration), the approvals register
(scoped, expiring exceptions — DB writes, live immediately), a
lint-gated policy editor for your user rules (malformed files are
refused with the problems listed; .bak undo), budget guardrails
suggested from your own observed spend with a daily burn-down meter,
MCP pin approvals, and one-click compliance evidence downloads
(report / JSONL / CEF / audit verification).
Routing tab
Model routing's transparency + adoption surface. While routing is off, a Preview savings card replays your last 30 days under any policy template — read-only, nothing enabled. Once advise mode runs, the page shows the decisions feed (every decision expandable to its matched rule, reason codes, and cache economics), savings with CI95 error bars, the expanded policy rule table (never a black box, demoted rules marked), the tier map with calibration overlays, the model health board, and the advise-shadow readiness ladder with its consent-gated promote control. The Apply to tools card turns observed sub-agent evidence into per-tool native config — dry-run preview, one consent per file write, backups + per-file revert, and an append-only audit ledger of everything observer changed.
Settings tab
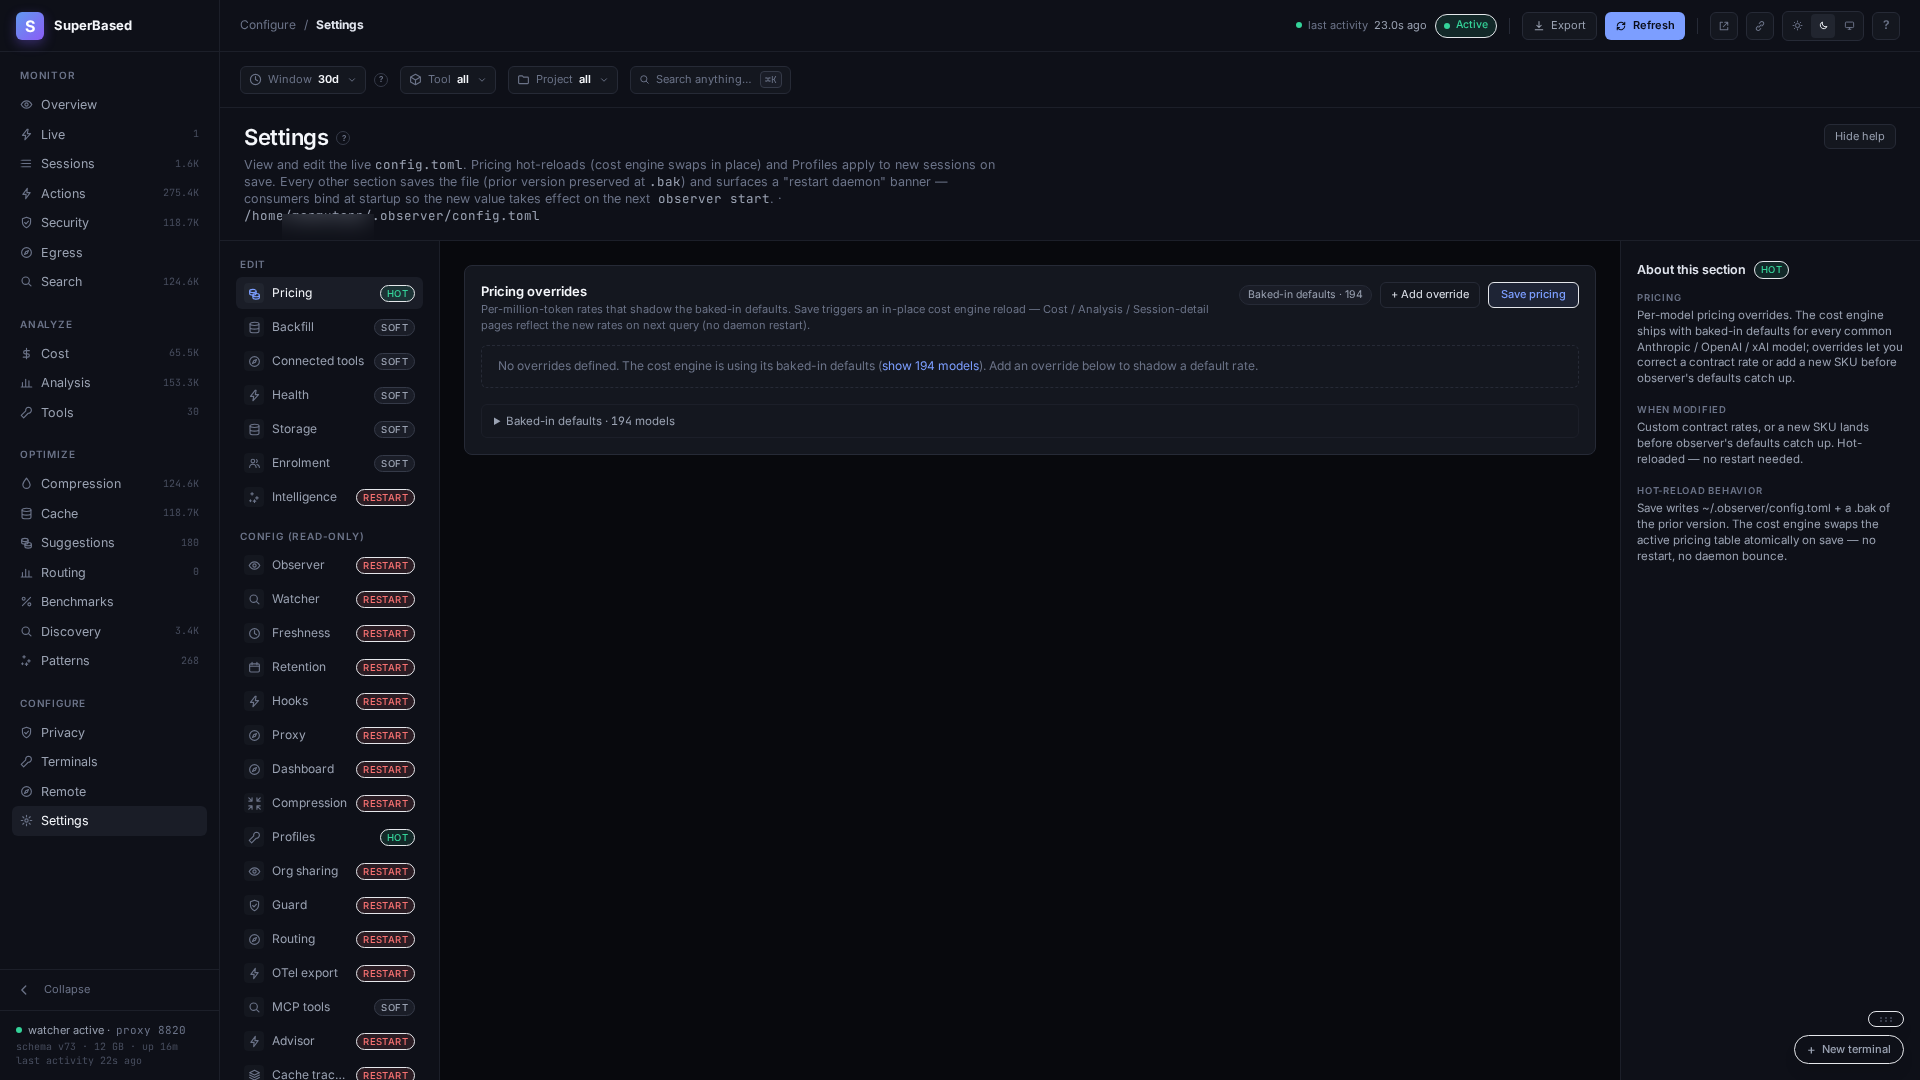
Fully editable visual editor for everything in config.toml, plus
the operational panels a config file can't express:
- Config sections — schema-driven forms for Watcher, Freshness, Retention, Hooks, Proxy, Compression, Intelligence, Advisor, Cache tracking, Secrets scrubbing, MCP, Profiles, Org share, and OTel. Each section is honest about reload semantics: pricing and profile changes apply hot, MCP settings apply to the next AI session, and restart-gated sections raise a persistent restart-pending banner that names the exact command and clears itself only when the daemon actually restarts.
- Connected tools — one row per detected AI client (detected / capturing / hooks / MCP / proxied), a per-tool setup wizard that previews every config write and applies each one only on its own consent click, and a Launch button (with a copy-paste fallback) for opening a routed session.
- Health — the full
observer doctorcheck set with remediation hints, plus recent command failures (recovered vs not). - Backfill — every
observer backfillmode as a click-to-run job with live streamed output, plus a full-rescan card with an adapter picker. - Storage — what's actually taking the space: per-table database
size breakdown (index and FTS5 shadow-table bytes folded into the
table they serve), vacuum and online backup as click-to-run jobs,
and the documented restore procedure (restore is deliberately
manual: stop the daemon, swap the file, start). CLI twin:
observer db stats|vacuum|backup. - Config file card — view the active file; one-click restore of
the automatic
.baktaken before every save.
Help drawer
Press ? anywhere on the dashboard or click the ? Help button in
the topbar. Every column header, KPI tile, chart label, and filter
control on every tab is annotated — hover any element to see a
one-liner tooltip; click to open the drawer at the matching glossary
entry.
The drawer has full descriptions, formulas, data sources, examples,
"why it matters", "what to do", and cross-links. Search at the top.
Deep-linkable via URL fragment — #help/metric.stale_count opens
the drawer at that entry.
Each compression mechanism (json / code / logs / text / diff / html / drop) has a "Full methodology · see more" expandable section explaining the actual algorithm.
MCP tools reference
Once you've run observer init (it's opt-in — observer start
alone does NOT register the MCP server), every connected AI client
gets these 13 tools registered as an MCP server — plus
retrieve_stashed when the proxy stash is configured. They're
read-only queries against the unified database, so any agent
can read any other agent's recorded work — true cross-platform
tool-call sharing.
| Tool | Purpose |
|---|---|
check_file_freshness |
Has this file been read in the current session? Has it changed since? |
get_file_history |
Full read/edit history of a file across all sessions and clients |
get_session_summary |
Roll-up stats for a session: action count, success rate, cost, token buckets |
search_past_outputs |
Full-text search across recorded tool outputs (FTS5-indexed) |
get_last_test_result |
Most recent go test / npm test / pytest etc. output |
get_failure_context |
Recent failures: which command, which file, which session |
get_action_details |
One specific action's full record (target, args, output excerpt) |
check_command_freshness |
Has this command been run in the current session? With what result? |
get_session_recovery_context |
Recent activity for resuming a paused session |
get_project_patterns |
High-confidence patterns derived from this project's history |
get_cost_summary |
Daily / per-model / per-session cost rollups |
get_redundancy_report |
Stale rereads, repeated commands, cross-tool overlap for the project |
list_actions_around |
±N actions adjacent to a pivot action_id — browse a session's local timeline cheaply |
retrieve_stashed (conditional) |
Pulls original bytes of a tool_result the proxy compressed away. Only registered when [compression.conversation].stash is configured. |
Cost trade-off: with the MCP registered, the AI client sends the
full tool-schema payload (~7.2 KB / ~1,800 tokens) in its system
context on every turn — whether or not the model actually invokes
any tool. To eliminate this overhead, run observer init --skip-mcp
(registers hooks only) or skip init entirely.
Cross-tool sharing: when observer init registers the MCP server
with Claude Code AND Cursor (and Codex…), all of them call the same
tools against the same database. Cursor's get_last_test_result
returns Claude Code's last test run; Codex's check_file_freshness
reflects edits made by Cursor.
Compression mechanisms
The conversation-compression pipeline runs inside the proxy on every
upstream request. It tries to fit the request body within
target_ratio × original_bytes (default 0.85) without breaking the
conversation's referential integrity.
Two passes, in order:
Pass 1 — per-content-type compression
Each tool_result block is sniffed for content type, then routed to
a content-aware compressor. Six compressors:
| Mechanism | What it does | When it fires |
|---|---|---|
| json | Replaces every scalar value with a type sentinel ("<string>", "<number>", …) preserving structure (keys, arrays, nesting). Arrays of length > 1 collapse to one element with _len: N. |
API responses, structured logs, telemetry exports. JSON tool_results are usually the biggest savings target. |
| code | Heuristic skeleton: keeps top-of-file imports + signature lines (function / method / class / struct / interface / type), drops bodies. | Source code files. On by default as of v1.7.23 in the claude-code profile (V7-24 empirical winner). |
| logs | Two-pass: collapses adjacent identical lines to <line> [×N], then head+tail-truncates to 200 lines if still long. |
Log-shaped output — go test ./..., npm run build, polling/retry loops. Lossless on distinct lines; only the truncate pass is lossy. |
| text | Catch-all for content not classified as code/json/logs/diff/html. Head+tail truncation: keeps 40 + 40 lines on inputs over 80 lines. | Markdown bodies, README excerpts, narrative descriptions. |
| diff | Strips unified-diff context beyond ±1 line of each change. Keeps every header, every +/- line, drops the rest with elision markers. |
git diff, patch tool outputs. Lossless on changes; lossy only on the cheap-to-rebuild context. |
| html | Three regex passes: strips <script>, <style>, and HTML comments. Tag attributes + visible text + structural elements survive. |
web_fetch results pulling whole HTML pages — usually 80%+ scripts/styles. |
Pass 2 — drop with marker
If Pass 1's compressed body is still over budget, the budget enforcer ranks remaining messages by importance score (a deterministic weighted sum) and drops the lowest-scored non-preserved ones until the budget is met. Each dropped message is replaced by a single marker block (a placeholder text) so the conversation flow stays intact for the model.
Importance score = 0.4 × recency + 0.3 × reference + 0.15 × density + 0.15 × role
- Recency =
(i+1) / n— newest message scores 1.0, oldest scores 1/n - Reference =
1.0if any of the message'stool_use_idsis cited by a latertool_result, OR any of itsreferenced_idspoints to a live tool_use;0.0otherwise. Tool-pair-live messages always get full weight regardless of position. - Density = fraction of non-whitespace runes (whitespace-padded outputs get dropped first)
- Role =
system 1.0,user 0.9,assistant 0.7,tool 0.5(tool outputs are the most-compressible by policy)
Preserved messages (never droppable):
- The last
PreserveLastNmessages (default 4) - Any
systemrole message - Tool-pair-live messages: any message whose
tool_use_idis referenced by a later tool_result (parent side), AND anytool_resultmessage whosereferenced_idpoints to a live tool_use (consumer side)
Tool-pair preservation is symmetric — dropping either side leaves an orphan that Anthropic rejects with 400.
Per-event detail
Every drop and every per-type compression is recorded as a row in
the compression_events table (post migration 010). The Compression
tab's "Recent compression events" view surfaces these with
mechanism, original / compressed / saved bytes, message slot, and
importance score (for drops).
Tuning — profiles pick the parameters for you
Compression parameters are supplied by profiles: named parameter
sets resolved per traffic class at the proxy boundary. The moment you
enable compression, Anthropic-path traffic gets the claude-code
profile and OpenAI-path traffic gets codex-safe — each tool gets
its tuned parameters simultaneously; there is no recipe-picking step.
Inspect with observer profile list / observer profile show <name>; reassign per class or per tool (observer profile assign openai codex-variant, observer profile assign tool:kilo-code-cli codex-safe); build your own (observer profile create mine --from claude-code, or Settings → Profiles in the dashboard). Per-tool
assignment needs the proxy to identify the connecting tool: hook-fed
identity (Claude Code) is exact, and Codex, Kilo CLI, opencode, and
Claude Code are also recognized by their request headers; clients
that send no distinctive headers (e.g. Cline CLI) fall back to the
per-provider profile. Profile
edits apply to new sessions without a daemon restart. A repo can
also carry <root>/.observer/config.toml with [profiles] /
[compression] keys to override per project — project files can turn
compression off for their traffic, never on.
The master config (~/.observer/config.toml) keeps the one on/off
switch and the fallback parameters used by the default profile:
[compression.conversation]
enabled = true             # THE switch — profiles never flip this
mode = "cache_aware"       # "token" | "cache" | "cache_aware" — default cache_aware; see matrix below
target_ratio = 0.85
preserve_last_n = 5        # never drop the most recent N messages
compress_types = ["json", "logs", "code"]   # default; add "text", "diff", "html" to opt in
High importance scores on dropped events (≥0.5) suggest the threshold
is too aggressive — raise target_ratio (e.g. 0.9 or 0.95).
Choosing a mode: Anthropic vs Codex
Per-type tool_result compression runs in every mode; mode only changes how
messages are dropped and whether an Anthropic cache_control marker is injected.
mode |
What it does | Claude Code (Anthropic) | Codex / OpenAI |
|---|---|---|---|
token |
Per-type compress, then drop lowest-scored messages to hit target_ratio. |
✅ Works. | ✅ Clearest choice for Codex/OpenAI. |
cache |
Restrict drops to the tail half + inject a cache_control marker at the prefix boundary. |
✅ Anthropic-specific. | ⚠️ No effect beyond token. |
cache_aware (default) |
Skip drops, narrow compression to tool_result blocks, no marker; keep history byte-stable across turns so Anthropic's prefix cache keeps hitting. |
✅ Recommended for Anthropic Pro/Max — and the shipped default. | ⚠️ No effect beyond token. |
The shipped default is cache_aware (token is just the internal fallback when
mode is empty). The cache modes exist for Anthropic's content-hash prefix
cache (cache_control is an Anthropic Messages API concept). OpenAI/Codex
prompt caching is automatic and server-side — nothing to mark or tune, so
the proxy's OpenAI path is mode-agnostic (the default cache_aware behaves like
token there). So: keep cache_aware for Claude Code; mode = "token" reads
honestly for a Codex/OpenAI-only setup.
Beyond the keys above, three opt-in sub-features have their own tables —
[compression.conversation.stash] (Compressed-Content Retrieval),
[compression.conversation.rolling] (rolling summarisation, with a per-provider
summary model: summary_model for Anthropic, openai_summary_model for
OpenAI/Codex), and [compression.conversation.compaction]. The full knob
reference lives in docs/compression-modes.md.
Measured savings (v1.7.23)
We A/B every shipped profile against an OFF baseline on a real refactor
workload (lumen TypeScript codebase, 408-line Zustand store →
4 domain sub-stores) on the v1.7.22 binary tip. The numbers below are
the most recent statistically-meaningful measurements.
The first two profiles are what the per-provider auto-assignment
applies (Anthropic → claude-code, OpenAI → codex-safe);
codex-variant is the manual pick for -codex-family models:
| Profile | Use when your model is… | Workload | n | Δ vs OFF (mean cost) | What's compressed |
|---|---|---|---|---|---|
claude-code (default) |
Any Anthropic Claude model — claude-sonnet-4-6, claude-opus-4-7, claude-haiku-4-5, … |
Refactor, Claude Sonnet 4.6 via Claude Code 2.1.158 | n=8 B vs n=4 OFF | −6.9% (CV 7.6%; tighter than OFF's 7.5%) | json + logs + code bodies + tool-defs trim (A2-adopted 2026-06-11: −12.5% vs the pre-A2 set, zero tools_changed cache events); cache-aware; stash disabled |
codex-variant |
OpenAI's -codex reasoning fork — gpt-5.3-codex, gpt-5.4-codex, gpt-5-codex-agent, anything matching *-codex* |
Refactor, gpt-5.3-codex | n=10 B vs n=10 OFF | −10% ($0.270 vs $0.300) | Tools-defs trim; cache-aware; no per-type compression |
codex-safe |
Plain OpenAI GPT under the codex CLI — gpt-5.4, gpt-5.4-mini, gpt-5.5, gpt-4o, any non--codex |
Refactor, gpt-5.4 + apply_patch |
n=3 B vs n=4 OFF | not statistically distinguishable on this workload | logs + tools-defs trim (A6-adopted 2026-06-11: fired on 117/117 candidate requests, ~0.8KB/request of definition prose, task-completion parity + no cache degradation at n=9 vs n=7; effect scales with envelope bulk — MCP-registered installs save more); token mode |
The word "variant" in codex-variant refers to the model variant (the -codex reasoning fork of GPT), NOT a variant of the codex CLI. Both codex profiles are for the codex CLI; they differ only in which model family they assume. codex-safe is so named because plain GPT models tolerate logs trimming safely — it's not "safer than codex-variant."
Honest caveats:
- Workload-dependent. The
codex-saferow on gpt-5.4 was inconclusive because the test workload usedapply_patch(classified ascode, notlogs) socompress_types=["logs"]never fired — the proxy was a functional no-op and the cost variance was session noise. A Bash-heavy workload would tell a different story. claude-coderequiresENABLE_TOOL_SEARCH=truein your shell. Without it, Claude Code's SDK disables ToolSearch underANTHROPIC_BASE_URLand eager-inlines all MCP schemas (~+21K tokens per turn). The proxy then becomes a net loss instead of the −6.9% above. Setup steps cover this; verify withprintenv ENABLE_TOOL_SEARCH.stashstays disabled by default for Anthropic (V7-25 finding: +25% cost on n=1 due to prefix-cache miss; stash markers break Anthropic's content-hash cache). Operators can opt in for a measured workload but should A/B their own.- Historic claims of higher savings are retracted. The v1.4.38 release notes cited −14.8%; the project itself walked that back after a deeper repro showed it was within noise. The numbers above are the post-retraction floor.
Reproduce it yourself:
# Full methodology, raw arm data, per-arm cost rows, and a reproducer
# script live in this repo:
docs/v1.7.23-compression-savings-empirical-2026-06-01.md
Cost and token math
Anthropic's usage envelope reports four token buckets per request, each at a different rate:
| Bucket | What it is | Bills at |
|---|---|---|
net_input |
Fresh prompt tokens not served from cache | model's standard input rate |
cache_read |
Prompt tokens served from Anthropic's ephemeral cache | ~10% of input rate |
cache_creation |
Tokens written to ephemeral cache | 1.25× input (5m tier) or 2× input (1h tier) |
output |
What the model generated | typically 5× input rate |
prompt_context = net_input + cache_read + cache_creation
total_tokens = prompt_context + output
The cost engine (internal/intelligence/cost) computes USD via:
cost_usd = (net_input × p.input + cache_read × p.cache_read +
            cache_creation_5m × p.cache_creation +
            cache_creation_1h × p.cache_creation_1h +
            output × p.output) ÷ 1,000,000
When the upstream API returns cost_usd in the response envelope
(proxy-sourced rows), that value is preferred over the computed one —
ground truth, reliability=high.
Blended input rate
The Discovery tab's "~$ wasted" tile uses a blended input rate
computed from your last-30d api_turns mix: each model's input rate
weighted by the prompt-token volume it consumed. Example: if you
spent 70% of prompt tokens on opus-4-7 ($15/1M) and 30% on
haiku-4-5 ($1/1M), the blended rate is 0.7 × 15 + 0.3 × 1 = $10.80/1M.
Falls back to $3/1M (claude-sonnet-4 input) on fresh installs with no proxy data.
JSONL dedup
When the proxy isn't engaged, observer falls back to parsing the AI client's on-disk session log. Clients echo the same cumulative usage on every content block of a multi-block response, so naive parsing counts one API call 2-4×. Two layers of dedup catch this:
- Adapter-level: dedupes on Anthropic
message.idat write time - Cost-engine-level: dedupes on
(source_file, model, timestamp-bucketed-to-minute, tokens)at read time
Migration 007 ran a one-time pass collapsing pre-fix duplicates.
Security & control layer (guard)
The guard evaluates every captured agent action against a table-driven policy — built-in rules (destructive commands, project boundaries, secrets egress, MCP pinning, taint/dataflow, budgets) plus your own TOML rules — records each verdict in a hash-chained, tamper-evident audit table, and on the channels that support it can block before execution. It ships observe-only by default: a fresh install records and alerts, and never blocks anything until you explicitly flip enforce.
What makes it different from standalone command-guards:
- One policy, every tool. The same rules evaluate Claude Code,
Codex, Cursor, Cline and the rest through one engine — and
observer init --guardadditionally compiles the policy into each client's own native permission dialect, so the client itself enforces even when the observer daemon is down. - Replay before you enforce.
observer guard simulate --since 168hreplays your real captured history against current policy and shows what last week WOULD have flagged or blocked — a confidence check only a tool that already has your history can run. - Proxy-level secrets egress scanning. Clients routed through the observer proxy get outbound API bodies scanned for credentials, with mask/deny enforcement — an egress point no other local-first tool sits on.
- Auditable, honestly. Verdicts are hash-chained
(tamper-EVIDENT, not tamper-proof — the docs say exactly what that
means), exportable as JSONL/CEF for your SIEM, and summarized by
observer guard reportinto a compliance evidence pack mapped to SOC 2 / NIST 800-53. - Operable from the dashboard, not just the CLI. The Security
page runs the routine workflows end to end: a consent-gated mode
control that shows the simulate evidence before you flip enforce,
an Enforce-readiness replay over your real history, the approvals
register (scoped, expiring exceptions — live immediately), a
lint-gated policy editor for your user rules (malformed files are
refused before they touch disk, with
.bakundo), budget guardrails suggested from your own observed spend (p95 + headroom) with a daily burn-down meter, MCP pin approvals, and one-click compliance evidence downloads.
Honest scope: hooks see declared commands, not side effects (use OS sandboxes for containment — the guard detects and recommends them); most adapters are watcher-channel and can only flag post-hoc; the proxy scan only covers proxy-routed clients. The full capability matrix is on the dashboard's Security page, and the no-network invariant holds — nothing leaves your machine unless you opt into Teams push, OTel export, or the cloud alerting tier, each individually.
Quick start:
observer guard status                  # mode, rules, recent verdicts, chain check
observer guard test "rm -rf ./build"  # would this block?
observer guard simulate --since 168h  # what would last week have flagged?
observer guard enable --enforce       # flip to enforce when ready
Full references: guard.md (operator guide + getting started), guard-rules.md (rule catalog), guard-policy-authoring.md (writing rules + cookbook), guard-enforce-runbook.md (the observe→enforce migration), guard-compliance.md (SOC 2 / NIST mapping).
Model routing
The routing layer selects the right model for each KIND of work —
from your own observed evidence, never a brochure — through two
channels: A writes each AI tool's own config (claude-code
per-subagent model: frontmatter — dry-run first, backed up,
revertable, audit-ledgered; other tools get exact paste-able
snippets), and B rewrites the model field on requests already
transiting the proxy. It is opt-in, advise-first, and fail-open
everywhere: a routing failure can never break a turn that would
have succeeded.
The adoption ladder is deliberate, and every step has a dashboard
surface: preview what a policy would have saved over your last 30
days while routing is still off (a read-only replay of recorded
turns) → enable advise (decision rows accrue; requests untouched)
→ read the shadow (the §R22 readiness ladder: enough decisions,
real net savings after cache forfeits, zero quality flags) →
promote to enforce through a consent dialog that restates the
evidence — and warns loudly when the gate is not met. Enforce
rewrites within the same provider shape only, holds switches that
would forfeit a warm prompt cache worth more than they save, and
auto-demotes any rule whose downshifts grade as regressing
(loudly, never silently). Custom [[routing.rules]] are editable in
a lint-gated dashboard editor with a worked recipe gallery in the
docs.
Privacy posture: decision rows and calibration are node-local (never pushed to an org server); org-distributed policy fragments are signed and structurally cannot flip your enforce switch — no remote enforce toggle exists, by design.
Quick start:
# Preview before enabling anything (CLI twin of the dashboard card):
observer routing simulate --policy value --days 30
# Then: dashboard → Routing → Preview savings → Enable advise mode.
observer routing shadow    # the promotion evidence, any time
observer routing apply --tool claude-code   # Channel A, dry-run default
Full reference: model-routing.md (operator guide + the first-30-days runbook + the rules recipe gallery).
Terminology and glossary
Quick reference; the in-platform help drawer (press ? on the
dashboard) has the full versions with cross-links.
- Action — one normalized tool call recorded by an adapter. Action
types are taxonomic and cross-client:
read_file,write_file,edit_file,run_command,search_text,search_files,web_search,web_fetch,mcp_call,spawn_subagent,todo_update,ask_user,task_complete,user_prompt,api_error,turn_aborted(interrupted before completion — distinct from task_complete/success=false; v1.4.22+),context_compacted(upstream-emitted compaction marker, not searchable like file edits; v1.4.22+),system_prompt(system/developer/user-envelope content; v1.4.23+),unknown. - API turn — one HTTP request captured by the local proxy. Records
one row in
api_turnsper request, with the upstream usage envelope intact. - Cache 5m vs 1h tier — Anthropic's prompt cache has two TTLs.
Default is 5 minutes;
cache_control: {type: ephemeral, ttl: 3600}extends to 1 hour at 2× the write cost. Reads bill the same rate regardless of tier. - Compression event — one individual compression decision (one per-type compress, or one drop) recorded post migration 010.
- Conversation compression — pre-forward trimming of API request bodies. Pass 1 = per-content-type compression, Pass 2 = drop with marker. See Compression mechanisms.
- Cross-platform tool calling — every AI client connected via
observer initcan call the 12 MCP tools against the unified database. So Cursor'sget_last_test_resultcan return ago testClaude Code ran an hour earlier. - Cross-thread reread — the parent thread re-reads a file the
sub-agent already saw (or vice versa) within the same session. Fix:
pass content via the Agent tool's
promptparameter rather than letting the child re-read. - Freshness state — per-read tag from the freshness engine:
fresh(first read in this session, OR re-read with same content),stale(re-read after change in same session),missing(file no longer exists),modified-elsewhere(file changed by something other than an observable AI action). - Mechanism — one of
json,code,logs,text,diff,html(per-content-type compressor) ordrop(low-importance message replaced by a marker). - Pattern — a derived behaviour:
command_pair(X often followed by Y),cross_tool_file(file touched by multiple clients),knowledge_snippet(consistent topic-specific habit),failure_correlation(X often precedes a failure of Y),session_summary. Each has a decay-weighted confidence score 0-1. - Project — working-directory root that owns sessions and
actions. Derived from cwd at session start;
/.git/worktrees/...paths fold back to the working-tree root. - Proxy vs JSONL — proxy intercepts upstream HTTP calls (ground truth, reliability=high). JSONL parses the AI client's on-disk session log (works without configuring a base URL, but client echoes cumulative usage on every block, requiring dedup — reliability=unreliable for token counts on Claude Code).
- Reliability — cost-engine confidence:
high(upstream- reported),medium(computed from known pricing),low(some buckets estimated),unreliable(no pricing entry). - Session — one continuous AI-coding conversation in a single tool, scoped to one working directory. Has a stable ID (Claude Code's UUID, Codex's rollout ID, …).
- Sidechain — actions emitted inside a sub-agent runtime spawned
via the parent's
Agenttool. Sub-agents share the parent's session_id; theis_sidechaincolumn distinguishes them. The Discovery tab's CROSS-THREAD column counts stale rereads that crossed this boundary. - Stale reread — same-session re-read of a file whose content changed between reads. Cross-session reads are excluded (a fresh session has no memory of a prior session's read).
- Tool — in this dashboard, "tool" means the AI client
(claude-code, cursor, codex, cline, cline-cli, copilot, copilot-cli,
opencode, openclaw, pi, antigravity, gemini-cli, hermes, kilo-code,
kilo-code-cli), not the per-tool name (
read_file,run_command). The latter is "Tool name" on the Actions tab. - Tool-pair integrity — Anthropic requires every
tool_resultblock to have a correspondingtool_useblock in a preceding message. The compression pipeline preserves both sides of every live pair to satisfy this constraint.
CLI reference
Every command supports --help for the full surface.
| Subcommand | Purpose |
|---|---|
observer init |
Register hooks + MCP server + durable proxy routes with installed AI clients (each side defaults on; opt out with --skip-hooks / --skip-mcp / --skip-proxy-route). With zero flags on a terminal it runs an interactive checklist instead: detects your tools, previews each pending config write, and asks consent one write at a time (MCP never pre-selected). Any flag or redirected stdio keeps the batch behaviour. |
observer uninstall |
Reverse observer init |
observer start |
Run watcher + dashboard + proxy in one process (recommended). Auto-opens the dashboard on interactive launches. Flags: --dashboard-addr ADDR (default 127.0.0.1:8081), --no-dashboard to skip the HTTP UI, --no-open to skip the browser. |
observer claude [-- args…] |
Launch Claude Code routed through the proxy for that session only (no config writes; fresh Pro/Max OAuth token re-exported so the SDK can't bypass). --verify runs pre-flight checks without launching. |
observer codex [-- args…] |
Launch Codex routed through the proxy for that session only (injects openai_base_url via argv; no config writes). |
observer watch |
Long-running JSONL watcher only |
observer dashboard --addr ADDR |
HTTP dashboard only |
observer proxy start |
Reverse proxy only |
observer scan |
One-shot ingest of existing JSONL files (catch-up after install) |
observer status |
DB stats + recent activity |
observer doctor |
Diagnostic — checks paths, schemas, hook registration |
observer tail |
Live tail of incoming events |
observer cost |
Per-model cost summary CLI |
observer score |
Compute quality_score / error_rate / redundancy_ratio for sessions |
observer discover |
Stale rereads + repeated commands report (CLI version of the Discovery tab) |
observer patterns |
Derive patterns from session history |
observer learn |
Adapter for ingesting external JSONL exports |
observer suggest |
Write high-confidence patterns into CLAUDE.md / AGENTS.md / .cursorrules |
observer summarize |
Roll-up summary across sessions |
observer export |
Export DB to xlsx / json |
observer prune |
Manual retention pass (delete old data) |
observer db stats|vacuum|backup |
Storage manager. stats: per-table size breakdown (index + FTS5 shadow bytes folded into the table they serve). vacuum: reclaim free pages, reports bytes freed (can report SQLITE_BUSY against a busy daemon — re-run in a quiet moment). backup <path>: online snapshot via SQLite VACUUM INTO — safe while the daemon runs, refuses to overwrite. Restore is manual by design: stop daemon, swap file, start. |
observer db import <path> |
Merge another observer.db into this node's (a stranded install from another OS or home directory). Set-based, single-transaction, idempotent — re-running adds nothing twice; project identities remap by root path. --dry-run executes the same transaction and rolls it back, so its per-table counts are exact. Migrates the source schema first — point it at a copy. Node-local state (cache tracking, watcher cursors, advisor state) doesn't transfer. |
observer backfill --is-sidechain |
Re-walk JSONL to populate actions.is_sidechain (added by migration 010) on pre-migration rows. |
observer backfill --cache-tier |
Re-walk JSONL to populate cache_creation_1h_tokens (added by migration 008) on pre-migration rows. Run once after upgrading to v1.4.16+ to correct historical 1h-tier cache writes that were silently billed at the cheaper 5m rate. |
observer backfill --message-id |
Re-walk JSONL to populate message_id on actions and token_usage (added by migration 012). Required by the per-message timeline view in the Sessions modal. |
observer backfill --all |
Run every supported backfill in one invocation. Idempotent — safe to re-run. |
observer profile list|show|assign|create|delete|set |
Compression profiles: inspect built-ins, reassign per traffic class or per tool (assign tool:cline codex-safe), create/edit custom profiles. Edits apply to new sessions hot. |
observer config set <key> <value> |
Dotted-key config setter (compression.conversation.enabled true). --project <root> writes a per-repo override file instead. |
observer advise |
Prescriptive cost/quality suggestions from captured activity (the Suggestions tab, in the CLI) |
observer cache-health |
Prompt-cache engine health: grading gate, read:write consistency, cause concentration |
observer metrics |
Prometheus-format metrics endpoint |
observer serve |
MCP server (stdio JSON-RPC) — usually invoked by observer init registration |
observer completion <shell> |
Generate shell completions (bash / zsh / fish / powershell) — e.g. observer completion zsh > "${fpath[1]}/_observer" |
Configuration
~/.observer/config.toml — created with defaults on first run.
[paths]
db_path = "~/.observer/observer.db"
log_dir = "~/.observer/logs"

[proxy]
listen_addr = "127.0.0.1"
port = 8820
anthropic_upstream = "https://api.anthropic.com"
openai_upstream = "https://api.openai.com"

[dashboard]
listen_addr = "127.0.0.1"
port = 8081

[compression.conversation]
enabled = false            # opt-in; default off
mode = "cache_aware"       # default; "token" | "cache" | "cache_aware" (see "Choosing a mode")
target_ratio = 0.85
preserve_last_n = 5
compress_types = ["json", "logs", "code"]   # default; add "text"/"diff"/"html" to opt in

[compression.shell]
enabled = true
# per-command filters configured under [compression.shell.filters]

[retention]
prune_on_startup = true
max_actions = 5_000_000
max_age_days = 365

[pricing]
# Per-model overrides if the baked-in pricing is wrong for you.
# [pricing.models."claude-opus-4-7"]
# input = 15
# output = 75
# cache_read = 1.5
# cache_creation = 18.75
Troubleshooting
pip install fails with error: externally-managed-environment
Modern Linux distros (Debian 12+, Ubuntu 24.04+, Fedora 38+) mark the system Python as PEP 668 "externally managed" — installing into it would conflict with the OS package manager. Three fixes, pick one:
# 1) RECOMMENDED — uv tool install (isolated env, fastest)
curl -LsSf https://astral.sh/uv/install.sh | sh
uv tool install superbased-observer

# 2) pipx (same isolation, pre-PEP-668 idiomatic)
pipx install superbased-observer

# 3) Plain pip into your user site
pip install --user superbased-observer
# Make sure ~/.local/bin is on $PATH:
echo $PATH | tr ':' '\n' | grep -F "$(python3 -m site --user-base)/bin"
uv tool and pipx create a dedicated virtualenv per tool so the
install never collides with another project. Recommended unless you
have a reason to share the global env.
observer: command not found after install
The console-script entry point is wherever your installer dropped it:
| Installer | Location |
|---|---|
pip install --user |
$(python3 -m site --user-base)/bin/observer (often ~/.local/bin/observer) |
pipx install |
~/.local/bin/observer (symlink to the pipx-managed venv) |
uv tool install |
~/.local/share/uv/tools/superbased-observer/bin/observer (with ~/.local/bin/observer shim) |
Plain pip install in a venv |
<venv>/bin/observer |
Make sure the matching directory is on $PATH. If you see a
"command not found" error, run pip show -f superbased-observer | grep observer
to find the exact path.
observer init says "no tools selected and none auto-detected"
Auto-detection looks for the AI clients' default session-log dirs
(~/.claude/projects/, ~/.codex/sessions/, ~/.cursor/, etc.).
On a fresh machine where no client has run yet, those dirs don't
exist. Pass the flag explicitly:
observer init --claude-code # or --codex / --cursor / --cline / --all
This registers hooks regardless — the next time the client runs, its dirs get created and the watcher picks them up.
Empty dashboard / "No proxy traffic"
Session/action data populates passively whenever observer start is
running, but ground-truth cost / compression numbers require the
proxy. Route your tool through it — the quickest way is the
dashboard's Compression tab → Proxy banner → Route through the
observer proxy… button; every other mechanism (wrappers, env vars,
observer init) is listed under
Per-AI-client setup.
Verify with observer status | grep api_turns — count should
climb during AI-client activity.
observer --version says dev
You're on a non-released build. Reinstall a tagged release with pip install --force-reinstall superbased-observer (or uv tool install --force superbased-observer), or rebuild with the workflow's -X main.version=$VERSION ldflag.
tool_result block must have a corresponding tool_use block
Anthropic 400. Means the conversation-compression pipeline dropped
a tool_use while keeping its matching tool_result. Versions
prior to 1.3.2 had this bug; upgrade. If you're on 1.3.2+ and still
see it, file an issue with the conversation prefix.
tool use concurrency issues
Anthropic 400 surfaced in Claude Code as this message. Means the
parallel-tool-use case (multiple tool_use blocks in one assistant
message) isn't paired correctly with the multi-block tool_result
that follows. Versions prior to 1.3.2 had this bug; upgrade.
Cross-thread numbers are 0
Pre-migration data was ingested without the is_sidechain flag.
Run observer backfill --is-sidechain once to re-walk JSONL and
populate the flag on existing rows.
Migration error: duplicate column name
Race condition between concurrent daemon startups, fixed in 1.4.1.
Upgrade. If you still see it, run daemons serially: observer watch, wait, then observer dashboard, then observer proxy start (or just use observer start which runs all three in one
process — proxy + watcher + dashboard).
observer start log says only proxy + observer — no :8081
You're on a pre-1.4.7 build. Earlier versions ran only proxy +
watcher under observer start; the dashboard had to be started
separately via observer dashboard --addr 127.0.0.1:8081. Upgrade
to 1.4.7+ — the dashboard goroutine is now part of observer start
and the log line confirms all three: proxy <addr> + watcher + dashboard http://127.0.0.1:8081. Pass --no-dashboard to opt out.
"address already in use" on port 8820
Another observer proxy start or observer start is still running.
Find it with pgrep -af 'observer (proxy|start)' and kill <pid>.
On macOS:
lsof -nP -iTCP:8820 -sTCP:LISTEN
kill <pid>
Dashboard port already in use
observer dashboard --addr 127.0.0.1:8082    # pick a different port
# or
[dashboard]
port = 8082                                  # in config.toml
Security and privacy
Local-only. No telemetry. No remote anything. The watcher, hook handler, dashboard, MCP server, and CLI never make an outbound network call on observer's behalf. The only code paths that touch the network are the optional API proxy (which forwards your requests unchanged to the AI provider you already use) and a handful of explicit opt-in features (message-summary LLM, codegraph MCP, Teams org-server).
The full privacy statement — what observer stores, what it reads,
what it never stores, the explicit list of outbound-network call sites
gated behind config, and how to verify "no telemetry" yourself with
grep, strings, and a network-namespaced shell — lives in
PRIVACY.md.
Operational shorthand:
- Local-only HTTP. The proxy and dashboard bind to
127.0.0.1by default. Don't bind to0.0.0.0unless you've thought about it — there's no auth. - Secrets scrubbing. Tool inputs and outputs pass through
internal/scrub/before persistence; review the regex set if your secrets follow non-default formats. - Database.
~/.observer/observer.dbis a SQLite file with the same security posture as your~/.claude/and~/.codex/session logs (which already hold the same content). Encrypt the disk if your threat model needs that. - Full delete.
rm -rf ~/.observer/removes everything observer ever stored — no traces elsewhere on your system.
Source, contributing, license
- Source: https://github.com/marmutapp/superbased-observer
- Specification:
superbased-final-spec-v2.mdin the repo - Issues: https://github.com/marmutapp/superbased-observer/issues
- License: Apache 2.0
- Author: Santosh Kathira contact@superbased.app
This PyPI package is a thin Python launcher (observer/__main__.py)
that os.execvs the bundled prebuilt binary. Same shape as ruff /
uv / polars — each platform-tagged wheel bundles its
platform's binary directly, and pip's wheel-tag selector picks the
matching one. The Go source lives in the main repo; binaries are
cross-compiled per release tag via GitHub Actions and published
as superbased-observer (PyPI) and @superbased/observer (npm)
side-by-side from the same v* tag.
Release history Release notifications | RSS feed


Download files
Download the file for your platform. If you're not sure which to choose, learn more about installing packages.
Source Distributions
Built Distributions
Filter files by name, interpreter, ABI, and platform.
If you're not sure about the file name format, learn more about wheel file names.
Copy a direct link to the current filters
File details
Details for the file superbased_observer-1.11.0-py3-none-win_amd64.whl.
File metadata
- Download URL: superbased_observer-1.11.0-py3-none-win_amd64.whl
- Upload date:
- Size: 14.7 MB
- Tags: Python 3, Windows x86-64
- Uploaded using Trusted Publishing? No
- Uploaded via: twine/6.1.0 CPython/3.13.12
File hashes
| Algorithm | Hash digest | |
|---|---|---|
| SHA256 |
0c86259ece8c4989db3a66ce6b50ea0705b5aa798d74eb4b1e3360f9475261f4
|
|
| MD5 |
1927a51957fb234a4edb742942d89472
|
|
| BLAKE2b-256 |
cd56b0e834a60aeab9da3443e4d06e2b7be1072fe709d1480c9e1d7b95760062
|
File details
Details for the file superbased_observer-1.11.0-py3-none-manylinux2014_x86_64.whl.
File metadata
- Download URL: superbased_observer-1.11.0-py3-none-manylinux2014_x86_64.whl
- Upload date:
- Size: 17.7 MB
- Tags: Python 3
- Uploaded using Trusted Publishing? No
- Uploaded via: twine/6.1.0 CPython/3.13.12
File hashes
| Algorithm | Hash digest | |
|---|---|---|
| SHA256 |
153a93770b4425bd376a9be1a7006dd04677e4df4adbfb1f5cc0c50463353118
|
|
| MD5 |
140bf3565f399892daa7d7b6a4f74d8b
|
|
| BLAKE2b-256 |
93767e9e2150da5218cdac42151cc1154c193054d91fb262d21904b1fb3e133b
|
File details
Details for the file superbased_observer-1.11.0-py3-none-manylinux2014_aarch64.whl.
File metadata
- Download URL: superbased_observer-1.11.0-py3-none-manylinux2014_aarch64.whl
- Upload date:
- Size: 16.6 MB
- Tags: Python 3
- Uploaded using Trusted Publishing? No
- Uploaded via: twine/6.1.0 CPython/3.13.12
File hashes
| Algorithm | Hash digest | |
|---|---|---|
| SHA256 |
f282d0a29bd873f086227b538cadae3c16ac2fcc35c4708a2778e36b58994b7c
|
|
| MD5 |
0b59ef815ca57c8580e4006d4e6626c4
|
|
| BLAKE2b-256 |
c5675fe7ee449a2586464ac2b753dd4aff69a0aac5b81c13c956ef915b1c12d7
|
File details
Details for the file superbased_observer-1.11.0-py3-none-macosx_11_0_arm64.whl.
File metadata
- Download URL: superbased_observer-1.11.0-py3-none-macosx_11_0_arm64.whl
- Upload date:
- Size: 14.0 MB
- Tags: Python 3, macOS 11.0+ ARM64
- Uploaded using Trusted Publishing? No
- Uploaded via: twine/6.1.0 CPython/3.13.12
File hashes
| Algorithm | Hash digest | |
|---|---|---|
| SHA256 |
59d5325dd5861081bd38b57ee71d297491e62fc051af2ac231ff952e6370c0f7
|
|
| MD5 |
840c092f531b4bb7de868b1a130210a3
|
|
| BLAKE2b-256 |
a3e5b211c779e99b72aee1caf3389c327cef1ab06e1bab07700608379a816ba0
|
File details
Details for the file superbased_observer-1.11.0-py3-none-macosx_10_15_x86_64.whl.
File metadata
- Download URL: superbased_observer-1.11.0-py3-none-macosx_10_15_x86_64.whl
- Upload date:
- Size: 14.7 MB
- Tags: Python 3, macOS 10.15+ x86-64
- Uploaded using Trusted Publishing? No
- Uploaded via: twine/6.1.0 CPython/3.13.12
File hashes
| Algorithm | Hash digest | |
|---|---|---|
| SHA256 |
a39ba79a5439ec8842dc5939f67ec40b13bfeb77325b9ca4c0e7dfb4e217b610
|
|
| MD5 |
f0172a7c88e386f556a86b3bc89acaa8
|
|
| BLAKE2b-256 |
42e84d1bf2b48161d7dec02346b04da3de0c24c448f441eeaaa19bed32f47cb0
|






