
tareco
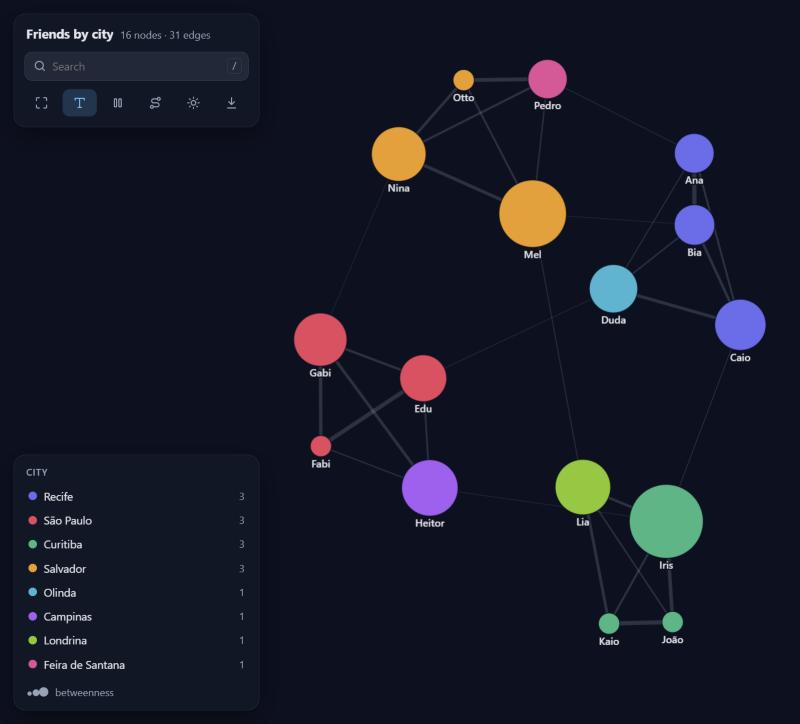
Graphs made simple. Hand it a CSV, a DataFrame or a list of pairs and get a beautiful interactive graph you can drag, search and click through. Then ask it real questions: who matters most, who bridges groups, which communities exist, what is the shortest route.
No dependencies. Every algorithm is written from scratch in pure Python, and the view is a single self-contained HTML file that works offline.
pip install tareco
One line
import tareco

tareco.show("friends.csv")
That's it. Columns named from/to, source/target, origem/destino
(and friends) are found on their own, otherwise the first two columns are used.
Every other column becomes an edge attribute. Nodes are colored by community
and sized by importance automatically.
It also takes whatever you already have:
tareco.show([("ana", "bia"), ("bia", "caio", 3.5)])          # pairs, optional weight
tareco.show({"ana": ["bia", "caio"], "bia": ["davi"]})       # dict of neighbors
tareco.show(df)                                              # pandas or polars DataFrame
tareco.show(spark_df)                                        # Spark DataFrame
tareco.show("friends.csv", nodes="people.csv")               # node attributes too
tareco.show(df, source="sender", target="receiver", directed=True)
From the terminal:
tareco friends.csv --nodes people.csv --color city
tareco transfers.csv --directed --max-nodes 20000 -o transfers.html
The view
- Hover a node to light up its neighborhood; click it for a side panel with its metrics, attributes and clickable neighbors.
- Drag nodes around; dragged nodes stay pinned (right-click to release).
- Search with
/, jump with Enter. - Shortest path mode: click two nodes and the route lights up.
- Legend filters: click a group to hide it, double-click to see only it.
- Freeze the layout, toggle labels, switch dark/light, save a PNG.
- Directed graphs get arrows;
particles=Trueanimates the flow. dim=3gives you a 3D graph you can orbit.
g.show(
    color="city",            # attribute or metric: "community", "pagerank", "degree",
                             # "betweenness", "closeness", "clustering", "core", "component"
    size="betweenness",      # same options, numbers only
    label="name",            # attribute to display instead of the id
    edge_width="messages",   # defaults to "weight" when edges have one
    title="Friends",
    theme="dark",            # "auto", "dark", "light"
)
g.save("friends.html")       # standalone file, send it to anyone
color and size also accept a {node: value} dict (like the output of any
algorithm), a function of the node, or a fixed CSS color.
Notebooks and Databricks
In Jupyter, VS Code, Colab and Databricks, g.show() draws the graph right in
the cell, and so does leaving a graph as the last line of a cell. On Databricks
it goes through displayHTML. Where there is neither a notebook nor a browser
(a cluster job, a server), the page is saved to a temporary file and its path is
printed.
Notebook output is kept under a size budget, because big outputs get cut:
Databricks truncates cell output at 10 MB by default (DBR 17+). If a graph does
not fit, tareco keeps its most important part and says so in the header
(48,000 of 1,200,000 nodes). Pass budget_mb= to change it; on Databricks,
%set_cell_max_output_size_in_mb 20 raises the limit.
Spark
from pyspark.sql import functions as F

transfers = spark.table("payments.transfers")   # from_account, to_account, amount, ...

edges = (transfers
         .groupBy("from_account", "to_account")
         .agg(F.sum("amount").alias("weight"), F.count("*").alias("count")))

g = tareco.Graph(edges, source="from_account", target="to_account", directed=True)
g.show(title="Transfers")
A Spark DataFrame is streamed to the driver one partition at a time (no pandas
needed), and DECIMAL columns become floats. Anything above max_rows rows
(1,000,000 by default) is refused with a hint to aggregate in Spark first, which
is almost always the right move: a graph of who-pays-whom with a total per pair
is far smaller than the raw transactions. max_rows=None lifts the limit.
Big graphs
Tens of thousands of nodes are fine. The view changes strategy as the graph grows:
- Up to 2,000 nodes / 8,000 edges: the canvas view above, animated.
- Bigger: a WebGL view (sigma.js). The layout runs in a background worker, so the page never freezes while it settles, and edges fade with density so structure shows instead of a white blob. Nodes are pulled toward their community, so groups read as islands.
- Group overview: every community (or every value of a categorical
color) becomes one bubble, sized by members and linked by how much they interact. Click a bubble to open just that group; very big graphs open here first. - Trimming: past
max_nodes(50,000) ormax_edges(200,000), only the most important nodes (by PageRank) and the heaviest edges are embedded. The overview still counts everything.
g.show(renderer="webgl")              # force a renderer: "auto", "canvas", "webgl"
g.show(max_nodes=20_000)              # embed less (smaller, faster page)
g.betweenness(k=500)                  # estimate from 500 sources instead of all nodes
Community detection handles 50,000 nodes and 200,000 edges in about two seconds, in pure Python.
The graph
g = tareco.Graph("friends.csv", nodes="people.csv")

g.add_edge("Ana", "Zeca", weight=2, since=2019)
g.add_node("Zeca", city="Recife")

g.nodes["Ana"]              # {'city': 'Recife', 'age': 31}
g.edges["Ana", "Bia"]       # {'messages': 42}
g.neighbors("Ana")          # ['Bia', 'Caio', 'Duda', 'Pedro', 'Zeca']
g.degree("Ana")             # 5
len(g), g.edge_count        # (17, 32)

g.subgraph(["Ana", "Bia", "Caio"])
g.ego("Ana", radius=2)       # everyone within two steps
g.reverse(), g.to_undirected(), g.copy()
The questions
| Ask | Method |
|---|---|
| Overview | g.summary() |
| Shortest route | g.shortest_path(a, b, weight=None), g.distance(a, b), g.distances(a) |
| Who is important | g.pagerank(), g.degree_centrality() |
| Who bridges groups | g.betweenness(k=None) (k sources estimate it fast) |
| Who is close to everyone | g.closeness() |
| Which groups exist | g.communities() (Louvain), g.modularity(groups) |
| Are they connected | g.components(), g.strong_components(), g.is_connected() |
| How tight is it | g.clustering(), g.triangles(), g.transitivity(), g.density() |
| The core | g.core_number(), g.k_core(k) |
| Who should meet | g.suggest_links(node=None, top=10) (Adamic-Adar) |
| Cheapest wiring | g.spanning_tree(weight="weight") |
| Order of tasks | g.topological_sort(), g.has_cycle() |
| Size of the world | g.diameter() |
| Walk it | g.bfs(a), g.dfs(a) |
Results are plain dicts, lists and sets. Pass weight="some_attribute" to use
edge weights. The algorithms are tested against networkx and give the same
numbers.
Ready-made graphs
tareco.community_graph([30, 20, 10])   # planted groups, great for testing communities()
tareco.scale_free_graph(500, 2)        # a few big hubs, like the web
tareco.small_world_graph(100, 4, 0.1)  # ring with shortcuts
tareco.random_graph(100, 0.05)
tareco.grid_graph(10, 10), tareco.complete_graph(8), tareco.star_graph(6)
tareco.path_graph(5), tareco.cycle_graph(5)
In and out
g.to_csv("edges.csv", "nodes.csv")    tareco.read_csv("edges.csv", "nodes.csv")
g.to_json("graph.json")               tareco.read_json("graph.json")
nodes_df, edges_df = g.to_pandas()    tareco.Graph(df, nodes=nodes_df)
g.to_networkx()                       tareco.Graph(nx_graph)
CSV files may use , ; \t or |, and 1,5-style decimals are understood.
Development
pip install -e ".[test]"
pytest
The interactive views are drawn with force-graph, sigma.js and graphology (all MIT), bundled inside the package so pages work offline. The 3D view loads 3d-force-graph from a CDN.
1 maintainer

Metadata
1 maintainer
Release files for tareco 1.1.0
For a detailed explanation of source distributions (sdists) and built distributions (wheels), please see the package formats documentation.
Source distribution (sdist)
| File | Size | Uploaded | Provenance | Actions |
|---|---|---|---|---|
| tareco-1.1.0.tar.gz | 187.1 kB | With provenance | Details for tareco-1.1.0.tar.gz |
Built distribution (wheel)
| File | Interpreter | ABI | Platform | Actions Reset |
|---|---|---|---|---|
| tareco-1.1.0-py3-none-any.whl | Python 3 | none | any | Details for tareco-1.1.0-py3-none-any.whl |
Total release size: 367.0 kB
Release files / tareco-1.1.0.tar.gz
| Download URL | tareco-1.1.0.tar.gz |
|---|---|
| Size | 187.1 kB |
| Tags | Source |
|
SHA-256 checksum How to use checksums |
360cba2ab1cf7268bd9cbcd6bd80ce3ac084595040e8f59a624b44e3823e2f39
|
|
BLAKE2b-256 checksum How to use checksums |
75222d645f5b5c0b49f5924e13d9118604f571e8d17d283e7ca5a4fc01d460d4
|
| Upload date | |
|
Uploaded using Trusted Publishing? What is trusted publishing? |
Yes |
| Uploaded via |
twine/7.0.0 CPython/3.13.16
|
Provenance
Provenance describes where a file came from. On PyPI, provenance is shared via attestations, which provide a verifiable record of the build or publishing details. View details, limitations and caveats.


PyPI Publish Attestation
PyPI verified that this artifact, at this checksum, originated from the publisher listed below.
Signed by GitHub Actions, verified by PyPI on Oct 21, 2026.
Transparency logRelease files / tareco-1.1.0-py3-none-any.whl
| Download URL | tareco-1.1.0-py3-none-any.whl |
|---|---|
| Size | 179.9 kB |
| Tags | Python 3 |
|
SHA-256 checksum How to use checksums |
a7711a76432f175e1133b91ea4ab753e437f50eefbe6921e5fe4695db60db56c
|
|
BLAKE2b-256 checksum How to use checksums |
6cbf9088baaae47e1e0d5d0849da96e1668df19c64f2c21dbc98ec079091e54a
|
| Upload date | |
|
Uploaded using Trusted Publishing? What is trusted publishing? |
Yes |
| Uploaded via |
twine/7.0.0 CPython/3.13.16
|
Provenance
Provenance describes where a file came from. On PyPI, provenance is shared via attestations, which provide a verifiable record of the build or publishing details. View details, limitations and caveats.
PyPI Publish Attestation
PyPI verified that this artifact, at this checksum, originated from the publisher listed below.
Signed by GitHub Actions, verified by PyPI on Oct 21, 2026.
Transparency logSecurity for tareco 1.1.0
Provenance
Provenance describes where a file came from. On PyPI, provenance is shared via attestations, which provide a verifiable record of the build or publishing details. View details, limitations and caveats.
Full provenance
Both files in this release have been uploaded with provenance metadata.
Attestation for tareco-1.1.0.tar.gz
PyPI Publish Attestation
PyPI verified that this artifact, at this checksum, originated from the publisher listed below.
Signed by GitHub Actions, verified by PyPI on Oct 21, 2026.
Transparency logA note on package security
PyPI is a repository for distributing packages, not a service for auditing them. While third-party security researchers and our staff do their best to detect and remove malicious packages, PyPI cannot guarantee the quality, security or suitability of any given package.
To learn more about protecting yourself from malicious actors, visit our package security documentation.














