A python package to visualize npath outputs in python and much more ...

Project description
tdnpathviz
tdnpathviz is a Python package that provides a set of convenient functions to generate various types of visualizations directly within a Teradata Vantage database. It leverages the in-database capabilities of Teradata Vantage including path analysis and in-database plotting (TD_PLOT) for Teradata SQLE 17.20 and later versions.
Installation
Install the package via pip:
pip install tdnpathviz
Usage
Here are the available functions in the Vantage Visualizer package:
plot_first_main_paths()create_all_pathes_views()scatter_plot()pair_plot()plot_correlation_heatmap()plotcurves()plotcurvescluster()plot_with_background_image()npath_widget()
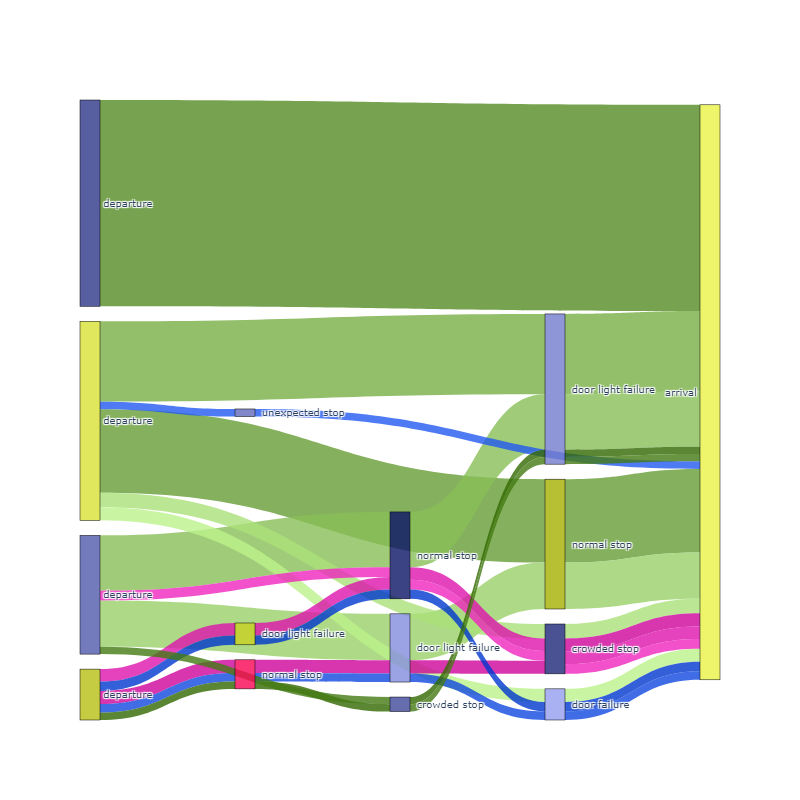
Example: Plotting First Main Paths
Here is an example of how to use the plot_first_main_paths() function:
from tdnpathviz.visualizations import plot_first_main_paths

# Assume 'myPathAnalysis' is your DataFrame which contains path analysis data

plot_first_main_paths(
    myPathAnalysis=myPathAnalysis,
    path_column='your_path_column',
    id_column='your_id_column',
    nb_paths=15,
    print_query=False,
    font_size=10,
    width=1200,
    height=800,
    weight_column = 'your_weight_column',
    weight_agg = 'count',
    justify='left'
)
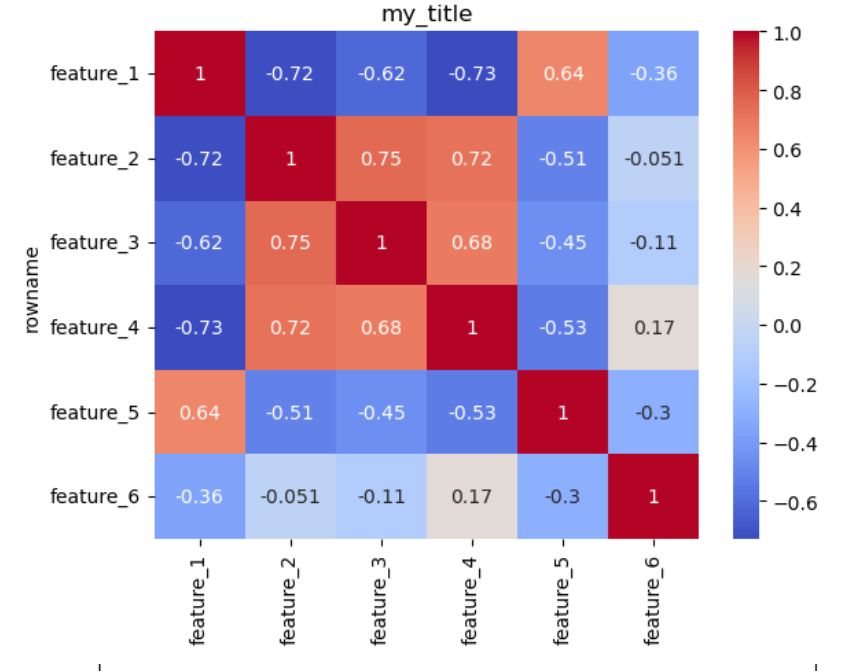
Example: Correlation Heatmap
Here is an example of how to use the plot_correlation_heatmap() function to create a correlation heatmap:
from tdnpathviz.visualizations import plot_correlation_heatmap

# Assume 'tddf' is your teradata DataFrame
plot_correlation_heatmap(tddf)

# You can pass additional parameters, e.g., ax for specific matplotlib axis, no_plot if you don't want to display the plot,
# or a title for your plot.
# plot_correlation_heatmap(tddf, ax=your_matplotlib_axis, no_plot=True, title="My Correlation Heatmap")
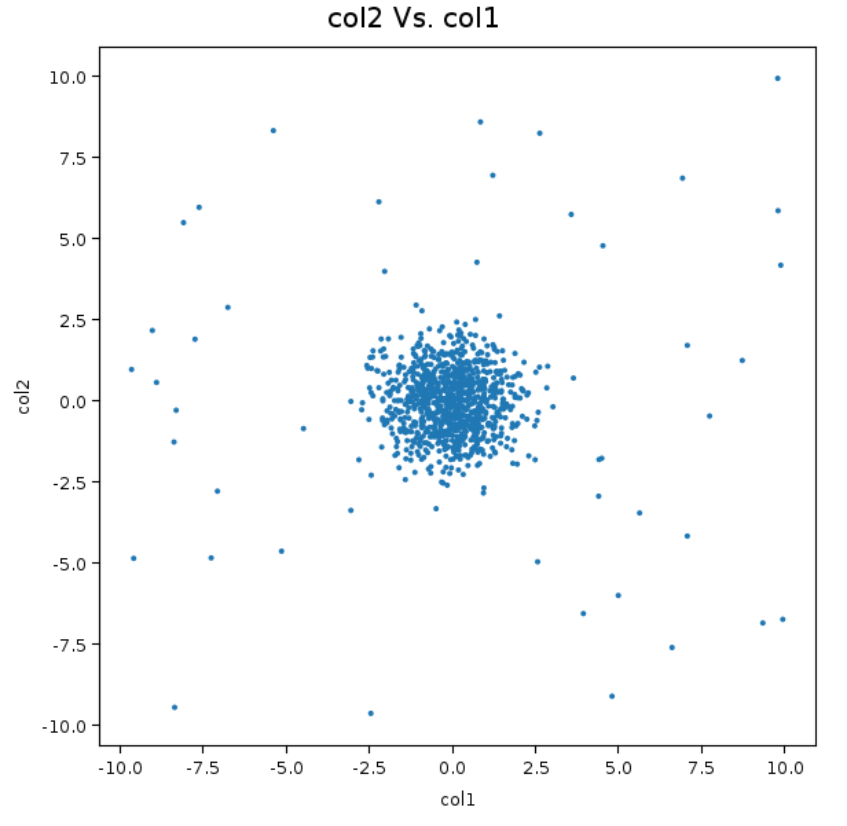
Example: Scatter Plot
Here is an example of how to use the scatter_plot() function:
from tdnpathviz.visualizations import scatter_plot

# Assume 'tddf' is your teradata DataFrame

scatter_plot(
    tddf=tddf,
    x_col='col1',
    y_col='col2'
)
Example: NPath Widget
Here is an example of how to use the npath_widget() function:
from tdnpathviz import npath_widget

# Assume 'mydb' is your Database with tables or views with event data
npath_widget(database="mydb")
Release history Release notifications | RSS feed


Download files
Download the file for your platform. If you're not sure which to choose, learn more about installing packages.
Source Distributions
Built Distribution
Filter files by name, interpreter, ABI, and platform.
If you're not sure about the file name format, learn more about wheel file names.
Copy a direct link to the current filters
File details
Details for the file tdnpathviz-0.1.3.0-py3-none-any.whl.
File metadata
- Download URL: tdnpathviz-0.1.3.0-py3-none-any.whl
- Upload date:
- Size: 409.1 kB
- Tags: Python 3
- Uploaded using Trusted Publishing? No
- Uploaded via: twine/4.0.2 CPython/3.12.3
File hashes
| Algorithm | Hash digest | |
|---|---|---|
| SHA256 |
ff3d5145e60e813f251ba7a76928581ccc3b0b0a4a4443b53075b357422dcf71
|
|
| MD5 |
025a8c5f9bbfacbd3cfdd7bf7590e592
|
|
| BLAKE2b-256 |
780131c56e1dddbd3fdef430844031729e2483ca71d39f15a91af49440e7d516
|


